
An Analysis of Correlations between Empathy and Both EEG and
HEG during Text Chat
Masaki Omata
1
and Kana Watanabe
2
1
Graduate Faculty of Interdisciplinary Research, University of Yamanashi, Kofu, Yamanashi, Japan
2
Department of Computer Science and Engineering, University of Yamanashi, Kofu, Yamanashi, Japan
Keywords: Text chat, Emotion, Electroencephalography, Hemoencephalography.
Abstract: We have addressed a problem that emotions associated with texts are not correctly conveyed in text chat. In
this study, we conducted two experiments to analyze whether electroencephalography (EEG) and
hemoencephalography (HEG) of a receiver can be used to identify the receiver’s empathic state when the
receiver is empathizing with the emotion associated with the text sent by a sender. As the results, we found
that emotional valence was more likely to be empathized with in text-based chat, but emotional arousal was
less likely to be empathized with. We also found that the power of theta waves at O1 (in the occipital region)
of the empathic receivers was significantly lower than that of the non-empathic receivers.
1 INTRODUCTION
People communicate using a variety of modalities
such as text, voice, and video with increasing
popularity of smartphones and social networking
services (IICP of MIC, 2019). Among the modalities,
text-based communication, such as chat and email,
has an advantage of being less constrained in time and
space, and is easier to communicate anytime and
anywhere. On the other hand, a disadvantage of text-
based communication is that it lacks visual
information (such as facial expressions and body
language) and auditory information (such as tone and
volume of voice) compared to voice, video, and face-
to-face communication, and thus may not correctly
convey emotions to a receiver. If the emotions are not
conveyed correctly to the receiver, there is a
possibility that the receiver will not understand the
emotions and will not sympathize with them.
To address the problem, we have proposed use of
physiological signals of the receiver to estimate the
receiver’s empathy with regard to emotions of
conversational content in the text. The reason for
using physiological signals is that physiological
signals can be measured continuously and
unconsciously, and can be used without burdening
users with interruptions or interventions during a text
conversation. If our proposed system is able to
estimate empathy from physiological signals, it will
be able to feed back the receiver’s empathy to the
sender immediately during text chatting, which will
make communication smoother in the future.
In this paper, we introduce related studies and
indicate the position of our study in the next section.
After that, we explain the first experiment, which
examines correlations between the empathizer’s
emotions and both electroencephalography (EEG)
(Nunez et al., 2007) and hemoencephalography
(HEG) (Tinius, 2004) during text chatting. Then, we
explain the second experiment, in which we added
data based on the results of the first experiment. Our
contribution in this paper is that we mentioned the
possibility of using the theta waves of the EEG on the
occipital region of the empathizers (receivers) to
estimate their empathies generated from the text chat.
2 RELATED WORK
Kinoshita et al. measured affective sharing from EEG
signals and conducted an experiment in which
participants communicated using facial expressions
of joy, sadness, and neutrality (Kinoshita et al., 2019).
The results showed that correlations of EEG powers
were significantly higher under the high affective
sharing condition compared to the low affective
sharing condition, and that the correlations of the
EEG powers were significantly higher under the joy
Omata, M. and Watanabe, K.
An Analysis of Correlations between Empathy and Both EEG and HEG during Text Chat.
DOI: 10.5220/0011376800003323
In Proceedings of the 6th International Conference on Computer-Human Interaction Research and Applications (CHIRA 2022), pages 105-112
ISBN: 978-989-758-609-5; ISSN: 2184-3244
Copyright
c
2022 by SCITEPRESS – Science and Technology Publications, Lda. All rights reserved
105

and sadness conditions in the alpha-mu band. The
results have suggested possibility to measure
affective sharing in response to emotional faces from
the correlation of EEG powers.
Vanderhaegen et al. studied synchronization
between dynamic events with heartbeats on non-
conscious errors in the control of dynamic events by
comparing two groups of subjects: a group for which
alarms were activated synchronously with the current
heart rate of the subjects and a group for which the
alarms were activated without being synchronized
with the current heart rates of the subjects
(Vanderhaegen et al., 2020). The results showed that
there was a significant impact of such a
synchronization of events with heartbeat.
Jain et al. looked at and analyzed how messages
sent on instant messages or posts on social networks
are interpreted by readers in terms of the emotional
state of the sender (Jain et al., 2016). As the results of
Spearman’s rank-correlation coefficient about the
Self-Assessment Manikin (SAM) (Bradley et al.,
1994), they found that a high correlation (ρ = 0.80)
was found between valence of the sender for each
message and perceived valence of the sender, and that
no correlation (ρ = 0.11) was found between arousal
of the sender for each message and perceived arousal
of the sender. These indicated how easily and
accurately valence is conveyed while arousal is
almost never conveyed accurately.
Ghosh et al. designed and implemented an
Android application TapSense which traced
smartphone typing and records self-reported emotion
state and conducted an online survey to understand
the typing habits in smartphones and collect feedback
on multiple measurable parameters that affect their
emotion while typing (Ghosh et al., 2017). As the
results, they observed that using only typing features,
it was possible to identify four emotion states (happy,
sad, stressed and relaxed) with an average accuracy
of 73% and a maximum of 94%.
We believe that if it is found that physiological
signals can be used to estimate the receiver’s empathy
as in Kinoshita et al. (Kinoshita et al., 2019) in text
chatting, which is our research target, we will be able
to provide a user interface that supports smoother
communication with emotions in text chatting than
before. Specifically, we have been designing a user
interface that sequentially estimates the receiver’s
empathy from the physiological signals and provides
feedback to the sender on a receiver’s level of the
empathy, and a user interface that automatically
decorates text according to the receiver’s level of
empathy. The reason for using physiological signals
in this way is that physiological signals are not as
subjectively controllable by the user intentionally as
questionnaire surveys, can be measured continuously,
and do not interfere with the user’s operation. For this
purpose, in this paper, we asked senders and receivers
to answer their emotions in text chat using SAM, as
in Jain et al. and then recorded the receivers’ EEG and
HEG, as in Kinoshita et al. (Kinoshita et al., 2019)
and analyzed the correlation between the receivers’
emotions and the physiological signals.
3 EXPERIMENT FOR ANALYSIS
OF PHYSIOLOGICAL SIGNALS
DURING EMPATHY
In this experiment, we analyzed correlation between
physiological signals and empathy for chat text by
recording physiological signals of receivers during
text chat and comparing them with their normal
conditions.
3.1 Physiological Signals
Electroencephalography (EEG) and
hemoencephalography (HEG) were measured in this
experiment. The EEG and HEG sensors were
connected to an encoder (Thought Technology Ltd.,
ProComp INFINITI) (Thought Technology Ltd.,
2022). In this section, the properties of the
physiological signals are described.
3.1.1 EEG
EEG is a record of the oscillations of brain electric
potentials recorded from electrodes attached to the
human scalp (Nunez et al., 2007). The frequency
ranges are categorized as delta (0.5 to 3 Hz), theta (4
to 7 Hz), alpha (8 to 13 Hz) and beta (14 to 30 Hz).
Very high frequencies (typically over 40 Hz) are
referred to as gamma activity. In general, theta waves
are seen in deep meditation and slumber, alpha waves
are seen in relaxation, and beta waves are seen in
daily life, tension, and mental excitement. The power
values of theta, alpha, and beta waves are used as the
physiological indexes of this experiment. The
BioGraph INFINITI and BioGraph Infiniti Software
Platform of Thought Technology Ltd. were used to
calculate the power values.
CHIRA 2022 - 6th International Conference on Computer-Human Interaction Research and Applications
106
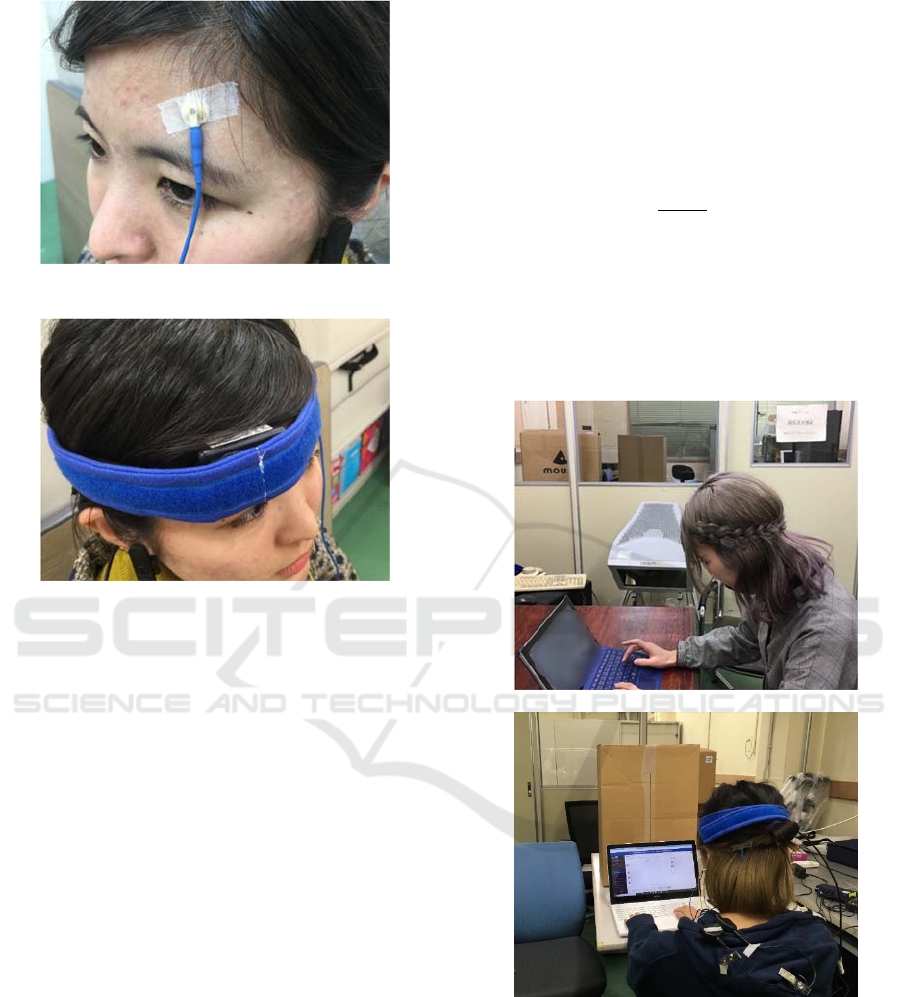
Figure 1: The EEG sensor and its installation.
Figure 2: The HEG sensor and its installation.
The EEG-Z sensor from Thought Technology,
shown in Figure 1, was used as the electrodes for the
EEG measurement. Three probe electrodes were
placed at Fp1 (left front polar), O1 (left occipital) and
O2 (right occipital) according to the International 10–
20 system (American Electroencephalographic
Society Guidelines for Standard Electrode Position
Nomenclature, 1991).
3.1.2 HEG
A HEG is relative ratio of oxidized hemoglobin to
deoxygenated hemoglobin with blood flow dynamics
and cellular metabolism in localized parts of the brain
cortex (Tinius, 2004). The measurements are closely
linked with brain activation due to the phenomenon
of neurovascular coupling. The HEG ratio (Serra-Sala
et al., 2012 and Skalski et al., 2021), calculated from
the increase or decrease of oxidized hemoglobin and
deoxidized hemoglobin in the blood flow to the
location of the frontal cortex, was used as a
physiological index in our study.
We used MediTechElectronic’s HEG-Sensor
shown in Figure 2 in order to measure the ratio. The
measurement point was Fp2 (right forehead) of the
International 10–20 system.
3.1.3 Standardization
We standardize the recorded physiological indexes by
referring to the method of Omata et al (Omata et al.,
2014) to analyze the variation of the indexes during
an experimental task from the indexes in resting state.
EEG and HEG-ratio are standardized as shown in
Equation (1),
𝑍
𝑋𝜇
𝜎
(1
)
where X is the data of each physiological index during
the experiment, μ is the mean value of the normal
state, and σ is the standard deviation.
3.2 Environment and Participants’
Roles
(a)
(b)
Figure 3: An emotional generator (a) and an empathizer (b)
during the experiment task.
As shown in Figures 3a and b, two of the participants
chatted using laptop computers in two rooms
separated by a barrier that prevented them from
directly seeing and hearing each other. We chose
slack (Slack Technologies, 2022) as the chat system
for this experiment because it is intuitive and easy to
understand for the participants, and because it is easy
An Analysis of Correlations between Empathy and Both EEG and HEG during Text Chat
107

for the participants to reproduce emotional
expressions more richly by using pictorial reactions
(Slack Technologies, 2022).
The two participants were asked to chat with each
other mainly using text, and each was assigned a role
for this experiment. One of the two was assigned the
role of transmitting emotional experiences through
the chat (hereinafter called the “emotion generator”),
and the other was assigned the role of empathizing
with the received emotional experiences (hereinafter
called the “empathizer”). The empathizer was
equipped with the physiological signal sensors as
described above.
3.3 Procedure and Task
We asked the participants to participate in the chat
experiment in pairs (emotion generator and
empathizer). First, we gave informed consent to these
two participants and obtained their consent to
participate in the experiment. After that, we took
them to separate rooms, sat them in front of a laptop
computer for chatting, and explained how to use
slack.
Before chatting, the emotion generator was asked
to recall his/her own happy and sad experiences, and
to rate the experiences on 9-point scale of emotion
valence and 9-point scale of arousal of the Self-
Assessment Manikin (SAM) (Bradley et al., 1994).
On the other hand, the empathizer was equipped with
physiological signal sensors. Then, the physiological
signals were recorded for one minute while the
sympathizer was resting and doing nothing, to be used
as baseline data for analyses.
The experimental task for both the participants
was to have a chat conversation about the happy and
sad events that the emotion generator remembered.
Before starting the chat, both the participants were
asked to familiarize themselves with slack for two
minutes (or more if either of the two requested it). At
the start of the chat task, via the chat system, the
experimenter instructed the emotion generator
“Please tell the other participant about the experience
you recalled and try to convey the emotion of the
experience as much as possible,” and instructed to the
empathizer “Please be a collocutor of the other
participant’s story and try to capture the emotion of
the story.” After the experimenter signaled the start of
the chat, both the participants chatted for about three
to five minutes based on the instructions. During the
chat, the physiological signals of the empathizer were
continuously recorded. The experimenter read the
content of the chat, and signaled the end of the chat
when the conversation was finished. Then, the
physiological signals of the empathizer were recorded
again for one minute while she was at rest doing
nothing.
After the chat was over, the empathizer was asked
to answer the emotion she recognized from the chat
text and the emotion she felt as a result of the
conversation by using the SAM. After a five-minute
break, the participants performed the same task for
the other experience that the emotion generator
recalled. The number of pairs that started with happy
experiences was equal to the number of pairs that
started with sad experiences in order to
counterbalance the order of happy and sad
experiences in the chat contents.
After completing the chat task for the two
emotions, both the participants were asked to
complete a questionnaire survey about their past
experience in using slack and their impressions of
using slack to express the emotions in this
experiment.
Eight participants (one male and seven females,
ranging in age from 21 to 23 years) participated in this
experiment. All of them had experience using slack
before the experiment. When creating pair
combinations from the participants, we paired them
with the pairs that they usually communicate with via
text chat. The empathizers in each pair were all
female. The reason for this was based on the results
of Davis’s study that women were more likely to
empathize than men (Davis, 1980).
3.4 Results
3.4.1 Correlation Analysis of Subjective
Emotions
Figure 4 shows the relationship between the
emotional valence (from negative (1) to positive (9)),
that the emotion generators responded about the
experiments they recalled and the emotional valence
(from negative (1) to positive (9)) that the
empathizers felt from the chat. Since the participants
were asked to chat about happy and sad events, the
plot points were divided into two groups. The
Spearman correlation coefficient for the plots is
0.948. This indicates that both emotion generators
and empathizers had similar emotional valences.
Figure 5 shows the relationship between the arousal
(from low (1) to high (9)) that the emotion generators
responded about the events they recalled and the
arousal (from low (1) to high (9)) that the empathizers
felt from the chat. Since the Spearman correlation
coefficient for the plots is 0.621, there was no
correlation like that of the emotion valence, and there
CHIRA 2022 - 6th International Conference on Computer-Human Interaction Research and Applications
108
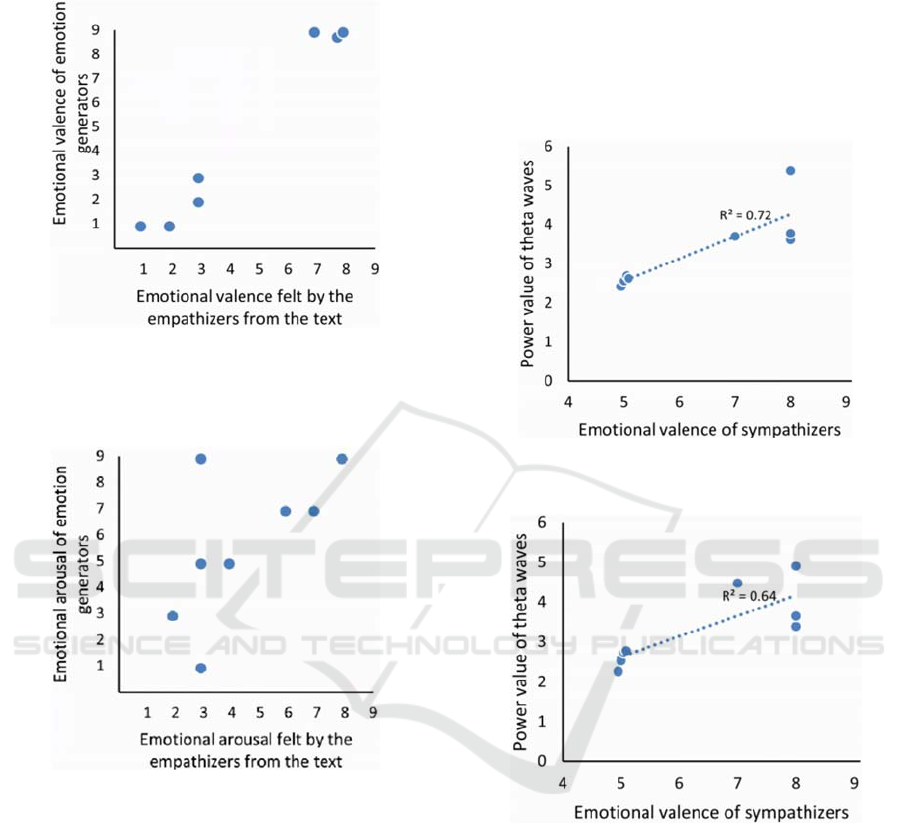
were differences in the arousal levels held by emotion
generators and empathizers.
Figure 4: The relationship between the emotional valence
(from negative (1) to positive (9)) of the emotion generators
and the emotional valence (from negative (1) to positive
(9)) felt by the empathizers from the text chat.
Figure 5: The relationship between the emotional arousal
(from low (1) to high (9)) of the emotion generators and the
emotional arousal (from low (1) to high (9)) felt by the
empathizers from the text.
3.4.2 Correlation Analysis between
Physiological Signals and Subjective
Emotions
The power values of the three frequency bands (alpha,
beta, and theta) in the EEG at three locations (Fp1,
O1, and O2) and the HEG ratio at one location (Fp2)
were analyzed for significant differences among the
three states: resting state before the task, happy
empathy, and sad empathy. As the results, there was
a significant difference (p < .05) between the resting
state and the happy empathy state in the power values
of theta waves measured at O1 and O2. There was no
significant difference (p < .05) in the HEG ratio.
Figures 6 and 7 show the correlations between the
power values of theta waves at O1 and O2 and the
subjective emotional valence of the empathizers
during resting and happy empathy, respectively.
Here, the empathizer’s valence at rest is set to 5,
which represents a neutral emotional state. Therefore,
Figure 6: Relationship between the emotional valence of the
empathizers and the power value of the theta waves of O1.
Figure 7: Relationship between the emotional valence of the
empathizers and the power value of the theta waves of O2.
these graphs show that the power value of the theta
waves increases when the neutral emotional valence
at rest is positively changed by empathy for
happiness. The R
2
in each of the graphs is its
coefficient of determination.
3.5 Discussions
Based on the results of SAM, we found that emotional
valence is easily conveyed but arousal is not easily
conveyed in text-based chat. This is consistent with
the results of the study by Jain et al (Jain et al., 2016).
From the analysis of physiological signals, we found
An Analysis of Correlations between Empathy and Both EEG and HEG during Text Chat
109
that the power value of the theta wave band of the
occipital EEG increased during empathy for chatting
about happy events. This result is in line with the
results of Knyazev’s study that theta waves are
related to emotion regulation (Knyazev, 2007).
Therefore, we argue that occipital theta waves can be
used to estimate a state of positive empathy of chat
users toward the chat contents.
4 FURTHER EXPERIMENT
We conducted another experiment to add more
participants’ data to the aforementioned experiment.
The environment, the roles of participants, the
procedure, and the task were the same as in the
aforementioned experiment. However, this
experiment differs from the previous one in the
following points.
The results of SAM in the aforementioned
experiment suggest that some participants
remembered “Angry” and “Afraid” in
Russell’s circle model (Russell, 1980).
However, we wanted them to remember Sad,
so we instructed participants to recall a sad
experience, not a bad experience.
We asked participants to recall the recent
experiments in order to generate the arousal
level more accurately.
Men were included in empathizers.
4.1 Results
4.1.1 Correlation Analysis of Subjective
Emotions
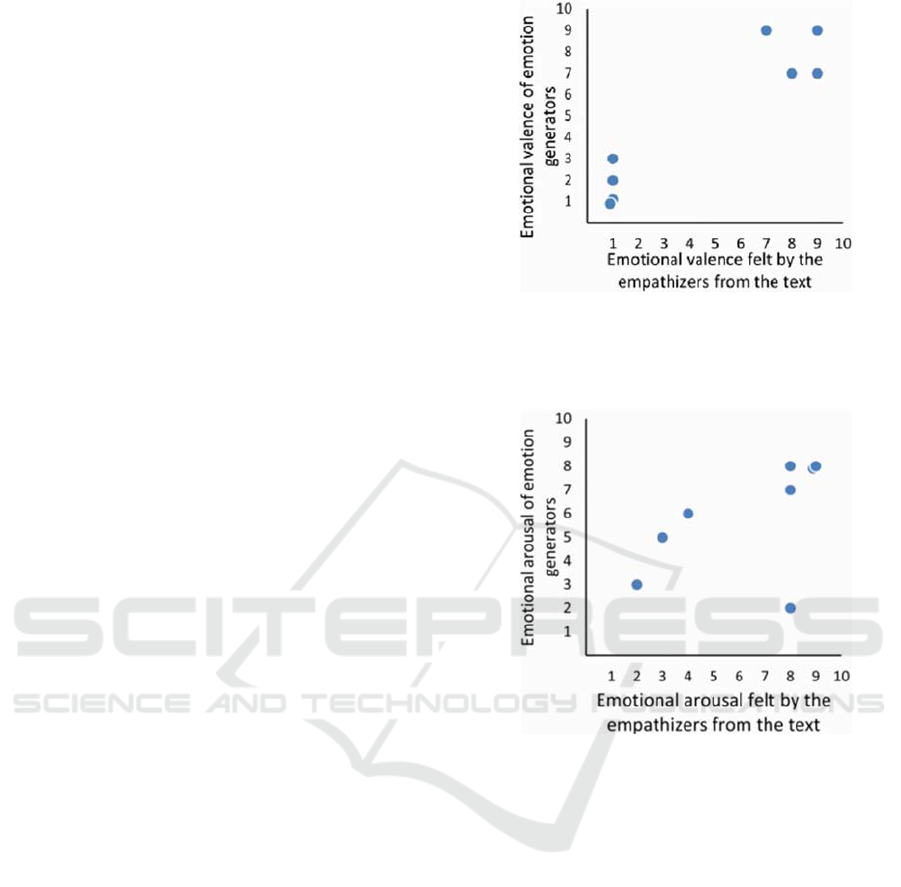
Figure 8 and 9 show the relationship between the
emotional valence (from low (1) to high (9)) and
arousal (from low (1) to high (9)) that the emotion
generators responded about the experiments they
recalled and those that the empathizers felt from the
chat. From the plots of the graphs, it can be seen that
there is a highly positive correlation (the Spearman
correlation coefficient is 0.806.) between the
emotional valences of both the roles as the results of
Section 3. On the other hand, there is low correlation
(the Spearman correlation coefficient is 0.658.)
between the emotional arousals of both the roles,
although the correlation was slightly stronger due to
the difference in instruction.
Figure 8: The relationship between the emotional valences
(from low (1) to high (9)) of the emotion generators and the
emotional valences (from low (1) to high (9)) felt by the
empathizers from the text int the further experiment.
Figure 9: The relationship between the emotional arousal
(from low (1) to high (9)) of the emotion generators and the
emotional arousal (from low (1) to high (9)) felt by the
empathizers from the text int the further experiment.
4.1.2 Correlation Analysis between
Physiological Signals and Subjective
Emotions
The power values of the three frequency bands (alpha,
beta, and theta) in the EEG at three locations (Fp1,
O1, and O2) and the HEG ratio at one location (Fp2)
were analyzed for significant differences among the
three states: resting state before the task, happy
empathy, and sad empathy. As the results, there were
no significant differences (p < .05) in the EEG and the
HEG ratio. Although there was no significant
difference, the power values of theta waves at O1 and
O2 were higher than those at rest in 7 out of 8 trials
as in the aforementioned experiment.
CHIRA 2022 - 6th International Conference on Computer-Human Interaction Research and Applications
110
4.1.3 Integrated Analysis of Data from Two
Experiments
We integrated the data from all 16 trials, including the
experiment in Section 3 and this experiment, and
divided them into two groups. Specifically, the seven
trials in which the sum of the absolute values of the
differences between the emotion generators’
responses and the empathizers’ responses from the
text and their own emotions was less than or equal to
3 were classified as empathizable group, and the nine
trials as the rest were classified as non-empathizable
group, based on the results of the SAM of the
participants of the two experiments.
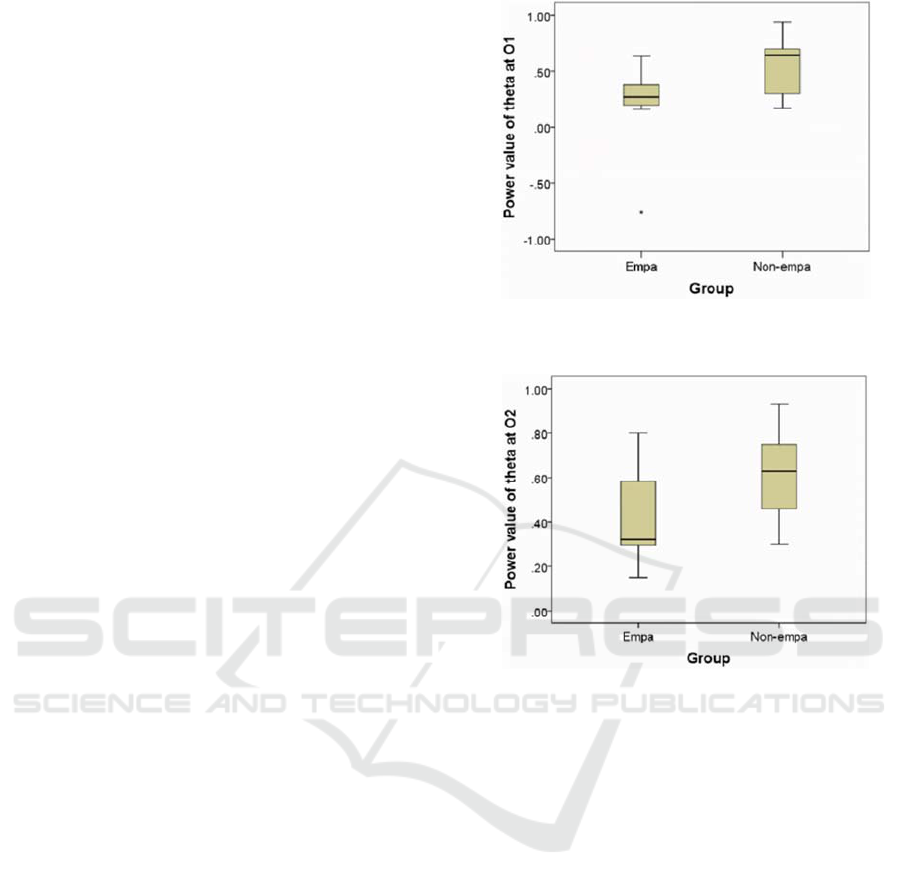
Figure 10 and Figure 11 show the power values of
theta waves at O1 and O2 for each of the two groups.
The results show that the power values at O1 in the
empathizable group was significantly lower than
those in the non-empathizable group (p < 0.05). There
was no significant difference about O2.
4.2 Discussions
From the results of responses to SAM in the two
experiments, we found that emotional valence was
more likely to be empathized with, even in text-based
chat. On the other hand, when we instructed
constraints on the degree of arousal in the further
experiment, which became easier to empathize to
some extent, but in general of the two experiments,
arousal was not easily empathized with in text-based
chat. We believe that the reason for this is that in text-
based chat, there are many words to express positive
and negative emotions, but not many words to express
level of arousal.
One of the reasons for the lack of significant
differences in physiological signals between the
resting state and the on-task state in the further
experiment may be that, unlike the aforementioned
experiment, the data included data from males, but
since the number of data is insufficient, further
additional experiments are necessary in the future.
Since the power of theta waves at O1 in the
occipital region was significantly lower in the
empathizers, who were similar to the emotional
valence and arousal of the emotion generators, we
believe that the theta waves in the occipital region can
provide data for estimating that emotion generators
and empathizers have similar emotions. However,
since it is not a simple correlation that the power value
increases when the emotions are similar, it is
necessary to conduct further experiments to analyze
the relationship between the value and the degree of
empathy in more detail.
Figure 10: The power value of theta wave at O1 in two
groups of emotion similarity difference.
Figure 11: The power value of theta wave at O2 in two
groups of emotion similarity difference.
5 CONCLUSIONS
We conclude from the two experiments that the
power of theta waves in the occipital region is higher
during empathy for the content of a text chat than at
rest, but lower when empathizing with the same
emotion of an emotion generator. Moreover, we find
that we need more data to analyze the differences in
the measurement points of physiological signals, the
relationship between EEG and HEG, and the
individual differences among participants. In
addition, we believe that further analysis of the
content of the text chat, the degree of empathy, and
the fluctuations of the physiological signals during
the text chat will show possibility of using the
physiological signals in more detail.
An Analysis of Correlations between Empathy and Both EEG and HEG during Text Chat
111

REFERENCES
American Electroencephalographic Society Guidelines for
Standard Electrode Position Nomenclature. (1991).
Journal of Clinical Neurophysiology. Vol. 8, No. 2,
200–202.
Bradley, M. M. and Lang, P. J. (1994). Measuring emotion:
The Self-Assessment Manikin and the Semantic
Differential. Journal of Behavior Therapy and
Experimental Psychiatry, Vol. 25, No. 1, 49-59.
https://doi.org/10.1016/0005-7916(94)90063-9.
Davis, M. (1980). A Multidimensional Approach to
Individual Differences in Empathy. Journal of
Personality and Social Psychology Catalog of Selected
Documents in Psychology, 10, 85.
Ghosh, S., Ganguly, N., Mitra, B., and De, P. (2017).
Evaluating effectiveness of smartphone typing as an
indicator of user emotion. In 2017 Seventh
International Conference on Affective Computing and
Intelligent Interaction (ACII). IEEE, 146–151.
Jain, M., Seshagiri, S., and Chopra, S. (2016). How do I
communicate my emotions on SNS and IMs? In
Proceedings of the 18th International Conference on
Human-Computer Interaction with Mobile Devices and
Services Adjunct (MobileHCI'16). Association for
Computing Machinery, New York, NY, USA, 767–
774. DOI:https://doi.org/10.1145/2957265.2961862.
Kinoshita, T., Tanaka, H., Yoshino, K., and Nakamura, S.
(2019). Measuring Affective Sharing between Two
People by EEG Hyperscanning. In Adjunct of the 2019
International Conference on Multimodal Interaction
(ICMI’19). Association for Computing Machinery,
New York, NY, USA, Article 3, 1–6.
DOI:https://doi.org/10.1145/3351529.3360657.
Knyazev, G. G. (2007). Motivation, Emotion, and Their
Inhibitory Control Mirrored in Brain Oscillations.
Neuroscience & Biobehavioral Reviews, Vol. 31, Issue
3, 377–395.
Nunez, P. L. and Srinivasan, R. (2007).
Electroencephalogram. Scholarpedia, Vol. 2, No.
2:1348. Retrieved Feb. 15, 2022 from
http://www.scholarpedia.org/article/Electroencephalog
ram.
Omata, M., Kanuka, D., and Mao, X. (2014). Experiments
for Emotion Estimation from Biological Signals and Its
Application. Transactions on Computational Science
XXIII Lecture Notes in Computer Science Vol. 8490,
178-198.
Russell, J. A. (1980). A Circumplex Model of Affect.
Journal of Personality and Social Psychology, 39.
1161-1178. DOI:https://doi.org/10.1037/h0077714.
Serra-Sala, M., Timoneda Gallart, C, and Pérez-Alvarez, F.
(2012). Evaluating Prefrontal Activation and Its
Relationship with Cognitive and Emotional Processes
by Means of Hemoencephalography (HEG).
Journal of Neurotherapy. 16. 183-195.
DOI:https://doi.org/10.1080/10874208.2012.705754.
Skalski, S., Pochwatko, G., and Balas, R. (2021). Effect of
HEG biofeedback on selected cognitive functions—
Randomized study in children with ADHD and
neurotypical children. Infant and Child Development,
vol. 30, No. 4, e2242. DOI:https://doi.org/10.1002/
icd.2242.
Slack Technologies. Slack Features. Retrieved Feb. 15,
2022 from https://slack.com/features.
Slack Technologies, Use emoji and reactions. Retrieved
Feb. 15, 2022 from https://slack.com/help/
articles/202931348-Use-emoji-and-reactions.
The Institute for Information and Communications Policy
of the Ministry of Internal Affairs and Communications
(IICP of MIC) (2019). FY2018 Survey Report on Usage
Time of Information and Communications Media and
Information Behavior. Retrieved February 15, 2022
from https://www.soumu.go.jp/iicp/research/results/
media_usage-time.html.
Thought Technology Ltd.. ProComp Infiniti
System. Retrieved February 15, 2022 from
https://thoughttechnology.com/procomp-infiniti-system-
w-biograph-infiniti-software-t7500m/.
Tinius, T. (2004). New Developments in Blood Flow
Hemoencephalography, Hawthorne Press.
Vanderhaegen, F., Wolff, M., Mollard, R. (2020). Non-
conscious errors in the control of dynamic events
synchronized with heartbeats: A new challenge for
human reliability study. Safety Science, Vol. 129,
104814. DOI: https://doi.org/10.1016/j.ssci.2020.
104814.
CHIRA 2022 - 6th International Conference on Computer-Human Interaction Research and Applications
112
