
Effect of Environment Size on Spatial Perception in Virtual Reality
Morten Trier Bach, Poul Anker Jensen, Andrei Iuliu Lucaci, Damian Grzegorz Pupczyk
and Claus Brøndgaard Madsen
a
Computer Graphics Group, Department of Architecture and Media Technology, Aalborg University, Aalborg, Denmark
Keywords:
Virtual Reality, Virtual Environments, Spatial Perception, Blind Walking.
Abstract:
A trend of distance underestimations in Virtual Reality (VR) is well documented, but the reason still remains
unclear. Therefore, this paper investigates the effect of differently sized Virtual Environments (VEs) on ego-
centric distance perception in VR as a potential influence. Verbal assessment, blind walking, and our own
proposed method: walk and assess, were compared in an experiment, and blind walking was found to be the
most accurate. A virtual replica of a real-life location was created as a transitional environment, while small
(15m
2
), medium (35m
2
) and large (95m
2
) rooms were created to investigate the effect of VE size on spatial
perception in VR. To establish the differences in estimations between the real world and VR when using blind
walking, a study was conducted with the virtual replica and its real life counterpart at distances between 1 and
10 meters. Following this, the three distinct room sizes were used in an experiment to investigate the effect
of the size of rooms on spatial perception in VR. The findings showed consistent underestimates of distances,
and a trend for underestimation to grow as the distance grows was observed. Similarly, underestimates grew
with the size of the environment.
1 INTRODUCTION
Virtual Reality (VR) as a technology has been shown
to be influential within the world of architecture,
where it is used to represent and simulate architec-
tural spaces Loyola (2018). Unfortunately, quite a
few researchers have found that distances in Virtual
Environments (VEs) are generally underestimated by
10 to 26 percent (Loyola (2018), Witmer and Sad-
owski Jr. (1998), Ahmed et al. (2010), Renner et al.
(2013)), which threatens the validity of the platform
as a medium for representation of spaces, and makes
it a subject worth exploring.
In an experiment done by Lucaci et al. (2022),
findings indicated general overestimation of dis-
tances. They hypothesized that it might have been
due to the relatively small size of the environment
(12.6m
2
) compared to previous research which used
larger environments ranging from 13m
2
to 233m
2
(Simpson et al. (2018), Moscoso et al. (2021), Zhao
et al. (2019)).
Lucaci et al. (2022) used Verbal Assessment to
measure perceived distances, however, Thompson
et al. (2004) have criticised the method for being sub-
jected to bias and noise.
a
https://orcid.org/0000-0003-0762-3713
With this in mind, the aim of this study was to
identify a reliable method of quantifying perceived
distances, and use that to investigate the effect of dif-
ferent sizes of VEs on spatial perception in VR.
2 SPATIAL PERCEPTION IN
VIRTUAL REALITY
Spatial perception is a combination of physiological
and cognitive processes which utilize a variety of per-
ceived depth cues to turn a two-dimensional image
into a three-dimensional representation of the world
(Renner et al., 2013).
Perceived distances can be either ego-centric or
exo-centric. Ego-centric distances refer to distances
between an observer and a point, while exo-centric
distance is the distance between two external objects.
(Maruhn et al. (2019), Renner et al. (2013))
Underestimation of ego-centric distances in Vir-
tual Reality (VR) was found to be 19% by Loyola
(2018) and 15% by Witmer and Sadowski Jr. (1998),
while real-world distances were found to be underes-
timated by 8% by Witmer and Sadowski Jr. (1998),
and 4% by Messing and Durgin (2005). These un-
derestimations are particularly evident with egocen-
Bach, M., Jensen, P., Lucaci, A., Pupczyk, D. and Madsen, C.
Effect of Environment Size on Spatial Perception in Virtual Reality.
DOI: 10.5220/0011376400003323
In Proceedings of the 6th International Conference on Computer-Human Interaction Research and Applications (CHIRA 2022), pages 97-104
ISBN: 978-989-758-609-5; ISSN: 2184-3244
Copyright
c
2022 by SCITEPRESS – Science and Technology Publications, Lda. All rights reserved
97
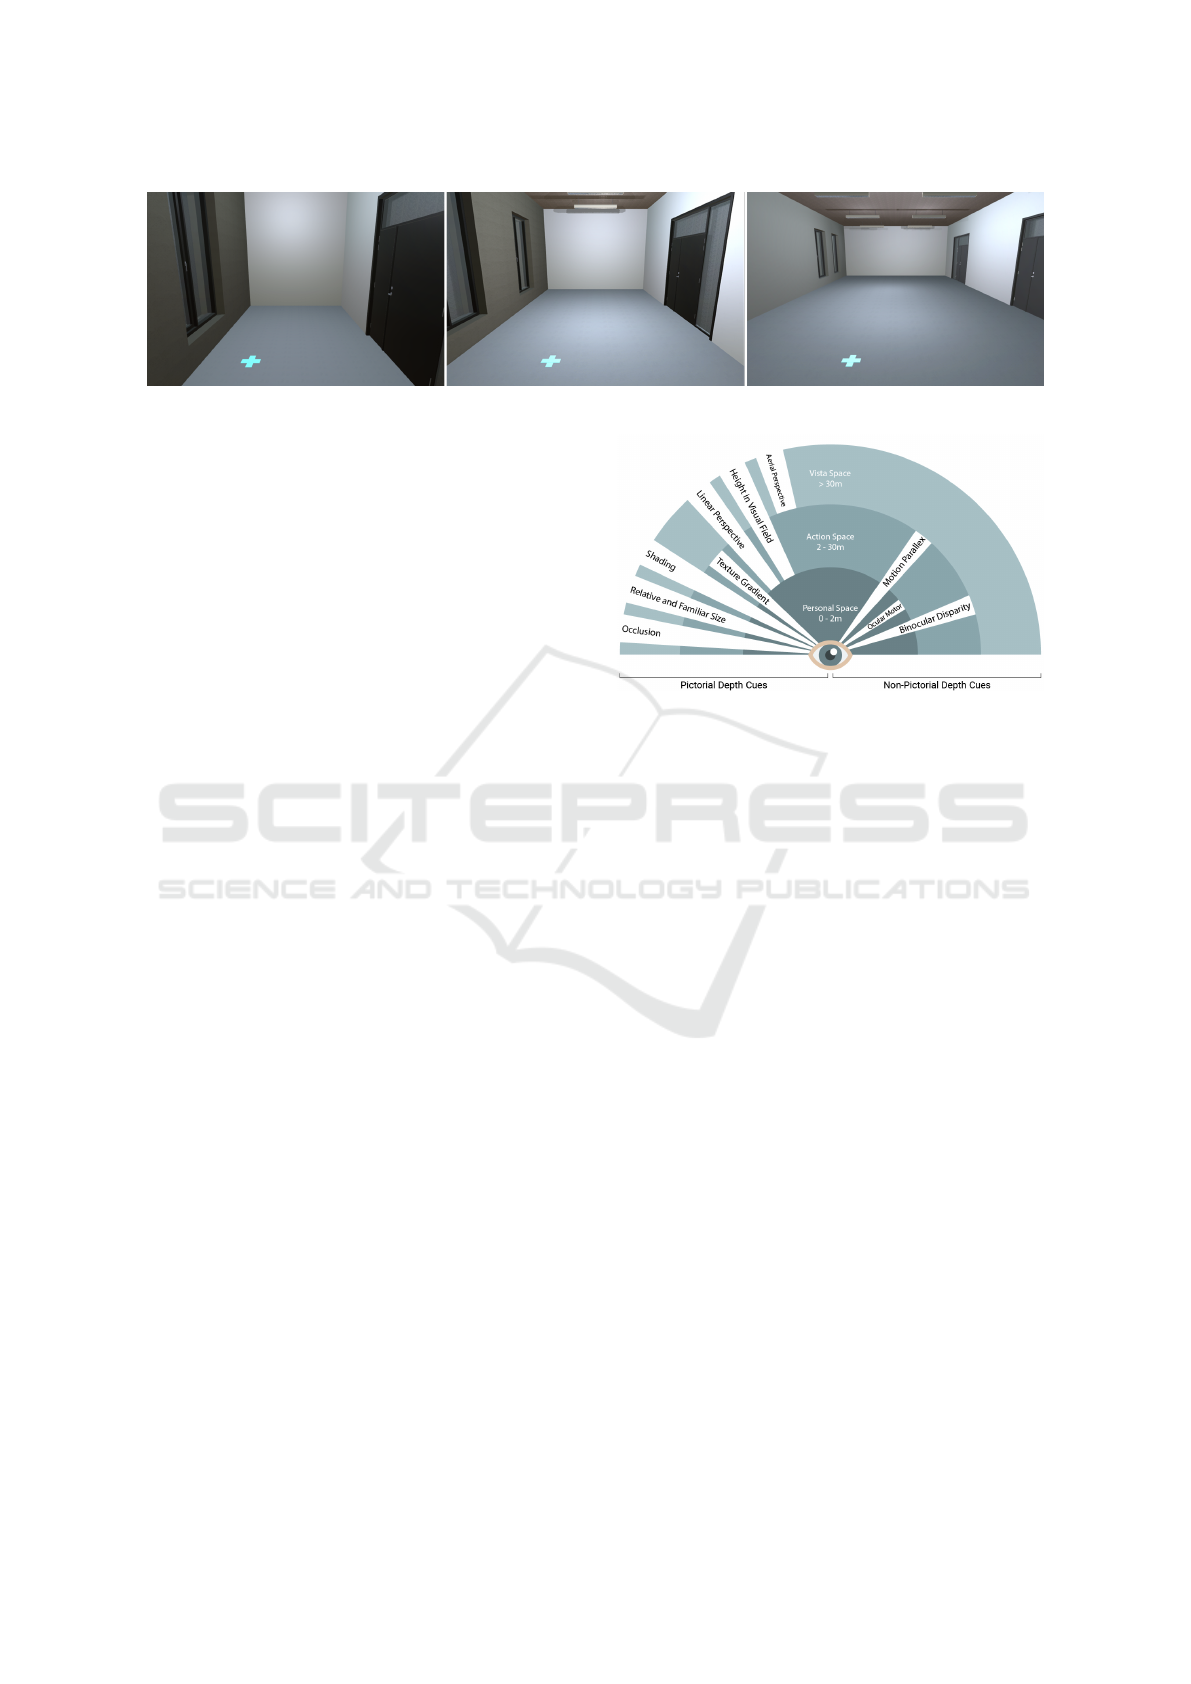
Figure 1: The three differently sized rooms used in the Room Size Experiment in Section 6.
tric distances above 1 meter. On the other hand,
some studies have indicated that exo-centric distances
in VR may be overestimated in VR. (Maruhn et al.,
2019)
However, the focus of this paper is only on ego-
centric distances to emphasize the room size effect. It
is also applicable to more methods of distance estima-
tion than exo-centric distances (see Section 4).
2.1 Depth Cues
To properly understand spatial perception, a basic un-
derstanding of the depth cues which allow us to per-
ceive depth is needed. Such an understanding can aid
in identifying what might lead to errors in distance
estimations.
The depth cues used to inform the three-
dimensional understanding of the world can be di-
vided into two categories; pictorial and non-pictorial
cues. Pictorial cues are cues that can be obtained
from a motionless image, while non-pictorial cues are
largely from motion in the scene or the human vi-
sual system (Renner et al., 2013). The pictorial cues
include occlusion, relative and familiar size, hori-
zon ratio, shading and texture gradients (Proffitt and
Caudek, 2012).
Non-pictorial cues include binocular disparity,
motion parallax and ocular motor (accomodation and
vergence) (Proffitt and Caudek, 2012). Maruhn et al.
(2019) suggest that visual cues might differ between
physical environments and VR in a multitude of ways,
such as by introducing the vergence-accomodation
conflict, which is a result of presenting different im-
ages to each eye using stereoscopic displays.
This phenomenon can be a source of visual dis-
comfort and dizziness.
When discussing distance perception of the world,
one should also consider the circular segmentation of
egocentric distances around a moving observer as pre-
sented by Cutting and Vishton (1995). The segments
and their associated depth cues are shown in Figure
2. The first of these segments is referred to as Per-
sonal Space, and is the area closest to an individual
Figure 2: The interplay between segmentation of egocentric
distances and most important visual cues.
(within arm’s reach) delimited by Cutting and Vish-
ton (1995) to 2 meters. The second segment is called
Action Space which extends from the bounds of the
personal space out to about 30 meters - one can move
relatively quickly, speak, teach and toss objects with
relative ease in this segment. The final segment is
called the Vista Space which extends beyond 30 me-
ters, at these distances the benefits of binocular vi-
sion and movement of the observer significantly di-
minishes. (Cutting and Vishton, 1995)
3 ROOM SIZES IN VIRTUAL
REALITY
When acting in an environment, the size and layout of
it profoundly impacts ones perceived personal, action,
and vista spaces, as distances to objects and walls
might limit the area one can interact in and the avail-
able depth cues. To our knowledge, no prior research
has been done with a particular focus on the effect of
room sizes on spatial perception. Nevertheless, the
sizes of Virtual Environments (VEs) used in Virtual
Reality (VR) research can be incorporated to inform
the design of our VEs.
Sizes of rooms used in such studies vary from just
13.46m
2
in a study by Zhao et al. (2019) all the way to
233.26m
2
(21.44m x 10.88m) in a study by Moscoso
et al. (2021).
CHIRA 2022 - 6th International Conference on Computer-Human Interaction Research and Applications
98

While Moscoso et al. (2021) only used two differ-
ent rooms in their studies, Simpson et al. (2018) incor-
porated 7 square rooms with the sizes 16m
2
, 18.75m
2
,
21.34m
2
, 25m
2
, 28.40m
2
, 32.14m
2
, 36m
2
, and uni-
form heights of 2.74m to study the impact of visual
design elements on perception of spaces.
Zhao et al. (2019) used 4 square rooms of sizes
16m
2
, 21.80m
2
, 28.40m
2
, and 36m
2
to the influence
of what is seen through windows of a room on per-
ceived spaciousness of rooms. Zhao et al. (2019) also
presented a room of 13.46m
2
size as a reference to
spaciousness of 1, and a room of size 40.06m
2
as a
reference for spaciousness 10.
3.1 Categorization of Room Sizes
Based on the rooms used by Simpson et al. (2018),
and Zhao et al. (2019), a survey was designed and
distributed to 45 people. The survey consisted of
10 rectangular floor plans (9m
2
, 19m
2
, 29m
2
, 39m
2
,
49m
2
, 59m
2
, 63m
2
, 75m
2
, 86m
2
, and 97m
2
), which
were presented to participants in random order. Par-
ticipants were asked to rate whether they found each
room to be small, medium or large.
The weighted average of the results were com-
puted for each group; the boundary between small and
medium was ∼25m
2
and between medium and large
was ∼52m
2
.
From these results the intervals were defined as: 0-
25 m
2
for small, 25-50 m
2
for medium, and above 50
m
2
for large. This categorization was used to inform
the sizes of rooms used in the Room Size Experiment
presented in Section 6.
4 METHODS FOR QUANTIFYING
PERCEIVED DISTANCES
To investigate and compare perceived distances in a
set of virtual environments, one must be able to quan-
tify them. Two of the most prominent methods for
quantifying perceived distances are:
• Verbal Assessment: (Loyola (2018), Peer and
Ponto (2017), Armbr
¨
uster et al. (2008), Gagnon
et al. (2020), von Castell et al. (2018), Kelly et al.
(2017), Klein et al. (2009))
• Blind Walking: (Interrante et al. (2006), Kelly
et al. (2018), Li et al. (2015), Kelly et al. (2017),
Ahmed et al. (2010))
It was decided to evaluate Verbal Assessment, Blind
Walking, and Walk and Assess (a method where par-
ticipants walk a distance of their choice from a start-
ing point, and then estimate it verbally, devised by
us) with participants to identify the method that per-
formed most similarly between real life and VR with
the highest accuracy. The experiment was conducted
on 30 participants with perfect 20/20 or corrected vi-
sion, who would estimate three distinct distances for
each chosen method. Verbal Assessment resulted in
22% average error in VR and 13% in the Real World
(RW), Walk and Assess showed 25% average error in
VR and 18% in RW, and Blind Walking showed 12%
average error in both VR and RW. Due to the fact that
Blind Walking performed most similarly between VR
and RW, and resulted in the least average error in both
VR and RW, we chose this method to be used in the
succeeding experiment.
5 BLIND WALKING BASELINE
EXPERIMENT
To establish what difference might exist in estimates
between the Real World (RW) and Virtual Reality
(VR) when using Blind Walking, an experiment to
evaluate the method was designed. The purpose was
the establishment of a baseline difference between
VR and RW, as well as it being a pilot test of the
method for the final investigation of room sizes effect
on spatial perception in VR.
5.1 Participants
40 participants were recruited with normal (20/20) or
corrected vision. All participants were university stu-
dents recruited by convenience, and had an average
Interpupilary Distance (IPD) of 65mm.
5.2 Apparatus
A Quest 2 Head Mounted Display (HMD) was used,
untethered to allow free movement, connected to a
laptop with Oculus Airlink. The laptop had a Nvidia
Rtx 3060 graphics card and ran Windows 11.
In order to minimise the blurriness that partici-
pants might experience from an uncalibrated HMD,
each participant’s Interpupillary Distance (IPD) set-
tings were measured and adjusted to one of the three
physical settings on the Quest 2 (58mm, 63mm, and
68mm).
The Field of View (FOV) of the Quest 2 was also
measured, and found to be 94°(IPD 58mm), 93°(IPD
63mm) and 95°(IPD 68mm) vertically, with the hori-
zontal FOVs being 93°(IPD 58mm), 94°(IPD 63mm)
and 86°(IPD 68mm).
Effect of Environment Size on Spatial Perception in Virtual Reality
99
5.3 Procedure
The participants would enter a large empty room
(130m
2
) assigned as a testing area (as shown on Fig-
ure 3) and complete a consent form.
A facilitator (facilitator 2 in Figure 3) shortly
briefed each participant of the procedure of the ex-
periment, and would keep the participants informed
of what would happen next during the experiment. A
Latin square was utilized to counterbalance the order
of the conditions and distances between participants.
In the real world condition participants were first
shown a target point, after which they were asked to
blindly walk to the target point. The participants were
asked to close their eyes and wear a sleeping mask
to prevent them from seeing the target point while
walking. After assessing a distance by walking to the
point, the distance was measured by a facilitator with
a laser range finder, and the participants were asked to
return to their starting position which was marked on
the floor with a cross. The process was repeated until
all distances were assessed.
In the VR condition, participants entered a vir-
tual replica of the empty room and went through the
same process as described above. Instead of a sleep-
ing mask, the screen in the HMD was faded to black
after participants were informed to close their eyes.
The participants’ walk was assessed by the software
instead of a laser range finder. The changing of tar-
gets, fading to black, and noting of measurements was
done by facilitator 1 as seen in Figure 3.
To ensure participants’ safety during their Blind
Walking, facilitator 3 (in Figure 3) would prevent
them from colliding with walls should they have
walked too far.
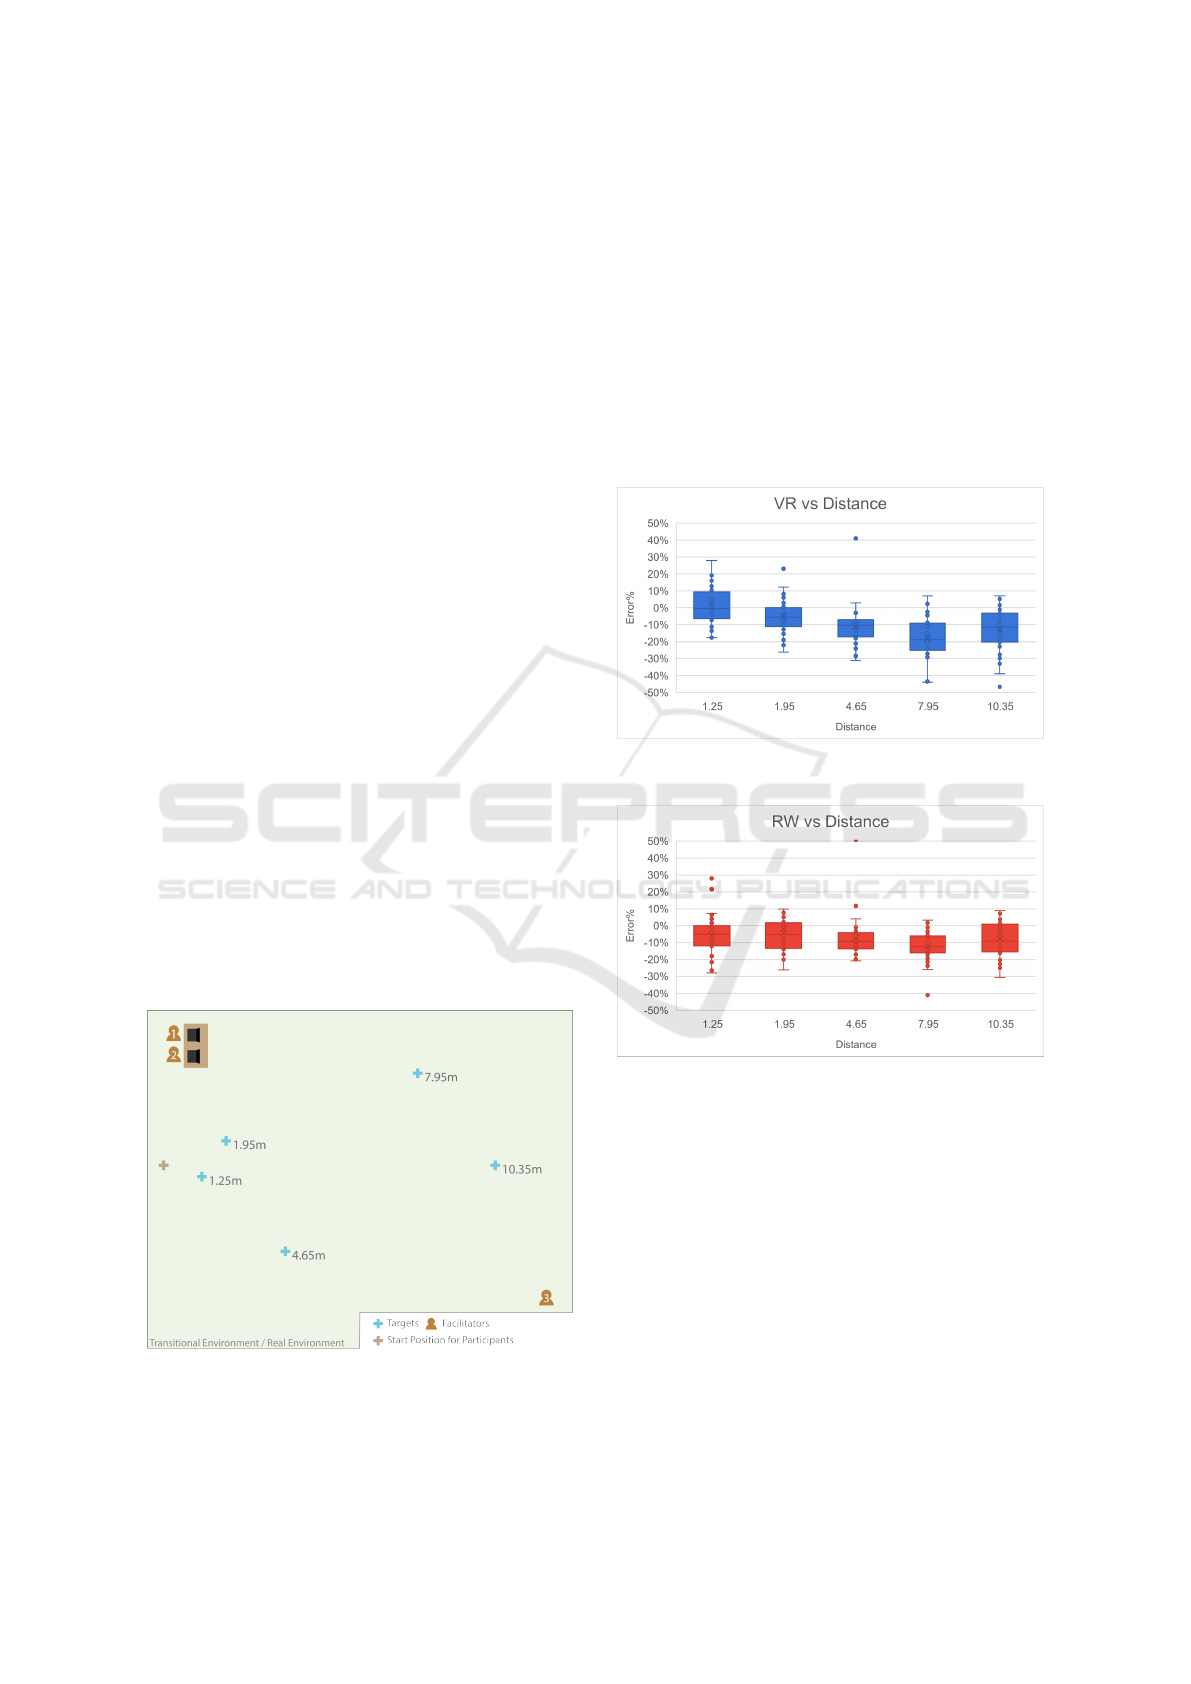
Figure 3: Visualization of the test setup for the Blind Walk-
ing baseline experiment.
5.4 Results
To compare the distance assessments across condi-
tions and distances, the amounts of error in the as-
sessments were expressed in percentage. The abso-
lute values of results were analyzed in the context of
accuracy, defined as ”how much the assessments devi-
ate from the actual distances” (Loyola, 2018), while
the standard deviation of relative values were used to
represent the precision of the assessments, defined as
how similarly participants within a certain group as-
sessed the distances (Loyola, 2018).
Figure 4: Participants’ precision in VR at given distances
reveals a tendency to underestimate as distances gets larger.
Figure 5: Participants’ precision in RW at given distances
shows a similar trend of underestimation as in the VR con-
dition in Figure 4.
The mean relative error for the VR condition was
-9.21%, and the mean relative error for the RW con-
dition was -6.84% - this shows that on average, par-
ticipants underestimated distances in both conditions,
with underestimations being greater by 2.37% in VR
than RW. The standard deviation of the relative errors
in VR was 7.42%, while the standard deviation for the
real world condition was 8.9%. As the VR condition
had a slightly lower standard deviation (1.51% dif-
ference), it shows that the VR condition had slightly
higher precision than in the RW condition. This was
shown to not be a statistically significant difference
(p-value = 0.22 > 0.05).
CHIRA 2022 - 6th International Conference on Computer-Human Interaction Research and Applications
100
Plots showing the relative errors at each distance
for the VR condition can be seen on Figure 4, and the
relative errors at each distance for the RW condition
can be seen on Figure 5. The plots show a clear trend
towards greater degrees of underestimation as the dis-
tance increases, which is both observed in VR and
RW. Also noteworthy is that the underestimation gets
slightly smaller in the final estimate (10.35m) poten-
tially due to it being close to the physical end of the
room used for testing.
The mean absolute error in the VR environment
was found to be 12.26%, and 10.76% in the RW envi-
ronment, suggesting that the estimates in the RW were
more accurate than in VR, and the difference between
the two conditions were found to be statistically sig-
nificant (p-value = 0.04 < 0.05).
This study of Blind Walking as a method, estab-
lishes that the degrees of underestimation between
VR and RW are fairly similar (∼ 2% difference), with
less underestimation in RW than VR. The RW under-
estimation were in line with the prior research pre-
sented in Section 2, while the degree of underestima-
tion in VR was also lower than what was found by
prior research. As the method performed similarly to
prior work in the field, with little difference between
VR and RW, it was chosen to be utilized in the final
experiment regarding the effect of room sizes on spa-
tial perception in VR (described in Section 6).
6 ROOM SIZE EXPERIMENT
As a baseline for the relationship between Virtual Re-
ality (VR) and the Real World (RW) was already es-
tablished in Section 5, the rest of the experiments
were conducted purely in VR.
To investigate the influence of room size on spa-
tial perception three different rooms were designed: a
small room (∼15m
2
), a medium room (∼35m
2
) and a
large room (∼95m
2
). The sizes of the rooms were
based on the research described in Section 3.1 and
were all chosen to have the same 3:5 aspect ratio.
All the rooms give access to the personal and action
spaces, while the vista space is never reached, which
afforded the depth cues presented in Figure 2. The
rooms can be seen side by side in Figure 1.
6.1 Participants
36 participants were recruited with normal (20/20) or
corrected vision. Participants consisted of university
students recruited by convenience. The average IPD
of the participants was measured to be ∼65mm.
6.2 Apparatus
The apparatus used for the Room Size Experiment was
the same as for the Blind Walking Baseline Experi-
ment, as presented in Section 5.2.
6.3 Procedure
The participants would enter the same large empty
room as in the Blind Walking Baseline Experiment
with an area of 130m
2
, where they were informed of
the procedure of the experiment and filled out a con-
sent form.
Participants then entered a transitional environ-
ment in Virtual Reality (VR), which resembled the
large empty room they were present in. After a brief
delay, they would then be transported to the first room
of the experiment (either the small, medium or large
one).
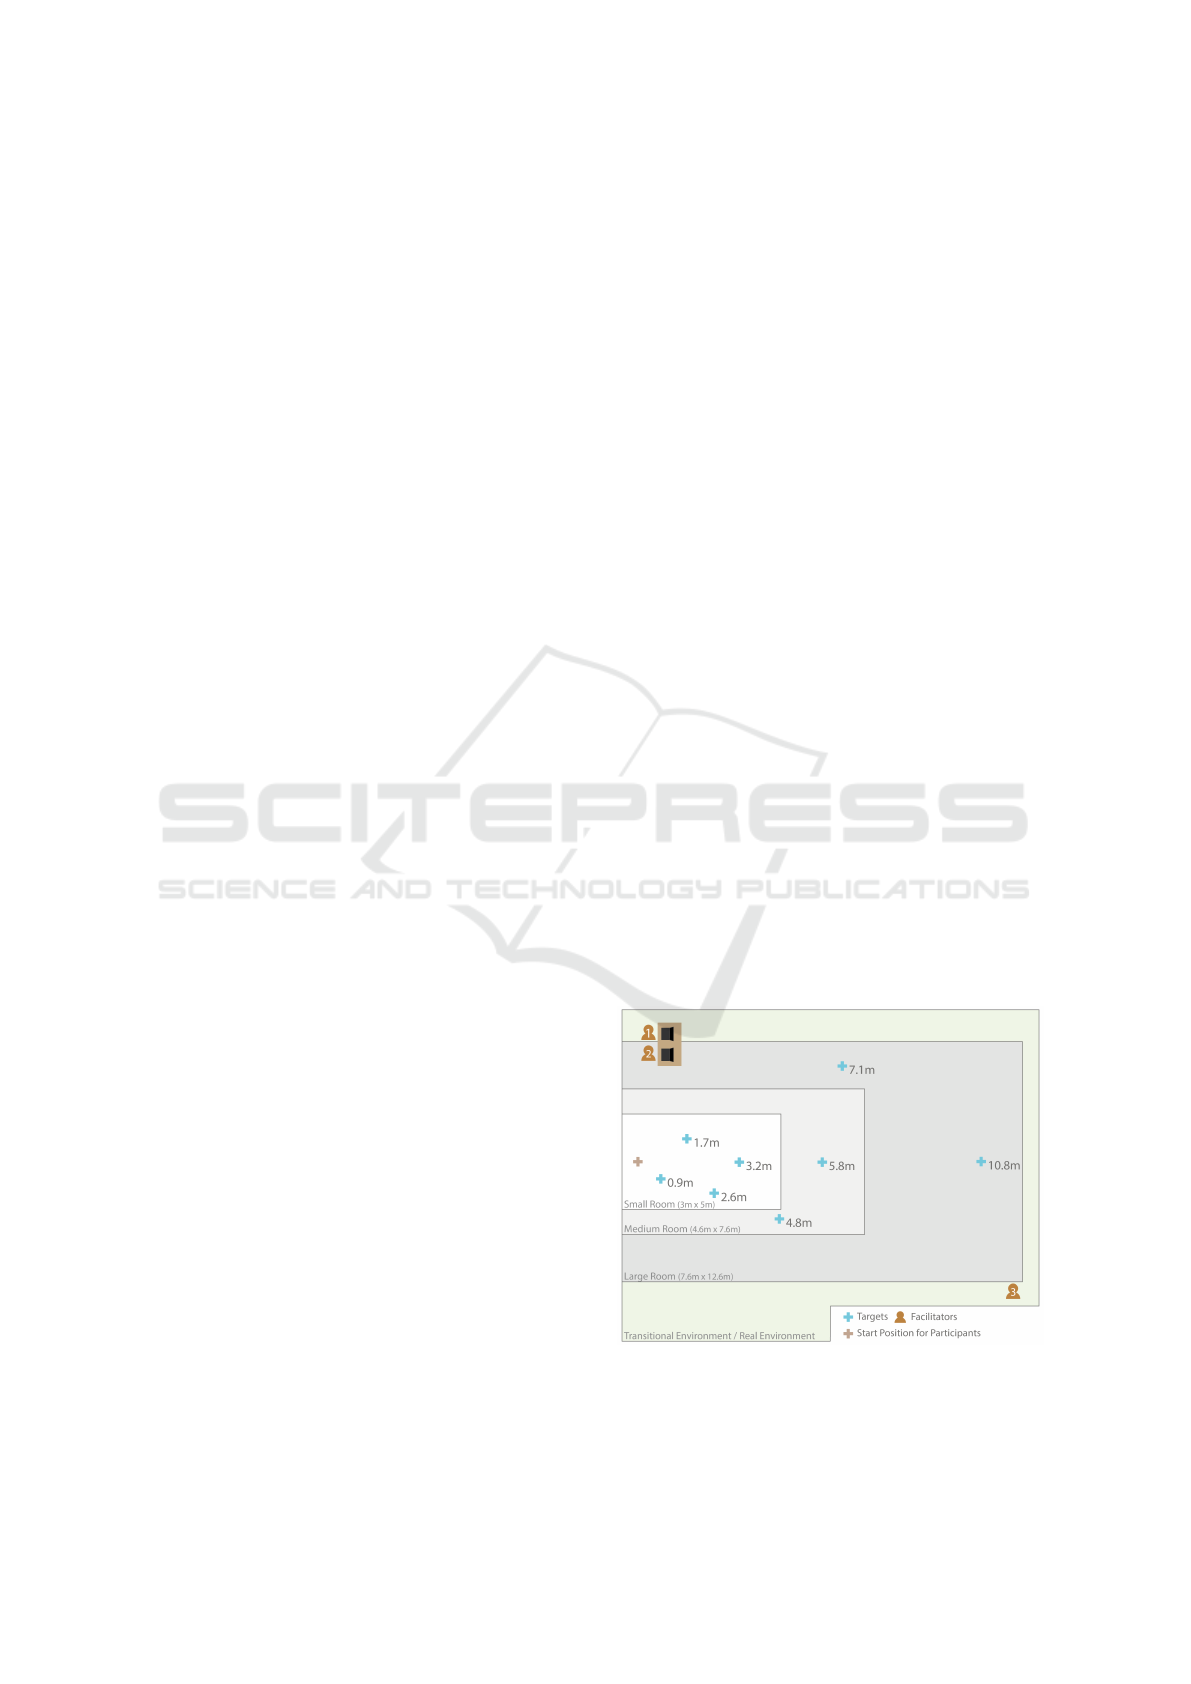
In each of the rooms of the experiment, partici-
pants would be presented with blue crosses on the
ground which served as targets, and once they said
that they felt ready to walk there without vision, they
were asked to close their eyes and the screen would
fade to black. This procedure would be repeated for
4 targets in the small room, 6 targets in the medium
room, and 8 targets in the large room as indicated on
Figure 6.
All targets and rooms were presented in random
orders (based on a Latin square) for each participant,
and since the targets 0.9m, 1.7m, 2.6m and 3.2m were
presented to participants in both the small, medium
and large rooms they would serve as the basis of later
comparisons. We refer to these distances as the uni-
versal distances.
Figure 6: Visualization of the transitional environment
setup with the three overlapping rooms and distances.
Effect of Environment Size on Spatial Perception in Virtual Reality
101
6.4 Results
The mean relative error for the universal distances
was found to be -4% in the small room, -5% in the
medium room, and -6% in the large room. This shows
a consistent tendency towards underestimation of dis-
tances, regardless of the room size, which seems to
grow slightly larger as the room size does. The rel-
ative error for universal distances was found to be
normally distributed, and no statistically significant
difference was found between the small and medium
rooms (p = 0.49 > 0.05), however, a statistically sig-
nificant difference was found between the small and
large room (p = 0.03 < 0.05). A statistically signifi-
cant difference was also found between the error es-
timates for the medium (8%) and large room (9%) (p
= 0.04 < 0.05) when comparing all overlapping dis-
tances (universal distances, 4.8m and 5.8m).
The standard deviation for the universal distances
was found to be 12% for the small room, 13% for
the medium room and 11% for the large room. This
indicates that the precision is not linearly influenced
by the room size.
The relative error estimates for each distance in
each room size are presented in Table 1. The ta-
ble shows a general trend towards greater degrees of
underestimation as the distance increases. It is also
worth noting that the first distance, 0.9 meters, was
consistently overestimated regardless of room size.
A statistically significant difference was found be-
tween all distance estimates of consecutive distances
(p < 0.05), except for between 2.6m and 3.2m in
the small room, 1.7m and 2.6m in the medium room,
and 3.2m and 4.8m in the large room. In most cases
the statistical significance shows growing underesti-
mation, with the exception of the cases 3.2m to 4.8m
in the medium room, and 5.8m and 7.1m in the large
room.
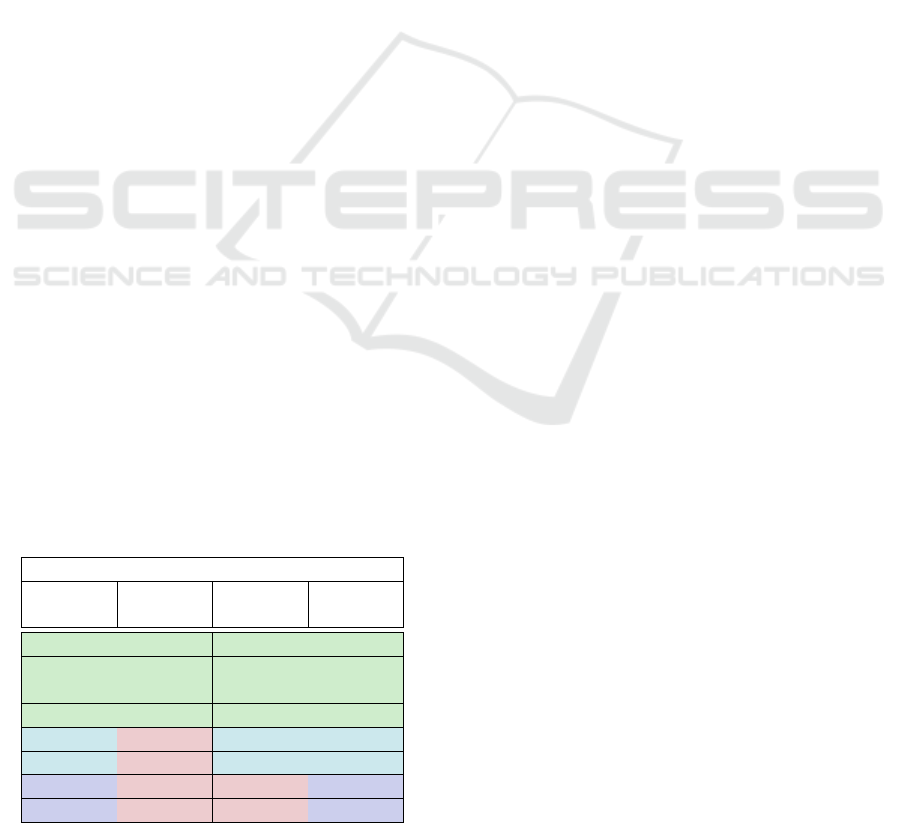
Table 1: Relative error of each distance and room size in
percentage. Universal distances are highlighted in green.
Light blue shows overlapping distances between medium
and large, and light purple are only for the large room.
Average Error in Estimates
Distance
(meters)
Small
Room
Medium
Room
Large
Room
0.9 +4% +3% +3%
1.7 -4% -4% -6%
2.6 -7% -7% -11%
3.2 -11% -12% -11%
4.8 -10% -11%
5.8 -16% -20%
7.1 -14%
10.8 -19%
The mean absolute error, representing the accu-
racy, was found to be 10% for the small room, 11%
for the medium room, and 11% for the large room.
The small room showed the lowest absolute error, but
no statistically significant difference was found be-
tween any of the room sizes (small-large [p = 0.21
> 0.05], small-medium [p = 0.58 > 0.05], medium-
large [p = 0.31 > 0.05]). The absolute error data was
found to be non-normally distributed.
7 DISCUSSION
The mean relative errors for the universal distances
were found to be -4% in the small room, -5% in the
medium room, and -6% in the large room. The large
room was found to have statistically significantly dif-
ferent estimates from the small and medium rooms.
However, this was not the case between the small and
medium rooms. This observation indicates that room
size affects participants’ ability to perceive distances,
with a tendency of larger rooms causing greater un-
derestimations.
The small and medium rooms showed no statisti-
cally significant differences in participants’ error de-
gree, which suggests that the difference in size be-
tween the small and medium room has to be bigger
for the effect to have a statistically significant influ-
ence on the results.
The results of the experiments also show a ten-
dency of longer distances being underestimated more
than shorter distances. This is shown by most con-
secutive distance estimates being statistically signifi-
cantly different from each other, while also maintain-
ing a trend of increasing underestimation.
In the Blind Walking Baseline Experiment as a
method for quantifying perceived distances, the av-
erage error was roughly -9% for Virtual Reality (VR)
and roughly -7% for Real World (RW). These degrees
of underestimation are largely consistent with previ-
ous studies investigating spatial perception in VR, us-
ing Blind Walking as a method. Ahmed et al. (2010)
found underestimations to be 10% and Witmer and
Sadowski Jr. (1998) reported 15% underestimation in
VR. The 7% underestimation found for the RW con-
dition is also in line with previous research, especially
insofar as being lower than the VR underestimations.
Loyola (2018) found 10% underestimation, Witmer
and Sadowski Jr. (1998) found 8% underestimation in
RW.
Based on the results from the Blind Walking Base-
line Experiment, it can also be theorized that the pres-
ence of a physical wall close to the furthest distance
affected the estimations. As can be seen in Figures 4
CHIRA 2022 - 6th International Conference on Computer-Human Interaction Research and Applications
102

and 5, in both conditions the accuracy decreased the
longer the distance - until 10.35, which was the dis-
tance closest to the wall. A reason for this might have
been some participants putting out their hands in front
of them to try to feel the wall, which was a flaw of the
experiment.
Similarly, in the Room Size Experiment we ob-
served that estimation points close to the side walls
had less underestimation, with 4.8m being the closest
to a wall in the medium room and 7.1m in the large
room as seen in Figure 6 than the furthest point, and
the point before them. This was not seen in the small
room, likely because the points were similarly spaced
from the walls.
A noteworthy deviation from prior research is the
advancement of VR technology in the recent years
allowing the display of images in a higher resolu-
tion and at higher refresh rates. Another difference
is that most previous studies used tethered HMDs for
their experiments, while this study used an untethered
HMD. This might be a reason for the lower degree
of underestimations found in this study, since being
untethered affords more freedom of movement.
7.1 Validity and Reliability Concerns
The implications of this study should be evaluated
with caution due to some threats to the validity and re-
liability of the results. One of them being the fact that
the experiments were carried out on a convenience
sample of university students, opposed to a random
sample. This could affect how adequately they rep-
resent the general population. Nevertheless, as men-
tioned in Section 6.4, the relative error data was nor-
mally distributed. Additionally, since most of the par-
ticipants who took part in the experiments were stu-
dents pursuing technology and design related degrees,
it is also likely that some of them were experienced
with VR. This could affect the results of the exper-
iments, as it could translate into better performance
due to being more used to acting in a virtual space.
Another potential threat affecting the results could
be the sound cues caused by the movement of the fa-
cilitator, who ensured that participant’s would not col-
lide with walls, as it might have affected their spatial
awareness.
Additionally, the distances used in all experiments
were consistent across conditions, with the same
groups of participants testing in all conditions per ex-
periment. This could entail some carryover effects
that could affect the results, such as practice and vi-
sual fatigue. To account for these effects, the exper-
iments were designed with the use of Latin squares,
randomizing the order of distances. To further pre-
vent visual fatigue, the experiments were designed to
take up a short amount of time (on average 10 minutes
per participant).
8 CONCLUSION
The aim of this study was two-fold: to identify a re-
liable method of quantifying perceived distances, as
well as to use the identified method to investigate the
effect of different sizes of Virtual Environments (VEs)
on spatial perception in Virtual Reality (VR).
To investigate the reliability of the methods, they
were compared between VR and the Real World
(RW). Blind Walking was identified as a promising
method, as it resulted in the lowest degree of under-
estimation in both VR (12%) and RW (12%) and it
also performed the most similarly between RW and
VR compared to verbal assessment and walk and as-
sess. The method was further investigated in a large
(130m
2
) empty room to establish a baseline for the
difference between error estimation in VR and RW,
where underestimation of distances were found to be
∼9% in VR and ∼7% in RW.
The effect of different VE sizes on spatial percep-
tion was then investigated using VR and three differ-
ently sized rooms: a small room (15m
2
), a medium
room (35m
2
) and a large room (95m
2
). Underesti-
mations were found to be 4% in the small room, 5%
in the medium room, and 6% in the large room for
the universal distances (distances between 0.9m and
3.2m) in the Room Size Experiment. This indicates
that distances become more underestimated the larger
the area of the VE. It is worth noting that no statis-
tically significant difference in estimates was found
between the small and medium rooms, however, the
large room had a statistically significantly greater de-
gree of underestimation than the small and medium
rooms.
In general, the underestimations from the Blind
Walking Baseline Experiment and Room Size Experi-
ment are in line with previous literature as presented
in Section 2. Additionally a tendency for underesti-
mation to grow with the distance was found.
More importantly, the Room Size Experiment indi-
cated that room size could influence spatial perception
in VR, however, more research is needed to validate
this and find the exact threshold where room size be-
gins to have a clear effect.
In conclusion, this study contributes to a better un-
derstanding of spatial perception in VR, how it is af-
fected by the size of the environment, as well as the
performance of Blind Walking as a method of quanti-
fying perceived distances.
Effect of Environment Size on Spatial Perception in Virtual Reality
103

REFERENCES
Ahmed, F., Cohen, J. D., Binder, K. S., and Fennema, C. L.
(2010). Influence of tactile feedback and presence
on egocentric distance perception in virtual environ-
ments. In 2010 IEEE Virtual Reality Conference (VR),
pages 195–202. IEEE.
Armbr
¨
uster, C., Wolter, M., Kuhlen, T., Spijkers, W., and
Fimm, B. (2008). Depth perception in virtual reality:
Distance estimations in peri- and extrapersonal space.
CyberPsychology & Behavior, 11(1):9–15. PMID:
18275307.
Cutting, J. E. and Vishton, P. M. (1995). Chapter 3 - perceiv-
ing layout and knowing distances: The integration,
relative potency, and contextual use of different infor-
mation about depth*. In Epstein, W. and Rogers, S.,
editors, Perception of Space and Motion, Handbook of
Perception and Cognition, pages 69–117. Academic
Press, San Diego.
Gagnon, H. C., Buck, L., Smith, T. N., Narasimham,
G., Stefanucci, J., Creem-Regehr, S. H., and Boden-
heimer, B. (2020). Far distance estimation in mixed
reality. In ACM Symposium on Applied Perception
2020, SAP ’20, New York, NY, USA. Association for
Computing Machinery.
Interrante, V., Ries, B., and Anderson, L. (2006). Distance
perception in immersive virtual environments, revis-
ited. In Proceedings of the IEEE Conference on Vir-
tual Reality, VR ’06, page 3–10, USA. IEEE Com-
puter Society.
Kelly, J. W., Cherep, L. A., Klesel, B., Siegel, Z. D., and
George, S. (2018). Comparison of two methods for
improving distance perception in virtual reality. ACM
Trans. Appl. Percept., 15(2).
Kelly, J. W., Cherep, L. A., and Siegel, Z. D. (2017). Per-
ceived space in the htc vive. ACM Trans. Appl. Per-
cept., 15(1).
Klein, E., Swan, J. E., Schmidt, G. S., Livingston, M. A.,
and Staadt, O. G. (2009). Measurement protocols for
medium-field distance perception in large-screen im-
mersive displays. In 2009 IEEE Virtual Reality Con-
ference, pages 107–113.
Li, B., Zhang, R., Nordman, A., and Kuhl, S. A. (2015).
The effects of minification and display field of view
on distance judgments in real and hmd-based environ-
ments. In Proceedings of the ACM SIGGRAPH Sym-
posium on Applied Perception, SAP ’15, page 55–58,
New York, NY, USA. Association for Computing Ma-
chinery.
Loyola, M. (2018). The influence of the availability of vi-
sual cues on the accurate perception of spatial dimen-
sions in architectural virtual environments. Virtual Re-
ality, 22:235–243.
Lucaci, A., Bach, M., Jensen, P., and Madsen, C. (2022).
Influence of texture fidelity on spatial perception in
virtual reality. Proceedings of the 17th Interna-
tional Joint Conference on Computer Vision, Imag-
ing and Computer Graphics Theory and Applications
- GRAPP, 17:244–251.
Maruhn, P., Schneider, S., and Bengler, K. (2019). Measur-
ing egocentric distance perception in virtual reality:
Influence of methodologies, locomotion and transla-
tion gains. PLOS ONE, 14(10):1–24.
Messing, R. and Durgin, F. H. (2005). Distance percep-
tion and the visual horizon in head-mounted displays.
ACM Trans. Appl. Percept., 2(3):234–250.
Moscoso, C., Chamilothori, K., Wienold, J., Andersen, M.,
and Matusiak, B. (2021). Window size effects on
subjective impressions of daylit spaces: Indoor stud-
ies at high latitudes using virtual reality. LEUKOS,
17(3):242–264.
Peer, A. and Ponto, K. (2017). Evaluating perceived dis-
tance measures in room-scale spaces using consumer-
grade head mounted displays. In 2017 IEEE Sympo-
sium on 3D User Interfaces (3DUI), pages 83–86.
Proffitt, D. R. and Caudek, C. (2012). Depth perception and
the perception of events. In Handbook of Psychology,
Experimental Psychology, pages 212–235. John Wiley
& Sons, Incorporated.
Renner, R. S., Velichkovsky, B. M., and Helmert, J. R.
(2013). The perception of egocentric distances in vir-
tual environments - a review. ACM Comput. Surv.,
46(2).
Simpson, G., Sinnis-Bourozikas, A., Zhao, M., Aseeri, S.,
and Interrante, V. (2018). A virtual reality investiga-
tion of the impact of wallpaper pattern scale on qual-
itative spaciousness judgments and action-based mea-
sures of room size perception. In Bourdot, P., Cobb,
S., Interrante, V., kato, H., and Stricker, D., editors,
Virtual Reality and Augmented Reality, pages 161–
176, Cham. Springer International Publishing.
Thompson, W. B., Willemsen, P., Gooch, A. A., Creem-
Regehr, S. H., Loomis, J. M., and Beall, A. C. (2004).
Does the quality of the computer graphics matter
when judging distances in visually immersive envi-
ronments.
von Castell, C., Hecht, H., and Oberfeld, D. (2018). Bright
paint makes interior-space surfaces appear farther
away. PLOS ONE, 13(9):1–15.
Witmer, B. G. and Sadowski Jr., B. G. J. (1998). Nonvi-
sually guided locomotion to a previously viewed tar-
get in real and virtual environments. Human Factors,
40(3):478–488.
Zhao, M., Sinnis-Bourozikas, A., and Interrante, V. (2019).
Exploring the use of immersive virtual reality to as-
sess the impact of outdoor views on the perceived size
and spaciousness of architectural interiors. In Bour-
dot, P., Interrante, V., Nedel, L., Magnenat-Thalmann,
N., and Zachmann, G., editors, Virtual Reality and
Augmented Reality, pages 312–319, Cham. Springer
International Publishing.
CHIRA 2022 - 6th International Conference on Computer-Human Interaction Research and Applications
104
