
Research on the Driving Effect of Industrial Structure
Rationalization on the Time Dimension Difference of Regional Total
Water Consumption: Taking Yangtze River Economic Belt as an
Example
Haolin Yang
a
and Ziyang Qin
b
School of Business, Hohai University, Changzhou, Jiangsu, 213022, China
Keywords: Industrial Structure Rationalization, LMDI, Time Dimension, Regional Total Water Consumption, Yangtze
River Economic Belt.
Abstract: The coordination between output structure and factor endowment is an important focus on studying the
resource utilization and decomposition based on the effect of industrial structure. Decompose the effect of
industrial structure that affects the time-dimensional difference of the total amount of regional water
consumption into rationalization effect of industrial structure, advanced effect of employment structure,
industrialization income effect and extraction effect of tertiary industry. Constructing the LMDI
decomposition expansion model of the time-dimensional difference of the total amount of regional water
consumption, and mainly exploring the specific driving path and internal mechanism of the rationalization
of industrial structure. Taking the Yangtze River Economic Belt as an example, it can be concluded
that :(1)Rationalization of Industrial Structure is an important driving force to suppress the increase of water
consumption in Economic Belt from 2000 to 2020.It is suggested that provinces and cities in the Yangtze
River Economic Belt should adhere to the “ water saving priority ” and comprehensively optimize the
allocation of water resources among the three industries.(2)Since 2010, the effect of Rationalization of
Industrial Structure on the rise of the total amount of water consumption has declined year by year. At
present, the Rationalization of Industrial Structure has reached a high level, and it is weak in restraining the
increase of total amount of water consumption. It is suggested that we should improve the knowledge
content and innovation density of the three industries, and find a breakthrough point in comprehensively
improving the industrial quality.
1 INTRODUCTION
12
1.1 Research Background
With the continuous growth of China's economic
aggregate and the continuous expansion of
population scale, the mismatch between water
resource endowment and economic development
demand has become the main factor restricting the
coordinated development of China 's economy,
society and ecology. The relationship between water
resource endowment and output structure needs to
be coordinated as soon as possible. China's 14th
Five-Year Plan for Water-saving Society
1
https://orcid.org/0000-0001-8547-9943
2
https://orcid.org/0000-0002-3815-2427
Construction emphasizes :In the new stage of
development, we should adhere to the " to use
Yellow River water resources as its capacity permits
" and resolutely curb unreasonable water demand ;
to implement major regional strategies such as the
development of the Yangtze River Economic Belt
and the integrated development of the Yangtze River
Delta, promote ecological priority and green
development, and require the implementation of the
most stringent water resources management system
to save water and expand development space. The
key to improving the efficiency of water resources
utilization and the quality of economic development
lies in optimizing the allocation of water resources
among industries and promoting the transformation
of water use from extensive and inefficient to
economical and intensive. The optimal intensive
Yang, H. and Qin, Z.
Research on the Driving Effect of Industrial Structure Rationalization on the Time Dimension Difference of Regional Total Water Consumption: Taking Yangtze River Economic Belt as an
Example.
DOI: 10.5220/0011359600003440
In Proceedings of the International Conference on Big Data Economy and Digital Management (BDEDM 2022), pages 941-946
ISBN: 978-989-758-593-7
Copyright
c
2022 by SCITEPRESS – Science and Technology Publications, Lda. All rights reserved
941

degree of water resources for economic growth
depends on the degree of industrial structure
optimization and upgrading. The rationalization of
industrial structure is closely related to the total
amount of regional water consumption.
Digital economy has become a new driving force
for the optimization and adjustment of industrial
structure. Driven by digitalization, the improvement
of the coupling degree of the structure of factor input
and output is the main manifestation of the
upgrading of industrial structure and the key to
achieving high-quality development of China's
economy. Rationalization of industrial structure
refers to the aggregation quality among industries,
which reflects the degree of effective utilization of
resources and coordination among industries and is a
measure of the coupling degree of the structure of
factor input and output. According to the data of the
National Bureau of Statistics, the ratio of the product
of the output value of the tertiary industry and the
employment population of the secondary industry in
China to the product of the output value of the
secondary industry and the employment population
of the tertiary industry in China decreased from 0.44
in 2000 to 0.10 in 2020, indicating that the coupling
degree of the structure of input and output of China '
s industrial structure factors is increasing. In view of
the operability of the decomposition, the ratio of the
product of China ' s tertiary industry output value
and employment population in the secondary
industry and the product of China' s secondary
industry output value and the tertiary industry
employment population is selected to measure the
rationalization of industrial structure.
1.2 Literature Review
The research on the suitability of resource elements
and industrial structure is an important topic in the
field of resource economics. At present, the research
at home and abroad is mainly based on the following
perspectives: ① Based on elasticity, the suitability
index of water resources and industrial structure is
constructed. Combined with Dagum Gini coefficient
and Kernel density estimation, the temporal and
spatial differences, contribution rate and dynamic
evolution law of suitability change in regional and
sub-regional are revealed (Zhang, 2021). ② Based
on the correlation matching calculation method, the
calculation formula of water deviation coefficient is
constructed. Combined with the structural deviation
coefficient index, the correlation between industrial
structure and water resources consumption structure
is calculated (Gan, 2011). ③According to the time
dimension index decomposition method, the
differences of time dimension of total water
consumption are decomposed into production
intensity effect, effect of industrial structure,
economic scale effect, living intensity effect and
population scale effect by using LMDI-I-Model1
(Ang, 2015), and the effect of industrial structure is
an important factor to suppress the increase of total
water consumption (Zhang, 2019, Zhang, 2020, Nan,
2010).
At present, China ' s economic development
presents the form of industrial structure upgrading.
The existing research results mainly focus on the
driving effect of industrial structure upgrading on
the spatial and temporal differences of regional
water consumption. In view of the transformation of
China 's economy from pursuing rapid growth to
pursuing high-quality development, the impact of
industrial structure on resource utilization should not
only study the upgrading of industrial structure, but
also improve the research on the rationalization of
industrial structure. Facing the new requirements of
China's water-saving society construction planning
in the 14th Five-Year Plan, the effect of industrial
structure is divided into the water-saving technology
effect, the extraction effect of tertiary industry, the
rationalization of the effect of industrial structure,
the employment structure upgrading effect, the
industrialization income effect and the scale effect of
urban population. The specific path and internal
mechanism of the rationalization effect of the
industrial structure on the spatial-temporal
difference of the total water consumption are mainly
explored, and the Yangtze River urban
agglomeration is taken as an example for analysis
(Yao, 2019, Ma, 2014).
2 RESEARCH METHODS
Based on LMDI-I-Model1, considering the various
driving factors that affect the difference of time
dimension of regional total amount of water
consumption, decomposing the industrial structure
effect, constructing the LMDI decomposition
expansion model of time dimension difference of
total water consumption. We mainly calculate the
annual and cumulative contribution of TL, and the
differences within the industry. The variation of total
water consumption from period
1t −
to period
t
can
be decomposed into:
BDEDM 2022 - The International Conference on Big Data Economy and Digital Management
942

1, 1
1, 1, 1, 1, 1, 1,
1 11111
ln()ln()ln()ln()ln()ln()
tt t t
tot
tt tt tt tt tt tt
ISITLTIP
tttttt
ii iiii
t ttttt
ii iiii
WWW
WWWWWW
I
ES SI TL TI P
IESSITLTIP
ωω ωωωω
−−
−−−−−−
− −−−−−
Δ=−
=Δ +Δ +Δ +Δ +Δ +Δ
=+ ++++
ES
(1)
Weight :
-1 -1 -1
-1
-1
( - ) / (ln - ln ),
,
(,
)
tt t t t t
ii i i i i
tt
ii i
ttt
iii
WW W W W W
wW W
WWW
=
=
≠
(2)
t
i
W
and
1t
i
W
−
are total i industrial water
consumption for
1t −
and
t
periods, respectively;
t
I
represents the ratio of total regional water
consumption to GDP in
t
period,
1,tt
I
W
−
Δ
represents
water-saving technology effect;
t
TI
represents the
ratio of regional GDP and tertiary industry added
value in
t
period.,
1,tt
TI
W
−
Δ
represents tertiary
industry extraction effect;
t
i
SI
represents ratio of
regional secondary industry added value to urban
resident population in
t
period,
1,tt
SI
W
−
Δ
represents
industrialization income effect;
t
TL
G
represents the
ratio of the product of the tertiary industry added
value and the second industry employment
personnel and the product of the secondary industry
added value and the tertiary industry employment
personnel in
t
period,
1,tt
TL
W
−
Δ
represents
rationalization of industrial structure effect ;
t
P
represents the number of urban resident population
in
t
period,
1,tt
P
W
−
Δ
represents scale effect of urban
population.
t
ES
represents the ratio of the
employment population of the tertiary industry to
that of the secondary industry in
t
period,
1,tt
ES
W
−
Δ
represents employment structure upgrading effect.
3 EMPIRICAL ANALYSIS
3.1 Data Declaration
The ' 14th Five-Year ' water-saving social
construction plan clearly requires that the city should
be determined by water, the land by water, the
people by water, the production by water, and the
population, city and industrial development also
should be rationally planned. The dual control of
total water consumption and intensity is
implemented to promote the transformation of water
use from extensive and inefficient to economical and
intensive. Urban agglomeration is an important
functional area that supports and leads regional
integration and high-quality economic development.
Its high-quality development is closely related to the
efficient utilization of water resources and the
optimization and upgrading of industrial structure.
The Yangtze River Delta urban agglomeration is an
important engine to support and lead the high-
quality and integrated development of the Yangtze
River Economic Belt. As a major national strategic
development region, the Yangtze River Economic
Belt covers 11 provinces and cities including
Shanghai, Jiangsu, Zhejiang and Anhui, etc.
Although it covers only 21.4 per cent of the country,
its population and GDP account for more than 40 per
cent of the country. The data of industrial added
value, total water consumption and employment
population of provinces and cities in the Yangtze
River Economic Belt from 2000 to 2020 are derived
from the statistical yearbook of provinces and cities
and the ' China Water Resources Bulletin'. The
industrial added value data are adjusted according to
constant prices in 2000.
3.2 Analysis on Driving Effect of
Temporal Difference of Total
Water Consumption in Yangtze
River Economic Belt
The water-saving technology effect (I), employment
structure upgrading effect (ES), industrial income
effect (SI), rationalization of industrial structure
effect (TL), tertiary industry extraction effect (TI)
and urban population size effect (P) of the total
water consumption change in the economic belt
from 2000 to 2020 are shown in table 1. The sum of
effects in the same year is denoted as TOT.
Research on the Driving Effect of Industrial Structure Rationalization on the Time Dimension Difference of Regional Total Water
Consumption: Taking Yangtze River Economic Belt as an Example
943
Table 1: Decomposition of Total Water Consumption Difference in Yangtze River Economic Belt from 2000 to 2020.
Year interval SG TS WG WT TOT
2000~2001 20.08 5.19 -96.40 -88.73 -159.86
2001~2002 39.59 -27.50 -163.03 -109.52 -260.45
2002~2003 69.96 -85.39 -272.85 -66.17 -354.46
2003~2004 53.05 -71.46 -165.06 74.19 -109.27
2004~2005 35.33 -25.51 -203.26 -47.39 -240.83
2005~2006 44.80 -44.86 -243.89 4.19 -239.76
2006~2007 33.50 -18.45 -264.41 -52.58 -301.94
2007~2008 18.39 -5.04 -217.31 -22.75 -226.71
2008~2009 18.67 -6.60 -203.64 -37.09 -228.66
2009~2010 74.22 -129.44 -183.18 -61.29 -299.69
2010~2011 46.01 -73.85 -230.46 2.58 -255.72
2011~2012 19.10 -20.43 -374.25 101.18 -274.40
2012~2013 6.28 9.34 -152.06 -70.21 -206.65
2013~2014 -0.78 18.86 -175.33 -108.90 -266.14
2014~2015 -22.98 69.69 -119.48 -119.99 -192.75
2015~2016 -23.96 70.49 -153.57 -110.23 -217.27
2016~2017 -13.90 45.09 -173.49 -25.89 -168.19
2017~2018 -18.03 51.93 -135.52 -82.18 -183.80
2018~2019 -6.28 25.00 -162.69 -27.89 -171.87
2019~2020 0.54 -3.04 -110.83 -135.32 -248.65
Integrated value 393.60 -215.98 -3800.71 -983.98 -4607.07
(1)From 2000 to 2020, the cumulative effect of
industrial structure rationalization was -351.757
billion m³.Rationalization of industrial structure
played an important role in restraining the increase of
total water consumption. The cumulative effect of
industrial structure rationalization from 2000 to 2010
was -222.751 billion m³. The rationalization of
industrial structure was not mature enough before
2010, and its ability to curb the rise in total water use
was unstable. After 2010, the rationalization of
industrial structure tended to be stable, and its effect
of restraining the increase in total water consumption
come to the best and had since weakened year by
year( Seen from Figure 1 ).From 2000 to 2020, the
effect of water-saving technology was the first
driving factor to suppress the increase of total water
consumption. The cumulative effect value of water-
saving technology was -460.707 billion m³,
accounting for more than 50 % of all the above
suppressing effects. It can be seen that the
improvement of water saving technology is
particularly important to suppress the increase of
total water consumption. The water-saving priority
strategy should always be put in the first place in the
construction of water-saving society.
(2)As shown in Figure 1, from 2000 to 2020, the
cumulative effects of employment structure
upgrading and industrialization income on the rise of
total water consumption were 13.698 billion m³ and
343.817 billion m³, respectively. The upgrading of
employment structure and the increase of
industrialization income not only reflect the
improvement of the economic development level of
the Yangtze River Economic Belt, but also indicate
the increase of water demand in the Yangtze River
Economic Belt. The industrialization income effect is
the main driving factor leading to the increase of total
amount of water consumption in the Yangtze River
Economic Belt, and the employment structure
upgrading effect is a secondary driving factor. From
2000 to 2020, the cumulative effect of the tertiary
industry extraction was -17.763 billion m³, which
inhibited the total regional water consumption. From
2000 to 2009, the cumulative effect of tertiary
industry extraction was -5.376 billion m³, which
inhibited the increase of regional water consumption.
However, from 2009 to 2012, the extraction effect
value of tertiary industry turned to positive and began
to promote the increase of total water consumption.
From 2012 to 2019, the extraction effect value of
tertiary industry turned negative again and continued
to restrain the increase of total water consumption.
From 2000 to 2020, the cumulative effect of urban
population size was 175.723 billion m³, and the
BDEDM 2022 - The International Conference on Big Data Economy and Digital Management
944
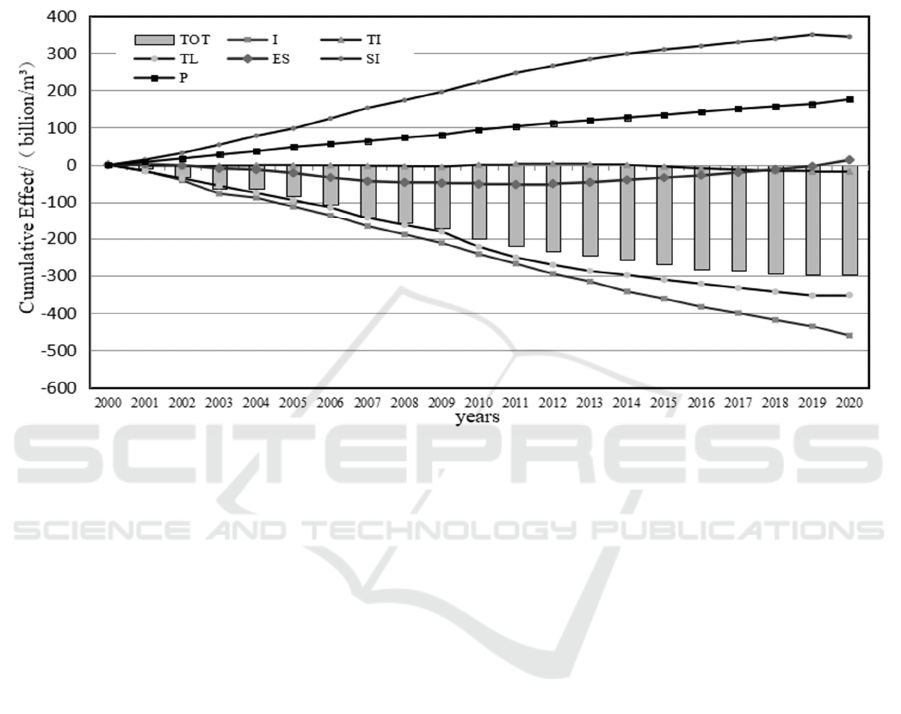
increase of urban resident population was one of the
important driving factors leading to the increase of
total water consumption. In the early stage, the
family planning policy and other factors led to the
decrease of the total population growth rate and the
decrease of the urban population growth rate. With
the improvement of urbanization level and the
opening of comprehensive two-child policy in the
Yangtze River Economic Belt, the growth rate of
urban resident population is increasing, and the total
water consumption is rising as well. Urbanization
level, fertility policy and inter-provincial population
mobility lead to the fluctuation of urban population
size effect.
Figure 1: Cumulative effect of total amount of water consumption changes in the Yangtze River Economic Belt from 2000
to 2018.
(3) As shown in Figure 2, the cumulative
contribution of the three industrial added values to
TL from 2000 to 2020 was -192.141 billion m³, -
112.900 billion m³ and -46.716 billion m³
respectively. From 2000 to 2010, the contribution of
the three industrial added values to TL showed an
overall increasing trend year by year and reached the
maximum in 2010. From 2010 to 2020, the
contribution of three industrial added value to TL
showed a downward trend on the whole and turned to
inhibitory effect in 2020.This shows that the
continuous decrease in the contribution rate of the
added value of the material industry and the
continuous increase in the contribution rate of the
tertiary industry from 2000 to 2020 have led to an
overall upward trend in the AIS value, which has
effectively inhibited the increase in the total water
consumption of the Yangtze River Economic Belt.
After 2010, due to the comprehensive
implementation of strict water resources management
system, industrial water use efficiency has been
greatly improved. Since then, the contribution of the
three industrial added value to TL has decreased year
by year, and it has been insufficient to restrain the
increase of total water consumption only by
improving the coupling degree of industrial structure.
At this time, it is necessary to pay more attention to
the upgrading of industrial structure on the basis of
the rationalization of industrial structure, improve the
proportion of scientific and technological innovation
in the tertiary industry, and inhibit the increase of
total water consumption by improving the quality of
the tertiary industry and the upgrading of industrial
structure.
4 CONCLUSION
(1) The LMDI decomposition expansion model based
on the differences of time dimension of regional
water consumption focuses on the specific ways and
internal driving mechanism of TL to inhibit the
increase of total amount of water consumption,
which is beneficial to draw policy suggestions on the
adaptation between regional water resources and
rationalization of industrial structure. From 2000 to
2020 , the improvement of water saving technology
has
become
the main driving force to restrain the
Research on the Driving Effect of Industrial Structure Rationalization on the Time Dimension Difference of Regional Total Water
Consumption: Taking Yangtze River Economic Belt as an Example
945
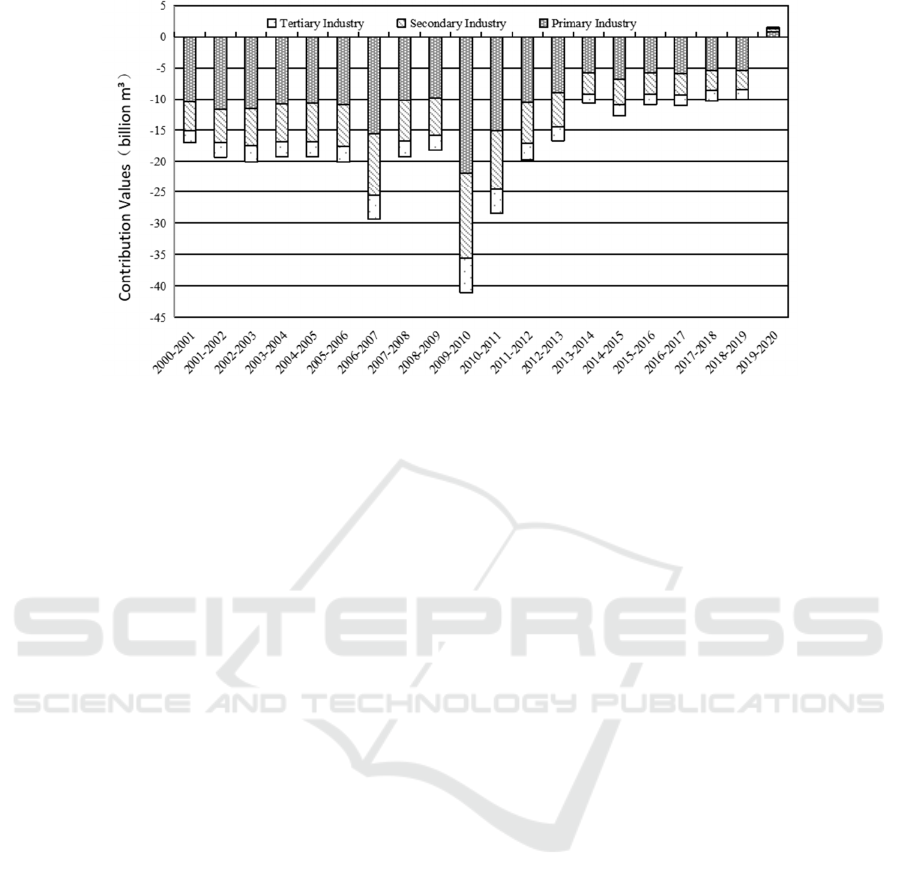
Figure 2: Differences of TL within industry in the Yangtze River Economic Belt from 2000 to 2020.
increase of total water consumption.TL is an
important driving factor to inhibit the increase of
total amount of water consumption and is quite
stable, but its inhibitory effect has weakened year by
year since 2010, and it cannot effectively inhibit the
increase of total water consumption by 2020.It is
worth noting that the tertiary industry extraction
effect also has played a certain role in inhibiting the
increase in total amount of water consumption, but
shows instability. In terms of promoting the increase
of total regional water consumption, the increase of
industrialization income is the main driving factor,
and the improvement of urbanization level is the
secondary factor. At the same time, the upgrading of
employment structure also has a certain role in
promoting the increase of total amount of water
consumption.
(2) After 2010, with the decrease of TL ' s
inhibitory effect on the increase of water
consumption in the Yangtze River Economic Belt,
the contribution rate of the added value of the three
industries to TL has also decreased year by year.
This shows that with the improvement of industrial
structure rationalization, it is more and more
difficult to restrain the increase of total water
consumption only by improving the coupling degree
of input and output of the industrial structure. At this
time, we should improve the scientific and
technological level of the three industries on the
basis of the rationalization of industrial structure,
and comprehensively improve the quality of the
three industries.
REFERENCES
Ang B W., (2015), LMDI Decomposition Approach: A
Guide for Implementation [J]. Energy Policy, 86:233-
238.
Gan, C.H., Zheng, R.G., Yv Dianfan., (2011) The Impact
of Industrial Structure Change on Economic Growth
and Volatility in China [J]. Economic Research, 46
(05): 4-16 + 31.
Ma, H.L., Xu, J., Wang, P.C., (2014), Water Resources
Utilization in the Process of Urbanization in China [J].
Resource Science, (2): 120-127.
Nan, N., Li, Y., Meng, Y. L. (2010), Study on the
relationship between industrial structure and water
consumption in Tangshan [J]. Economic Research
Journal, (20): 45-46.
Yao, L.Q., Xu, J.R., Zhang, L.N., et al. (2019), Temporal-
spatial Decomposition Computing of Regional Water
Intensity for Yangtze River Economic Belt in China
Based on LMDI Model[J]. Sustainable Computing:
Informatics and Systems, 21:119-128.
Zhang, C.J., Wu, Y.S., Pang, Q.H., Shi, C.F., (2019), Study
on the driving effect of spatial and temporal differences
in water consumption in the Yangtze River Economic
Belt - Based on the perspective of production and life
[J]. Resources and Environment in The Yangtze River
Basin, 28 (12): 2806-2816.
Zhang, L.N., Cao, Y.W., Pang, Q.H., Zhang, C.J., Shi,
C.F., (2020), Research on the driving effect of
industrial structure upgrading on the spatial and
temporal differences of regional water use [J]. Soft
Science, 34 ( 07 ) : 1-7.DOI : 10.13956 / j.ss.1001-
8409.2020.07.01.
Zhang, L.N., Xu, J., Pang, Q.H., Wang, T., Zhang, C.J.,
Shi, C.F., (2021), Spatial and temporal differences and
dynamic evolution of adaptation degree between water
resources and industrial structure upgrading [J]. Journal
of Natural Resources, 36 (08): 2113-2124.
BDEDM 2022 - The International Conference on Big Data Economy and Digital Management
946
