
Culture, Economic Preference and Economic
Development with Python: Evidence from Two New Datasets
Linwei Ma
Tianjin University of Commerce, Tianjin, China
Keywords: Culture, Preference, Economic Growth.
Abstract: With the development of society, economy and technology, an increasing number of scholars are attaching
more value to the power of culture. Consequently, this paper uses Python, a computer programming language,
as a research tool for data analysis and examines the relationship between culture and economic outcomes
using two new datasets of cultural features and economic preferences across countries, and based on two
indicators of economic outcomes, income per worker and total factor productivity. In the course of the study,
our independent variable data cultural economic preferences are derived from Geert Hofstede ’ s Six-
dimensional Cultural Index and Global Preferences Survey. In addition, our dependent variables income per
worker and total factor productivity are obtained from the Penn World Table. With a known strong positive
relationship between the cultural preference for individualism and economic outcomes, we initially screen out
the preferences for a positive relationship with individualism by drawing a heat map model using Python.
Then, we verify the conjecture that there is a positive correlation between cultural economic preferences and
economic outcomes by producing scatter plots with the dependent variable added. The final regression model
is made to determine the extent to which the independent and dependent variables are correlated by the
magnitude of the correlation coefficient. Through our research, we find that culture has a significant impact
on economic performance.
1 INTRODUCTION
The question of how culture drives economic growth
has attracted perennial interest in both scholarly
research and popular discussions in the public sphere.
For instance, one of the most influential thinkers in
history on this topic Weber (Weber 1930). attributed
the rise of modern capitalism to protestant ethics, in
particular Calvinist. Some recent empirical work in
economics explores the economic impacts of certain
narrowly defined dimensions of cultural factors, such
as individualism v.s. collectivism Gorodnichenko
and Roland (Gorodnichenko, Roland, 2017), patience
(Chen 2013), and social structure (Granovetter 2005),
etc. The challenge in studying culture and its resulting
economic effects is that it encapsulates an extensive
number of dimensions of social features, not to
mention the difficulty of its measurement due to its
time-varying nature and the substantial variations
across regions, groups, and individuals. According to
Gorodnichenko and Roland (Gorodnichenko,
Roland, 2017), culture is defined in general as the set
of values and beliefs people have about how the
world (both nature and society) works, as well as the
norms of behavior derived from that set of values.
This paper, although similarly, adopts a more specific
definition of the culture. We treat each particular
cultural characteristic as a stable/relatively
commonly shared individual and social preferences
of economic agents making decisions. More
specifically, we use four groups of cultural economic
preferences as independent variables. They are:
Individualism
Patience and Long-term Orientation
Risk Attitude
Social Preferences
Also, I use two economic outcomes, income per
worker and total factor productivity, as measures of
the dependent variables. Based on the existing
economic models we find that the independent
variables have a direct effect on individual economic
behavior and macroeconomic performance. This
paper can be seen as an extension of Gorodnichenko
and Roland (Gorodnichenko, Roland, 2017) in terms
of the cultural variables considered and the data set
utilized. We replicate the positive relationship
854
Ma, L.
Culture, Economic Preference and Economic Development with Python: Evidence from Two New Datasets.
DOI: 10.5220/0011355500003440
In Proceedings of the International Conference on Big Data Economy and Digital Management (BDEDM 2022), pages 854-863
ISBN: 978-989-758-593-7
Copyright
c
2022 by SCITEPRESS – Science and Technology Publications, Lda. All rights reserved

between individualism and economic performance as
measured by GDP per capita that they found in the
paper. Then, the same framework is extended to other
variables.
We utilize two cross-country databases to study
the economic effects of the culture. Both databases
are considered as possibly the best large-sample
measurements of selective culture characteristics by
existing research. The first data set is the same data
set used in Gorodnichenko and Roland
(Gorodnichenko, Roland, 2017), Geert Hofstede's
six-dimensional culture index, (Hofstede 2001). And
the second additional data set is from the Gallop
Global Survey of Economic Preferences (Falk, et al,
2018), which measures different economic
preferences such as patience, risk attitudes, etc. By
using the same economic outcome measures and the
same regression specification as in their paper, this
paper finds that not only the degree of individualism
is positively associated with economic outcomes, but
also other cultural and preference characteristics can
have a profound effect on economic outcomes. In
addition to this, there is a correlation between data on
cultural dimensions and data on preference
characteristics. Thus, the paper has some credibility
in demonstrating the correlation between different
cultural dimensions and preferences and economic
outcomes, and reflects some cross-country
differences.
1.1 Literature Review
This paper is related to three strands of literature. The
first strand of the literature which is the most related
to this paper is research that examines the relationship
between culture, economic preferences and economic
outcomes. Papers by Algan and Cahuc (Algan, Cahuc
2007), Birchenall (Birchenall 2014), Brock and
Brighouse (Brock, Brighouse 2006) as well as Greif
(Greif 1994) explore the impact of these variables on
economic growth from the perspective of
sociocultural preferences such as social attitudes,
social network structures, social interactions, unique
cultures, and relevant social organizations. Hofstede
(Hofstede 2001) argues that corporate culture may
play a crucial role in a company's profitability and
long-term development. Another paper from Lucas Jr
and Moll (Lucas, Moll 2014) shows the way people
with different levels of productivity think, and social
activities may determine the current level of
production in the economy and its actual growth rate.
Historical variables such as literacy and political
system as tools can also explore the causal
relationship between culture and economic
development, a conclusion reflected in the paper by
Tabellini (Tabellini 2010). It is worth noting that
Gorodnichenko and Roland (Gorodnichenko, Roland
2017) discussed the relationship between
individualism-collectivism dimension of culture and
innovation and long-term growth. Doepke and
Zilibotti (Doepke, Zilibotti 2014) discussed the two-
way relationship based on the single relationship
between culture and economy, and provided different
research perspectives. My thesis was improved on the
basis of their research, and added preference features
on the basis of cultural dimension.
The second line of literature broadly explores the
driver of economic growth beyond culture and
preferences. Other important factors discovered in the
literature includes institutions, natural endoment,
religions and so on. The paper by Acemoglu and
Johnson (Johnson 2005) finds that property rights
regimes have first-order effects on long-run economic
growth, investment, and financial development. In
addition to this, Hall and Jones (Hall, Jones, 1999)
find that differences in social infrastructure across
countries lead to large differences in capital
accumulation, educational attainment, and
productivity, and thus make income vary widely
across countries. Perhaps a revolution can also be a
major influence and drive history. For example, the
consumer goods revolution represented in the paper
by Greenwoodetal. (Greenwoodetal 2005) helps
explain the rise in married female labor force
participation that occurred in the last century. In our
research we need to broaden our horizons to
constantly incorporate fresh perspectives because the
factors that influence the economy can be diverse.
Acemogluetal. (Acemogluetal 2002) examined the
relationship between geographic factors and
economic prosperity, and Ashraf and
Galor (Ashraf,
Galor 2012) hypothesized, on the basis of geographic
factors, that prehistoric Homo sapiens migrated out of
Africa to various global settlements. The variation in
migration distance of prehistoric Homo sapiens out of
Africa to various settlements around the globe
influenced genetic diversity and had a persistent hump
effect on economic growth.
The third strand of literature examines the effect of
culture on other specific economic outcomes other
than economic growth, such as innovation. The paper
by Bisin and Verdier (2001) examines the population
dynamics of preference characteristics in a model of
cultural intergenerational transmission. We find that
economists have recently devoted considerable
attention to women. For example, Fernandez and
Fogli (2009) and Tertilt (2005) published enlightening
papers exploring the impact of culture on female
Culture, Economic Preference and Economic Development with Python: Evidence from Two New Datasets
855

fertility. In addition to this, Granovetter (2005)
suggests that social structure and social networks may
influence hiring, prices, productivity and innovation,
and Greenwood and Guner (2010) explore the
inextricable relationship between individuals'
adherence to social norms and morality and
technological progress in the economy, which merits
further study. My paper improves on the study of
Gorodnichenko and Roland (2017) by adding data on
preference characteristics to the cultural dimension,
making it richer.
2 DATA
2.1 Geert Hofstede’s Six-Dimensional
Cultural Index
Some scholars in economics and other fields have
found that culture affects how people make decisions
about things, and thus how society as a whole
functions. If we want to study how people's
preferences affect economic outcomes, we need to
quantify ‘culture’.
Individuals who grow up in different cultures, and
are indoctrinated from an early age, will have very
different preferences for things. Culture itself is
abstract and complex, so it is difficult to measure.
Thankfully, the Dutch social psychologist Geert
Hofstede has made a groundbreaking research on the
culture of modern countries and put forward the
theory of cultural dimension. The concept of
dimensions is not hypothetical, but is derived through
summary induction.
The depth and breadth of research on cultural
dimensions has evolved with the times. Currently,
cultural dimensions have evolved from the initial four
dimensions of values, behaviors, institutions, and
multinational organizations to six dimensions to
measure values. They are:
Power Distance: emphasizes how the fact that
people differ in physical and intellectual
ability is treated in a society. Countries with a
high power distance index may have
inequalities in power and wealth that grow
stronger over time; while countries with a low
power distance index work to reduce these
inequalities.
Individualism versus Collectivism: Emphasis
on the relationship between the individual and
1
An explanation of long-term versus short-term
orientation comes from Charles W.L. Hill's 1993 book
the collective group. In individualistic
societies, relationships between people are
looser, with the goal of individual
achievement; in collectivistic societies,
human ties are stronger, with the goal of
collective success.
Uncertainty Avoidance: refers to the degree to
which culture enables members of society to
accept unclear situations and tolerate
uncertainty.
Masculinity versus Femininity: This
dimension is mainly used in order to
determine whether the society in which one
lives is a masculine or feminist society.
Masculinity mainly includes characteristics
such as competitiveness and assertiveness,
while femininity mainly includes
characteristics such as being more modest and
attentive. Generally speaking, this distinct
gender difference creates a different color
culture. In societies that are more masculine,
gender differences create a greater difference
in jobs; in societies that are more feminist,
there is no significant difference between the
jobs held by men and women.
Long-term Orientation versus Short-term
Orientation: This dimension measures the
degree of acceptance of people in different
cultures for deferred enjoyment of material
and spiritual satisfaction. It measures people's
attitudes toward issues such as time,
inheritance, status hierarchy, face, respect for
tradition, exchange of gifts, and helping each
other. This interpretation comes from Charles
W.L. Hill
1
.
Indulgence versus Restraint: This dimension
is essentially a measure of happiness, whether
simple pleasures are satisfied. The greater the
degree to which society allows for people's
basic needs and desire to enjoy life's pleasures,
the greater the value of their own indulgences
will be, and the less people will discipline
themselves. This is the latest dimension
added.
Geert Hofstede and his team have studied and
collected data on the size of cultural dimensions in
109 countries around the world, covering all seven
continents and major regions of the world. In this
article we use a revised version from 2015 to assist in
the study.
International Business: Competing in the Global
Marketplace.
BDEDM 2022 - The International Conference on Big Data Economy and Digital Management
856

2.2 Global Preferences Survey
The Global Preference Survey collected preference
data from 80,000 people in 76 geographically and
culturally diverse countries around the world. These
countries are on different continents and have
different levels of cultural and economic
development. With an average sample size of 1,000
people per country, these respondents represent 90
percent of the world's population and income, making
these samples more global in perspective. These
countries include 15 countries in the Americas, 25 in
Europe, 22 in Asia Pacific, and 14 in Africa, 11 of
which are sub-Saharan African countries. The
specific preference survey is a measure of
respondents' propensity for ways and actions through
a quantitative item and a qualitative question.
Researchers ask respondents in a choice scenario a
number of questions and self-assess respondents'
preferences on a Likert scale (Likert scale is an 11-
point scale).
This Preference Survey measures and collects
data sets on patience, risk-taking, trust, altruism,
positive reciprocity, and negative reciprocity in
different countries. These preferences influence
individuals' choices in a variety of contexts and also
help us to explore the impact on specific economic
outcomes and the prediction of important economic
behaviors based on cultural dimensions in
combination with preferences. They can also provide
control variables if we want to identify the causal
effects of other factors associated with preferences.
Since global preferences cover the preferences of a
representative sample of each country, they provide a
better indication of country-level averages and
become the best choice for our study. This data set is
divided into a country-level data set and an
individual-level data set. The country level shows the
average behavioral performance of the population of
the whole country with respect to six preferences; the
individual level is the conclusion drawn by the survey
agency interviewing a specific number of people
within a country from different regions, ages,
genders, and even languages. Both can be used for
our in-depth study of macroeconomics and
microeconomics. Here we use country-level data:
Patience/Time Preference: Patience comes
from people's understanding, respect and
tolerance of things, as well as a measure of
opportunity cost. The willingness to give up
what is good for you today in order to gain
more in the future is high.
2
Notes.—Source: The fifth and sixth preference
Risktaking: Willingness to try things that
others are afraid to perform easily and with a
high element of uncertainty.
Positive Reciprocity: The willingness to give
back to others after receiving help from them
is high.
Negative Reciprocity: There is little
willingness to reciprocate after receiving help
from others.
Altruism. Altruism: an act of selflessness, i.e.,
concern for the welfare of others.
Trust. A strong belief in the reliability,
truthfulness, competence, or power of someone or
something.
2
2.3 Penn World Tables
The Penn World Tables abbreviated as PWT is a
database containing information on the relative levels
of income, output, inputs and productivity, covering
183 countries from 1950 to 2019. These datasets
initially had only national economic data to measure
real GDP for different countries and different regions.
after continuous expansion, the economic indicators
were gradually updated to include basic information
on countries and years for data on capital,
productivity, and population. The coverage varies in
terms of countries and periods, economic sectors
included and indicators available. Thus, these
databases can be used to answer different types of
questions about the productivity performance of
countries. Because of the desire to study the
relationship between culture, preferences and
economic variables, we decided to introduce some
data from Penn World Tables as dependent variables,
they are: log income (at purchasing power parity) per
worker and log total factor productivity in 2019,
which are used to represent the income level and
productivity level of workers in different countries. It
is worth mentioning that total factor productivity is
the efficiency of production activities over time and
is considered as an indicator of scientific and
technological progress, and its sources include
technological progress, organizational innovation,
specialization and production innovation.
Here, if we want income per worker data, we need
to set the desired year in the Penn World Tables
dataset: for example, 2019, ISO country code. The
key points to focus on are Expenditure-side real GDP
at chained PPPs (in mil. 2019US dollar), abbreviated
as ‘rgdpe’ and Number of persons engaged (in
millions), abbreviated as ‘emp’. The abbreviation is
definitions come from Wikipedia
Culture, Economic Preference and Economic Development with Python: Evidence from Two New Datasets
857

‘emp’. As we know, we can get the wage per worker
by dividing the real GDP on the expenditure side of
the PPP by the total number of workers. If we need
data for total factor productivity, we need the specific
year (year) in the PWT dataset: 2019, the ISO country
code, and ‘ctfp’,which means total factor produc-
tivity level at current purchasing power parity, in
order to make the variance of the dependent variable
more constant as the independent variable increases,
we choose to multiply the overall data by the
logarithm to obtain Log Income Per Worker and Log
Total Factor Productivity.
3 STYLYZED FACTS
3.1 Correlation between Different
Culture and Preference Measures
After collecting data from both the Geert Hofstede
Six-Dimensional Culture Index data set and the
Gallop Global Preference Survey, we learned that
both use the ISO country code, a set of abbreviations
or symbols used to identify countries, so we com-
bined the two data sets using this feature of the
country code. Obviously, we obtained a data set of
cultural dimension indices and economic preferences
for 73 countries. In addition, we produced a
correlation coefficient matrix and heat map of the two
in Figure 1. That is, the correlation coefficient
between any two variables is used to see if there is an
interesting association between culture and a
particular preference. The closer the value in the heat
map is to 1, the stronger the correlation between the
two; the closer the value is to -1, the stronger the
negative correlation; and the correlation between the
two is close to 0, indicating no research potential. We
can clearly see that these characteristics are
undoubtedly the most relevant to” themselves We
don't need this result, because individualism has been
shown to influence specific economic outcomes in
previous studies, we first focus on the simple
correlations between individualism and other
economic preferences/cultural dimensions. As can be
seen from the figure, individualism has a strong
correlation with patience with a value of 0.65,
followed by trust with a value of 0.21, while other
characteristics also show positive correlations, but
with little significance. The finding between patience
and individualism is very interesting, so in the case of
3
The paper uses scatter plots of individualism, patience,
risk-taking, and trust as representative images of the four
a strong correlation we must pay attention to whether
patience also affects economic outcomes. The highest
positive correlation with patience can be found in the
heat map where the cultural and preference factor is
long-term orientation, with a correlation value of
0.36, followed by indulgence and restraint with a
value of 0.32. When trying to filter cultural
characteristics and preferences that have research
potential by setting the criteria for a positive
correlation with individualism and patience higher
than 0.1, we obtain several values with criteria that
are met. They are:
Trust: its correlations with individualism and
patience were 0.21 and 0.19 respectively.
Long-term orientation: its correlation with
individualism is relatively small at 0.12, but its
correlation with patience is slightly higher
with a value of 0.36;
Indulgence and restraint: its correlations with
both are 0.14 and 0.32;
Negative reciprocity: its correlations are 0.15
and 0.26, respectively;
Risk-taking: its correlation with individualism
is 0.11 and correlation with patience is 0.23.
3.2 Correlation between Cultural
/Preference Measures and
Economic Outcomes
After becoming familiar with some basic correlations,
it is more intuitive to use a scatter plot to represent
the correlation between the independent and
dependent variables. We made a scatter plot
3
between individualism and log income per worker
and log total factor productivity, which can be clearly
seen to be roughly similar to the image in the original
article Gorodnichenko and Roland (2017). Thus, we
can determine that our research is in the right
direction. Next, we need to verify the degree of
correlation of cultural and economic preferences that
may affect economic outcomes.
By plotting the images, we visualize the positive
and negative situation and the degree of correlation
between the independent and dependent variables.
We broadly divided the cultural and economic
preferences into four study sections based on this
criterion. These are (1) individualism and power
distance. (2) patience and longterm orientation versus
short-term orientation. (3) risk-taking attitude. (4)
social preference. In addition to these three
dimensions, we found other characteristics that would
research directions of cultural and economic preferences
BDEDM 2022 - The International Conference on Big Data Economy and Digital Management
858

positively affect economic outcomes. They are trust,
positive reciprocity and negative reciprocity.
Obviously, whether a person is willing to trust others
in economic activities and whether a person is willing
to give back after receiving help from others are
personal preferences in social life. Therefore, we
decided to classify trust, positive reciprocity and
negative reciprocity as social preferences in this
paper.
Individualism and Power distance: The scatter
plot between individualism and income per
worker/total factor productivity indeed shows
that workers have higher income levels and
have higher total factor productivity in
countries with a strong individualistic spirit.
In addition, power distance in the plot
indicates that it can result in strong negative
influences on economic effects.
Patience and Long-term Orientation: By
plotting the patience/long-term orientation
scatter plot, we find that patience and
individualism have a stronger impact on
economic outcomes, while long-term
orientation also unsurprisingly affects
workers' income and has a positive but small
impact on total factor productivity.
Risk Attitude: By plotting a scatter plot of
risk-taking and income per worker/total factor
productivity, we find that more adventurism
leads to lower worker incomes and total factor
productivity, which is contrary to our original
conjecture.
Social Preference: The relationship between
individualism and trust has been discussed in
the literature of Gorodnichenko and Roland
(2017). In addition, they have concluded that
there is a positive but not a strong relationship
between the economic outcome of employees'
income and trust. In the heat map, the
correlation between positive reciprocity and
individualism is -0.081 and the correlation
with patience is 0.016. Although the cor-
relation is not strong, the scatter plot shows
that it strongly affects the income level of
workers, indicating that the higher the trust,
the higher the income level of workers in the
country. In the scatter plot, it shows that trust
positively affects total factor productivity. As
well as both positive and negative reciprocity
positively affects workers’ income and total
factor productivity, the reasons for the effect
are worth further discussion.
4 EMPIRICAL ANALYSIS
We use the original data from our references to
reproduce their findings. Unfortunately, although we
use the data of the culture dimension from Geert
Hofstede's website, after combining it with the PWT
data (i.e., the data set with income per worker/total
factor productivity) and removing the undefined or
unrepresentable values, we only get 72 observations
of income per worker, and we can't get 96
observations from the original data. This is probably
due to the fact that the original paper used Penn
World Tables version 6.3 to obtain income per
worker data for the year 2000, and we used Penn
World Table version 10.0 to obtain income per
worker data for the year 2019, with some changes in
the countries and ways of data collection as the years
progressed. The estimated value of the explanatory
variable parameter in the one-dimensional linear
regression model of individualism and income per
worker built in the original paper is 0.030, and the
correlation coefficient in our replicated regression
results is 0.0158, which approximates 0.016 and also
yields a relatively significant result.
In the original paper, researchers used total factor
productivity data from Hall and Jones (1999), we use
data from Penn World Table version 10.0 on TFP
levels for different countries in 2019 at current
purchasing power parity. Our sample of observations
is also smaller than the original literature with 77
observations, the number is 66. It is difficult to
determine the exact difference between the two data
sets because of the different sources, years and
methods of data collection. In the original article, the
correlation coefficient between individualism and log
total factor productivity from Hall and Jones (1999)
was 0.013, and in our regression results the regression
coefficient was 0.003, again yielding relatively
significant results.
Next, we can start doing the same linear analysis
with the variables we are concerned with. The results
are as follows.
4.1 Regression Framework
LIPWRi= a + βCULi +ϵ
(1)
where LIPWR is the log income per worker of
country i, and CUL represents the particular cultural
variable used as the explanatory variable that varies
across questions.
The regression results are reported in Table 1.
LCTFPi = a + β CULi +ϵ
(2)
where LCTFP is the log total factor productivity of
country i, and CUL represents the particular cultural
Culture, Economic Preference and Economic Development with Python: Evidence from Two New Datasets
859

variable used as the explanatory variable that varies
across questions.
The regression results are reported in Table 2.
4.2 Individualism and Power Distance
Tables 1 and 2 present OLS estimates of the basic
specification, with the dependent variables being log
income per worker and total factor productivity. The
regression coefficient between individualism and
income per worker in the first column is 0.016. The
specific implication is that for every 1-unit increase
in individualism, the log income per worker increase
by 1.6 percent. Since this model is estimated from
crosssectional data, the R2 value is relatively low,
which implies that the fit is also low. In the paper on
Culture, Institutions And National Wealth
Gorodnichenko and Roland (2017), the regression
coefficient of individualism on log income per
worker is 0.030, which is a more significant effect.
The difference in the data may be due to fewer
observations in our data, as well as other influencing
factors. In contrast to the former, the regression
coefficient of individualism on total factor
productivity is 0.003, and the coefficient, although
positive, is insignificant.
In the second column, power distance has a
negative effect on two economic outcomes, income
per worker and total factor productivity. The basic
implication of the regression coefficient is that for
every 1 unit increase in power distance, the log
income per worker decreases by 1.7 percent and total
factor productivity decreases by 0.4 percent. We can
explain this phenomenon by real examples. For
instance, countries with lower power distance have
less hierarchical differences between people, focus on
solidarity and pay more attention to each individual's
ability. Conversely, the greater the power distance,
the more rigid the hierarchy may be, which can have
a negative impact on economic outcomes.
4.3 Patience and Long-Term
Orientation
The correlation coefficient between patience and log
income per worker in the fourth column is 1.401, and
the correlation with total factor productivity is 0.239.
This means that for every 1 unit increase in patience,
log income per worker increase by 140.1 percent,
while at the same time total factor productivity
increases by 23.9 percent. This reflects the fact that
cultural traits may have a significant impact on
economic outcomes, especially qualities like patience
that may increase efficiency and reduce mistakes. But
long-term orientations, which are also excellent at
improving work precision, don't have as large a
positive impact as patience. For each unit increase in
the long-term orientation in the third column, the log
income per worker increases by 1.4 percent. The
effect of long-term orientation on total factor
productivity is 0.
4.4 Risk Attitude
In the sixth column, the coefficient on risk-taking is -
0.428. It indicates that for every 1 unit increase in
risk-taking, the log income per worker decreases by
42.8 percent. In the regression table with total factor
productivity as the dependent variable, the coefficient
on risk-taking is -0.012, indicating that for every 1
unit increase in risk-taking, total factor productivity
decreases by 1.2 percent. Obviously, in countries
with risk-taking spirit, in such a social atmosphere,
there may be an influx of risk-takers, but this also
largely increases the chances of people making
mistakes and bad decisions at work, and the
probability of making bad economic decisions in the
national government sector increases. For example,
the Argentine government made it illegal for the
Central Bank to print money and had to rely on
foreign debt to increase its currency reserves, leading
to the devaluation of the Argentine currency. The
resulting negative impact is directly reflected in the
income level of the population. It also gradually
makes the level of output that can be obtained from
the input factors of production gradually decrease.
4.5 Social Preference
The trust located in the fifth column increases the log
income per worker by 133 percent and total factor
productivity by 23.8 percent for every 1 unit increase.
This means that the regression coefficients between
the independent and dependent variables are 1.330
and 0.238, respectively. The other two social
preferences are positive reciprocity and negative
reciprocity, which are located in the seventh and
eighth columns, respectively. Both of these two
preference independent variables have a significant
effect on log income and total factor productivity per
worker. For each unit increase in positive reciprocity,
log income increases by 50.8 percent, and for each
unit increase in negative reciprocity, log income
increases by 119.1 percent. The effects for total factor
productivity are 13.2 percent and 10.3 percent,
respectively.
BDEDM 2022 - The International Conference on Big Data Economy and Digital Management
860

4.6 Robustness of the Findings
This thesis is the result of an in-depth study based on
some of the results of previous studies, so it is
important to verify the accuracy of the reference
data to ensure the smooth implementation of the
next study. In addition, the regression framework of
this paper is too simple due to the lack of instrumental
and control variables, which also can't guarantee the
accuracy of the study results to be very high. The only
way to clarify the causal relationship in the
experiment is to use control variables to control
variables other than the independent variable that can
cause changes in the dependent variable. After
solving the complex endogeneity problem with
instrumental variables, it is possible to make the
obtained results as close to the real results as possible.
We should control for the different continental
geographic locations, cultural differences caused by
immigration and differences in preferences used in
the papers that are closely followed in this
thesisGorodnichenko and Roland (2017).
We need to control other determinants of
economic growth, including institutions, human
capital, legal sources, ethnic divisions, gender, age,
and so on. Only in this way can the article be more
convincing.
5 CONCLUSIONS
Based on the fact that individualism affects income
and productivity, we found that individualism, power
distance, long-term orientation, patience, trust, and
positive/negative reciprocity all positively or
negatively affect each worker's income and total
factor productivity.
Despite these conclusions, there are some
shortcomings in the article. Introducing more
dependent variables would make the conclusion that
cultural characteristics affect economic outcomes
more convincing. In addition, the paper doesn't
invoke instrumental variables to address the
endogeneity between cultural characteristics and
dependent variables. Because the relationship
between culture and economy is very complex, it is
difficult for us to find exogenous variables that affect
the endogenous variables. We hope that this paper
will lead to a better understanding of the impact of
cultural dimensions and preference characteristics on
the economy and raise the importance of cultural
characteristics when studying economic outcomes.
6 FIGURES AND TABLES
6.1 Heat Map
Figure 1: Correlation between different cultural and
preference measures
Notes. — Source: cultural economic data comes
from Geert Hofstede's Six-dimensional Cultural Index
and Global Preferences Survey. Idv is Hofstede's
index of Individualism. pdi is Hofstede's index of
Power Distance. Ltowvs is Hofstede's index of Long-
term Orientation. posrecip is The Global Preference
Survey's a preference measure of Positive
Reciprocity. negrecip is The Global Preference
Survey's a preference measure of Negative
Reciprocity. Mas is The Global Preference Survey's a
preference measure of Masculinity. uai is The Global
Preference Survey's a preference measure of
Uncertainty Avoidance. Ivr is The Global Preference
Survey's a preference measure of Indulgence vs.
Restraint.
6.2 Scatter Plot
(a) Log Income Per Worker
a. Notes.— Source: cultural economic data comes
from Geert Hofstede's Six-dimensional Cultural
Index and Global Preferences Survey. idv is Hofstede
Culture, Economic Preference and Economic Development with Python: Evidence from Two New Datasets
861
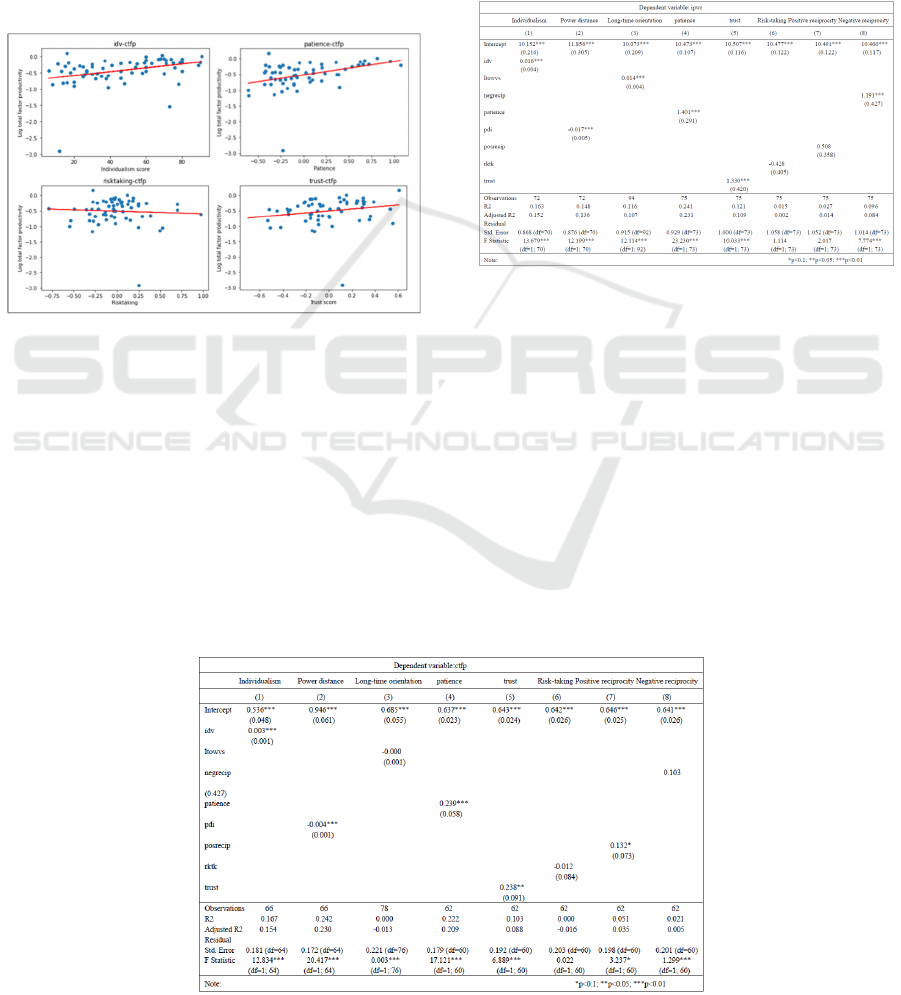
’ s index of Individualism. patience is The Global
Preference Survey ’ s a preference measure of
Patience. trust is The Global Preference Survey’s a
preference measure of Trust. risktaking is The Global
Preference Survey’s a preference measure of Risk-
taking. ipwr is log income per worker in 2019 from
the Penn World Tables. idv-ipwr means the
relationship between Individualism and Income per
Worker. patience-ipwr means the relationship
between Patience and Income per Worker. risktaking-
ipwr means the relationship between Risk-taking and
Income per Worker. trust-ipwr means the relationship
between Trust and Income per Worker.
(b) Log Total Factor Productivity
b. Notes.—Source: cultural economic data comes
from Geert Hofstede's Six-dimensional Cultural Index
and Global Preferences Survey. idv is Hofstede’s
index of Individualism. patience is The Global
Preference Survey’s a preference measure of Patience.
trust is The Global Preference Survey’s a preference
measure of Trust. risktaking is The Global Preference
Survey’s a preference measure of Risk-taking. ctfp is
log total factor productivity in 2019 from the Penn
World Tables. idv-ipwr means the relationship
between Individualism and Income per Worker.
patience-ipwr means the relationship between
Patience and Income per Worker. risktaking-ipwr
means the relationship between Risk-taking and
Income per Worker. trust-ipwr means the relationship
between Trust and Income per Worker.
6.3 Table
Table 1: Cultural/preferential characteristics and log
income per worker.
Notes.—Source: The dependent variable is log
income per worker in 2019 from the Penn World
Tables. idv is Hofstede's index of Individualism. pdi
is Hofstede's index of Power Distance. ltowvs is
Hofstede's index of Long-term Orientation. patience
is a preference measure collected by The Global
Preference Survey. Trust is a preference measure
collected by The Global Preference Survey. rksk is
The Global Preference Survey's a preference measure
of Risk-taking. posrecip is The Global Preference
Survey's a preference measure of Positive
Reciprocity. negrecip is The Global Preference
Survey's a preference measure of Negative
Reciprocity.
Table 2: cultural/preferential characteristics and log total factor productivity
BDEDM 2022 - The International Conference on Big Data Economy and Digital Management
862

b.Notes.—Source: The dependent variable is log
total factor productivity in 2019 from the Penn World
Tables. idv is Hofstede's index of Individualism. pdi
is Hofstede's index of Power Distance. ltowvs is
Hofstede's index of Long-term Orientation. patience
is a preference measure collected by The Global
Preference Survey. Trust is a preference measure
collected by The Global Preference Survey. rksk is
The Global Preference Survey's a preference measure
of Risk-taking. posrecip is The Global Preference
Survey's a preference measure of Positive
Reciprocity. negrecip is The Global Preference
Survey's a preference measure of Negative
Reciprocity.
REFERENCES
Algan, Y. and Cahuc, P. (2007). Social attitudes and
macroeconomic performance: An epidemiological
approach. Technical report, Mimeo, University of Paris
1.
Acemoglu, D. and Johnson, S. (2005). Unbundling
institutions. Journal of political Economy, 113(5):949–
995.
Acemoglu, D., Johnson, S., and Robinson, J. A. (2002).
Reversal of fortune: Geography and institutions in the
making of the modern world income distribution. The
Quarterly journal of economics, 117(4):1231–1294.
Ashraf, Q. and Galor, O. (2012). The “out of africa”
hypothesis, human genetic diversity, and comparative
economic development.
Birchenall, J. A. (2014). Disease and diversity in africa’s
long-term economic development. Technical report,
Technical report, University of California Santa
Barbara.
Brock, G. and Brighouse, H. (2006). The political
philosophy.
Bisin, A. and Verdier, T. (2001). The economics of cultural
transmission and the dynamics of preferences. Journal
of Economic theory, 97(2):298–319.
Chen, M. K. (2013). The effect of language on economic
behavior: Evidence from savings rates, health
behaviors, and retirement assets. American Economic
Review, 103(2):690–731.
Doepke, M. and Zilibotti, F. (2014). Culture,
entrepreneurship, and growth. In Handbook of
economic growth, volume 2, pages 1–48. Elsevier.
Fern´andez, R. and Fogli, A. (2009). Culture: An empirical
investigation of beliefs, work, and fertility. American
economic journal: Macroeconomics, 1(1):146–77.
Falk, A., Becker, A., Dohmen, T., Enke, B., Huffman, D.,
and Sunde, U. (2018). Global evidence on economic
preferences. The Quarterly Journal of Economics,
133(4):1645–1692.
Gorodnichenko, Y. and Roland, G. (2017). Culture,
institutions, and the wealth of nations. Review of
Economics and Statistics, 99(3):402–416.
Granovetter, M. (2005). The impact of social structure on
economic outcomes. Journal of economic perspectives,
19(1):33–50. R. Nicole, “Title of paper with only first
word capitalized,” J. Name Stand. Abbrev., in press.
Greif, A. (1994). Cultural beliefs and the organization of
society: A historical and theoretical reflection on
collectivist and individualist societies. Journal of
political economy, 102(5):912–950.
Greenwood, J., Seshadri, A., and Yorukoglu, M. (2005).
Engines of liberation. The Review of Economic
Studies, 72(1):109–133.
Granovetter, M. (2005). The impact of social structure on
economic outcomes. Journal of economic perspectives,
19(1):33–50.
Greenwood, J. and Guner, N. (2010). Social change: The
sexual revolution. International Economic Review,
51(4):893–923.
Hofstede, G. (2001). Culture’s consequences: Comparing
values, behaviors, institutions and organizations across
nations. Sage publications. M. Young, The Technical
Writer's Handbook. Mill Valley, CA: University
Science, 1989.
Hall, R. E. and Jones, C. I. (1999). Why do some countries
produce so much more output per worker than others?
The quarterly journal of economics, 114(1):83–116.
Hall, R. E. and Jones, C. I. (1999). Why do some countries
produce so much more output per worker than others?
The quarterly journal of economics, 114(1):83–116.
Lucas Jr, R. E. and Moll, B. (2014). Knowledge growth and
the allocation of time. Journal of Political Economy,
122(1): 1–51.
Tabellini, G. (2010). Culture and institutions: economic
development in the regions of europe. Journal of the
European Economic association, 8(4):677–716.
Tertilt, M. (2005). Polygyny, fertility, and savings. Journal
of Political Economy, 113(6):1341–1371.
Culture, Economic Preference and Economic Development with Python: Evidence from Two New Datasets
863
