
Sustainable Development Forecasting of the Agricultural Sector using
Machine Learning
Olena Vasyl’yeva
1a
, Lidiia Horoshkova
2b
, Denis Morozov
1c
and Olena Trokhymets
3d
1
Department of International Tourism and Economics,
National University «Zaporizhzhia Polytechnic», 64 Zhukovskoho Street, Zaporizhzhia, Ukraine
2
Department of Environmental Studies, National University of «Kyiv-Mohyla Academy», Kyiv, Ukraine
3
Department of National Economy, Marketing and International Economic relations,
Classic Private University, 70b Zhukovskoho Street, Zaporizhzhia, Ukraine
Keywords: Agricultural Sector, Labour Potential, Sustainable Development, Labour Productivity, Artificial Neural
Network.
Abstract: Sustainable development paradigm is a combination of economic, social and environmental components
represented by a significant number of interconnected factors. Their comprehensive impact determines the
ways and dynamics of achieving sustainable development goals. Sustainable development forecasting is
accompanied by the analysis and processing of a significant set of indicators and requires special methods of
data processing. The neural network modelling allowed to form a multifactorial impact model on the final
indicator, namely labour productivity, according to the sustainable development goals. The proposed model
allows not only to model and forecast, based on the previously obtained indicators and their dynamics, but
also to set target benchmarks to obtain a range of possible scenarios of system development, which depends
on the forecasting conditions and parameters. They do not only increase the validity of managerial decision-
making, but also ensures relevant adaptation of the management object to the changing environment, affects
not only the final result, but also the process of its achievement, including optimization of sustainable
development levers.
1 INTRODUCTION
The global goal of sustainable development is
harmonization of economic, social and environmental
trends of mankind`s way of life; targeting general
well-being due to the ecologically balanced and
socially-oriented economy. The main goal of
sustainable development is providing food for the
population of Earth, so the most relevant and
developed sectoral level problem is of sustainable
development for the agro-industrial complex.
Permanent growth of agricultural production,
better rural quality of life and environmental
preservation are the determinants of economic growth
of the national agricultural sector and its sustainable
development. Human capital acts as a determining
a
https://orcid.org/0000-0003-2859-3592
b
https://orcid.org/0000-0002-7142-4308
c
https://orcid.org/0000-0001-9446-8736
d
https://orcid.org/0000-0001-7587-7948
lever of the national economic growth in general and
the agrarian sector, in particular, by implementing
labour. It causes lower production costs, higher
productivity and profits, leads to accumulation of
production capital, which ensures sustainable
development of the national economy.
Rapid economic development and quality of life
improvement are achieved in close connection with
sustainable development, but require effective
management of natural and technological resources at
both global, regional, national or local levels. New
challenges and sustainable development indicators
are constantly emerging, which require setting the
priority for each problem`s decision-making. Since
these indicators are characterized by uncertainty,
vague vision of new problems and indicators`
Vasyl’yeva, O., Horoshkova, L., Morozov, D. and Trokhymets, O.
Sustainable Development Forecasting of the Agricultural Sector using Machine Learning.
DOI: 10.5220/0011347100003350
In Proceedings of the 5th International Scientific Congress Society of Ambient Intelligence (ISC SAI 2022) - Sustainable Development and Global Climate Change, pages 187-196
ISBN: 978-989-758-600-2
Copyright
c
2022 by SCITEPRESS – Science and Technology Publications, Lda. All rights reserved
187

interconnection, it is preferable to analyze them using
forecasting models with hidden information, which
cannot be perceived by means of classical analysis
(Al'mukhamedova, 2021).
The paradigm of sustainable development is
based on the combination of economic, social and
environmental components represented by a
significant number of interconnected factors. Its
comprehensive action determines the ways and
dynamics of achieving sustainable development
goals. Managerial decision-making referring to each
impact factor, taking into account their interaction has
to be accompanied by the analysis, and processing of
a significant set of data requiring special methods of
information processing. Solving this problem is
possible using machine learning and parameters`
assessment, which will be considered in the model.
To determine the levers of influence on the target
indices of sustainable development in the agrarian
sector, one of which is labour productivity in
agriculture, it is necessary to evaluate sustainable
development determinants.
The method of artificial neural network can be
used for research. The following stages characterize
the method (Zaporozhchenko et al., 2019):
- search of data;
- preparation and normalization of data;
- choice of type of neuron network;
- experimental choice of network characteristics;
- experimental choice of parameters;
- obtaining an artificial neuron network for
modeling the labour productivity;
- checking of adequacy of the model;
- adjustment of parameters,
- final network training using learning sampling;
- adaptation of a neural network caused by
changes in weight coefficients reflecting network
interconnection and network configuration
adjustment.
2 METHODOLOGY
Among the currently known models and forecasting
methods are (Bizianov, 2021): multiplicative models,
dynamic linear and nonlinear models, threshold
autoregressive models, Kalman filters, time series,
ARMAX models, nonparametric regression models,
artificial neural networks (ANNs), statistical models,
as well as hybrid models, for example, fuzzy artificial
neural networks (NNNs).
Various types of regressions and the models
generated from them, as well as time series, can be
effectively used in cases where the dependence of the
predicted indicator over time is continuous, has a
smooth character and does not contain jumps and
gaps. In the case of forecasting based on non-periodic
data series, in order to obtain an acceptable accuracy
(at least a few percent), one has to take into account a
significant number of terms of the series or regression
coefficients. In addition, when processing non-
periodic signals, both regression and time series give
adequate results only within the interpolation interval.
Artificial neural networks are more flexible than
the above models, due to the presence in them of a
complete relationship between input and intermediate
variables, as well as the possibility of introducing
non-linearity into the activation functions (Khaykin,
2006). This explains their expanding application in
solving computational, statistical, prognostic and
other problems. The disadvantage of “classical”
ANNs is that for their training it is necessary to have
a sufficiently large amount of initial data, which is not
always possible.
Linear methods are traditionally used for
macroeconomic forecasting. One of their
disadvantages is not taking into account hidden linear
relationships between model input parameters.
Forecasting makes it possible to obtain a set of
possible scenarios for system`s development, which
depends on the conditions and parameters of
forecasting. It causes application of a wide range of
methods, one of which is the method of artificial
neural networks.
Artificial neural networks are quite effective when
solving problems of predicting the behavior of
complex systems and the selection of unknown
parameters that link the characteristics of complex
objects, including economic systems (Romanchukov,
2019).
Parameters characterizing economic, social and
environmental impacts have been chosen as
determinants (controlled parameters) affecting
sustainable development in the agrarian sector.
Labour productivity is considered as final indicator,
which is a factor characterizing the efficiency of
labour potential application. Input indicators for
modelling by the method of artificial neural networks
are the following:
Y - labour productivity, UAH per worker;
X
1
- average monthly nominal wage of full-time
workers in agriculture, UAH;
X
2
- energy security (power capacities/sown area),
kW/100 hа;
X
3
- power-weight ratio (power capacities
/number of employees), kw/per capita;
X
4
- number of tractors per 100 hectares of sown
area;
ISC SAI 2022 - V International Scientific Congress SOCIETY OF AMBIENT INTELLIGENCE
188
X
5
- number of tractors per 1,000 employees;
X
6
- mineral fertilizers per 1 hectare of sown area,
kg (nutrients);
X
7
- organic fertilizers for agricultural crops, per
1 hectare of sown area, tons;
X
8
- stationary and mobile sources of air pollution,
per capita, kg;
X
9
- total waste accumulated at landfill sites per
capita, kg;
X
10
- average index of regional human
development;
X
11
- capital investment per capita, UAH.
2.1 Data and Justification
2008-2019s statistical data was used to forecast
sustainable development parameters. Labour
productivity growth in agriculture was considered as
a target value for the resulting indicator according to
the sustainable development goals (relative to 2015)
(Natsional'na dopovid', 2017). An adverse trend
characterizes agriculture in Ukraine: labour
productivity and average monthly nominal wage
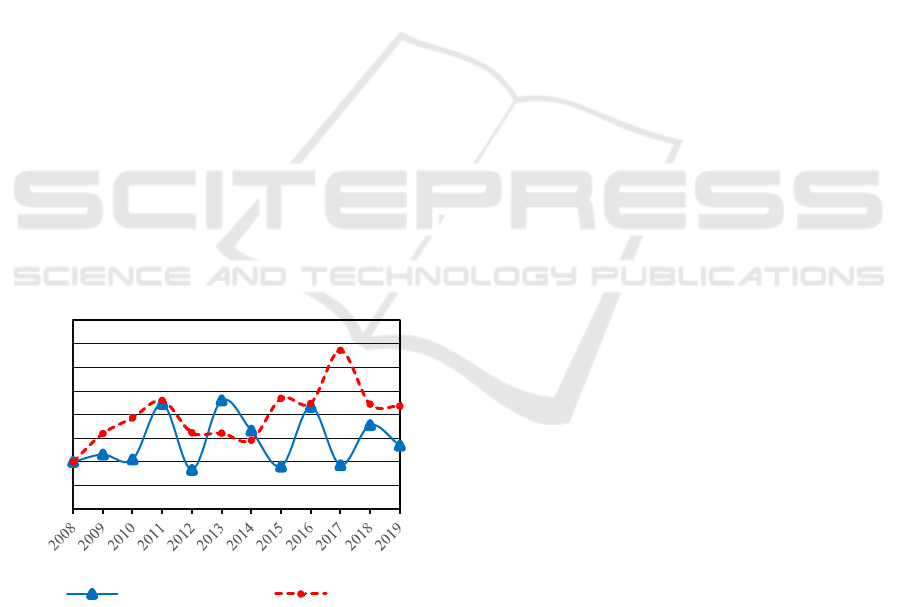
growth show ahead of wage rates (Fig. 1), which, in
our opinion, brakes causal relationship (Vasyl'yeva,
2021): The rate of wage growth surpasses labour
productivity growth rate (2008-2012). During 2013-
2014, there was a positive tendency: labour
productivity growth rate was ahead of wages growth
rate. Wages growth rate has been surpassing the
labour productivity growth rate since 2015.
Figure 1: Chain growth rates of labour productivity and
average monthly nominal wages in agriculture.
Thus, the formation of labour remuneration
mechanisms in agriculture in Ukraine almost does not
depend on the economic results, the employees fall
short of labour remuneration in comparison with their
efforts. Low productivity growth rates, in turn, do not
form the background for higher income and better
quality of life (Vasyl'yeva, 2021). Positive
interdependence of productivity and remuneration
allows us to conclude that it is necessary to include
parameter X
1
(average monthly nominal wages of
full-time workers in agriculture) into the model of
labour potential assessment.
Scientific and technological progress, technical
equipment, and latest technologies require certain
level of personnel`s education and qualification being
the determinants of staff efficiency. These qualitative
characteristics of human resources can be described
both by the integral index of regional human
development (X
10
) and by the production facilities
and technologies applied by personnel when working
(X
2
- X
7
).
Taking into account the influence of air pollution
from stationary and mobile sources (X
8
) and total
waste accumulated at landfill sites (X
9
) on economic
growth fully corresponds to the sustainable
development trend, we consider these parameters
relevant to be included into the model for the
assessment and forecasting of labour potential in the
agrarian sector amid sustainable development.
Labour productivity in the context of new
economy is largely determined by qualitative
characteristics of labour potential: level of formal and
informal education, creativity, and well-being.
Qualitative parameters of labour potential in the
model are described using the average index of
regional human development (X
10
). The index has 33
indicators reduced to 6 subindexes (according to
individual aspects of human development:
reproduction of population; social position;
comfortable life; welfare; worthwhile work;
education) (Rehional'nyy lyuds'kyy rozvytok, 2018).
Besides, the amount of capital investment affects
human development, being directed to the fixed
assets` reproduction, introduction of technical
progress, construction and reconstruction of social
and cultural institutions (X
11
).
Thus, the parameters affecting labour potential in
the agrarian sector amid sustainable development
(characterize economic, social and environmental
impacts) have been substantiated for modelling.
2.2 Forecasting Models
Modelling of sustainable development determinants
in the agricultural sector was carried out using a
sample of 120 values of each indicator. A dynamic
range of selected data represent the model`s input
parameters. The correlation matrix of input
parameters shows that the strongest correlation with
other parameters occurs for X
1
(average monthly
80
90
100
110
120
130
140
150
160
%
year
labour productivity wage
Sustainable Development Forecasting of the Agricultural Sector using Machine Learning
189
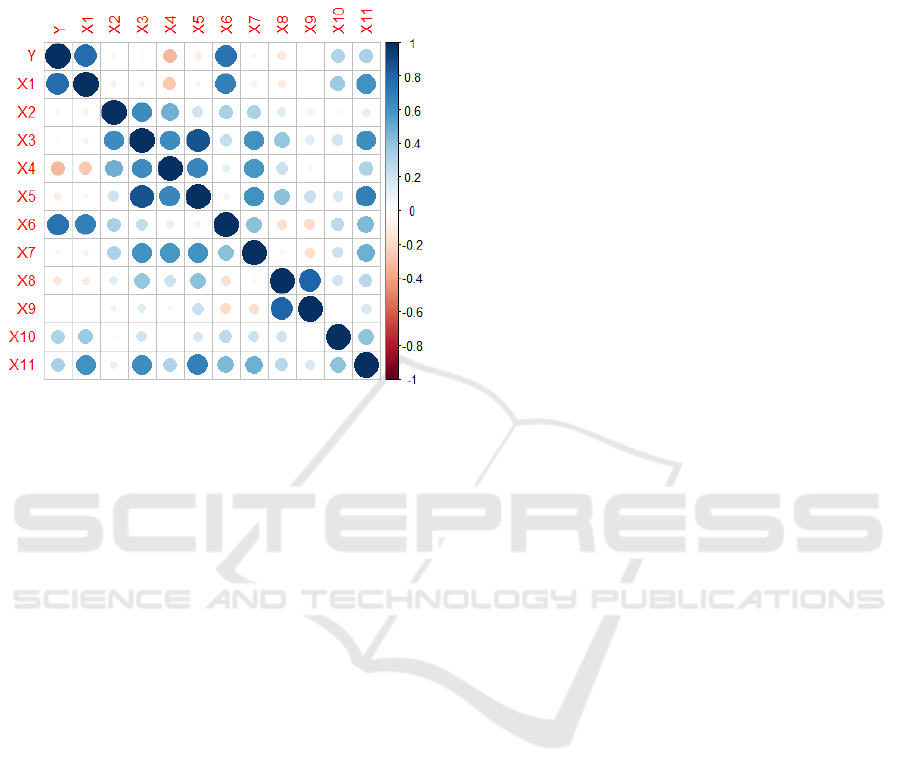
nominal wages of full-time employees in agriculture),
X
3
(power-weight ratio), X
6
(mineral fertilizers), X
10
(average regional human development index), and
X
11
(capital investment) (Fig. 2).
Figure 2: The correlation matrix of input parameters of
sustainable development.
The correlation confirms the relationship between
the selected parameters: higher power-weight ratio,
bigger number of tractors and growth of soil
mineralization increase gross output and labour
productivity, which are the basis for higher wages; the
growth of the human development index, capital
investment in education, and health care increase the
level of labour potential and its productivity. The
parameters X
4
(number of tractors) and X
8
(stationary
and mobile sources of air pollution) have a negative
impact on labour productivity. X
9
factor (total waste
accumulated at landfill) does not affect the modelling
result.
Thus, correlation analysis of statistical data has
revealed the impact strength and the relationship
reliability between the model`s factor variables and
the final indicator of labour potential application, i.e.
labour productivity.
2.2.1 Generalized Linear Model (GLM)
Generalized Linear Model is a universal method of
building regression models, which allows to take into
account factors` interaction, the type of distribution
of a dependent variable and assumptions about the
nature of regression dependence. GLM is a well-
designed and easy-to-understand way to build
models.
GLM has the next advantages when doing
analysis in comparison with traditional methods:
- the ability to take into account complex types of
factors` interaction;
- a wide choice of dependence function`s type;
- lack of requirements for the normality of the
response variable`s distribution;
- statistical measurement of various factors`
impact on the observed value;
- obtaining information on the reliability of the
constructed model results.
2.2.2 Artificial Neural Network
Neural network algorithms and technologies as the
latest modelling and forecasting methods applied for
various economic processes have been actively
developed (Al'mukhamedova, 2021; Dawes, 2022;
Maehashi, 2020; Zaporozhchenko et al., 2019).
During network operation, the values of input
variables are put to input elements. Then neurons of
the intermediate and output layers start operating.
Each of them assesses its value of activation,
subtracting from the previous layer`s sum its
threshold. Further step is to develop the activation
function of the presented data, resulting in a neuron
output signal. After performing all neurons`
operations, the output value of the last neurons` layer
is taken for the output value of the entire network.
The system, which could be taught about
significant volumes of information, building
correlations and functional dependencies, which
cannot be detected when using other information
processing methods, is one of the advantages of
system`s forecasting based on artificial neural
networks (ANN).
Neural network modelling benefit is neural
networks` potential to find out optimal indicators for
the tool and build optimal prediction strategy for the
range. Moreover, these strategies can be adaptive,
changing with external factors shift, which is
especially important for the systemic phenomena of
sustainable development.
2.2.3 Random Forest Algorithm
Modern ensemble methods of machine learning for
the regression classification include the Random
Forest method, which is to build an array ("forest") of
decision-making trees, making an average forecast
(regression) of the built trees. Random forest is a
managed learning algorithm. Built "Forest" is an
ensemble of decision trees, which is typically taught
by the method of "bags". The general idea of the
“bags” method is to combine learning models to
increase the overall result.
ISC SAI 2022 - V International Scientific Congress SOCIETY OF AMBIENT INTELLIGENCE
190

3 RESULTS AND DISCUSSION
To check the statistical significance of the difference
between model`s mean values of input parameters
and to assess the probability of their interaction, the
dispersion analysis of sustainable development
parameters was carried out (Table 1).
The dispersion analysis revealed that parameters
X
1
(average nominal wage of full-time employees in
agriculture), X
4
(number of tractors per 100 hectares
of sown area), X
6
(mineral fertilizers) have the
biggest impact on labour productivity. X
3
(power-
weight ratio) has somewhat smaller influence. X
2
parameter (energy security) is insignificant.
To build a generalized regression model (GLM),
a linear model coefficients were calculated. Building
of a generalized regression model in the Rstudio
software environment:
Call:
glm(formula = Y ~ ., family =
"gaussian", data = scaled_tr)
Deviance Residuals:
Min 1Q Median 3Q Max
-0.248644 -0.061787 0.002466 0.059341
0.281375.
Coefficients:
Estimate Std. Error t value Pr(>|t|)
(Intercept) 0.25518 0.04391 5.811
6.35e-08***
X1 0.26334 0.10127 2.600 0.0106*
X2 -0.11443 0.49408 -0.232 0.8173
X3 0.25227 0.55407 0.455 0.6498
X4 -0.34562 0.19872 -1.739 0.0849
X5 0.02655 0.50460 0.053 0.9581
X6 0.67904 0.09670 7.022 2.03e-10***
X7 -0.09787 0.07328 -1.336 0.1845
X8 -0.10786 0.09928 -1.086 0.2797
X9 0.21204 0.12418 1.707 0.0906
X10 0.12414 0.06547 1.896 0.0606
X11 -0.25292 0.13467 -1.878 0.0631
Signif. codes: 0‘***’ 0.001‘**’
0.01‘*’ 0.05‘.’ 0.1‘ ’ 1
(Dispersion parameter for gaussian
family taken to be 0.01255949).
The resulting equation of regression to find the
resulting indicator (labour productivity) is presented
as:
Y=0,25518+0,26334X
1
-0,11443X
2
+0,25227X
3
-
0,34562X
4
+0,02655X
5
+0,67904X
6
-0,09787X
7
-
0,10786X
8
+0,21204X
9
+0,12414X
10
-0,25292X
11
(1)
Visualization of the forecasting results by the
method of the generalized regression model (Fig. 3).
A neural network consisting of three layers, each
of which has seven, three and one direct propagation
neurons was studied. As an optimization algorithm
the method of reverse error distribution, the activation
function of hidden layers` neurons – Sigmoid, output
layer – linear, input initialization of scales – arbitrary,
the loss function as the error sum of squares were
used. Network learning consisted of finding and
determining the weights of neurons (synaptic
weights) that minimize the difference between the
target variable and the outcome of the network
(Derbentsev et al., 2020). To teach the network, a data
set consisting of a set of input parameters and the
desired output values (target value of labour
productivity) was applied.
The study modelling was provided by the
programming language R using the Rstudio software
(free environment for software development with free
input code for programming language R applied for
statistical data processing and graphics) (Hornik,
2015). The weights of each layer`s neurons of the
network after learning were obtained. The graphical
illustration of the obtained neural network in the
Rstudio environment is as follows (Fig. 4).
The model based on the decision tree "Random
Forest"(Xie, 2020, Sinha, 2019), including 500 trees
(combinations of parameter values) was analyzed too:
Call:
randomForest(formula = Y ~ ., data =
scaled_tr, ntree = 500, mtry = 3,
importance = TRUE, proximity = TRUE,
oob.prox = FALSE.
Type of random forest: regression.
Number of trees: 500
No. of variables tried at each split:
3.
Mean of squared residuals: 0.01138498
% Var explained: 77.74.
The Random Forest method (Fig. 5, 6) also proves
significant impact of parameters X
1
(average monthly
nominal wages), X
6
(mineral fertilizers), X
5
(number
of tractors), and X
11
(capital investment) on the
efficiency of labour potential in the agrarian sector
(labour productivity).
The results of forecasting by the method of
artificial neural networks and the method of Random
forest in comparison with the modelled values are
presented by Fig. 6,7, respectively.
Comparative analysis of artificial neural
networks, Random forest method and generalized
linear regression method for predicting sustainable
development in the agricultural sector prove that each
of these methods can be used (Table 2), but, in our
opinion, the most appropriate is the application of
artificial neural networks` method, as it has a number
of advantages.
Sustainable Development Forecasting of the Agricultural Sector using Machine Learning
191
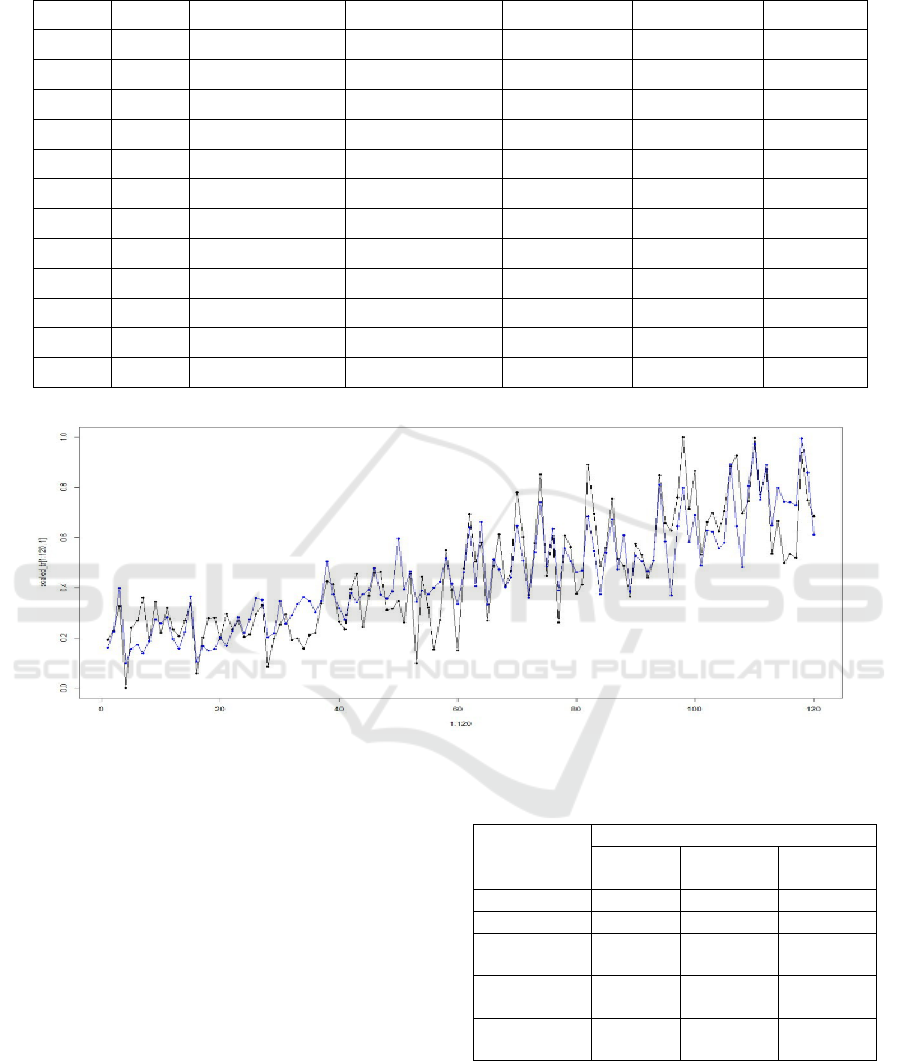
Table 1: Dispersion analysis of sustainable development parameters.
Df Sum Sq Mean Sq F value Pr (>F)
X
1
1 2,42E+11 2,42E+11 282,8 < 2Е-16 ***
X
2
1 5,75E+09 5,75E+09 6,731 0,0107 *
X
3
1 6,93E+09 6,93E+09 8,11 0,0052 **
X
4
1 1,13E+10 1,13E+10 13,251 0,0004 ***
X
5
1 2,56E+09 2,56E+09 2,994 0,0864 .
X
6
1 4,70E+10 4,70E+10 54,978 2,90E-11 ***
X
7
1 2,84E+09 2,84E+09 3,322 0,0711 .
X
8
1 3,15E+08 3,15E+08 0,369 0,545
X
9
1 1,44E+09 1,44E+09 1,683 0,1973
X
10
1 2,45E+09 2,45E+09 2,861 0,0936 .
X
11
1 3,02E+09 3,02E+09 3,527 0,0630 .
Residuals 108 9,23E+10 8,55E+08
Figure 3: Calculated (black) and forecasted (blue) values of Y (GLM method).
A specific feature of the methodological approach to
building a forecasting model is artificial neural
networks` method, which allows to take into account
a significant number of impact factors and to ensure
minimal forecasting error (Kernasyuk, 2017), the
nonlinearity and interaction of parameters (Maehashi,
2020). Analysis of the obtained models showed that
the forecasting results based on the GLM method give
the closest to the modelled values. Nevertheless, there
are lower values of the RMSE metric (total error of
the predicted value and known value) when teaching
the model. This is because modelling of the most
parameters` values for 2030 was based on the linear
models of approximations. Thus, the GLM model was
tracking the linear patterns of parameters behavior
during training.
Table 2: Forecasting results by different methods.
Metrics
Forecasting methods
Neural
net
Random
forest
GLM
RMSE 24424,36 27835,16 27735,43
R
2
0,82862 0,77741 0,77901
Predict for
2030
465768 403835 483210
Modelled
decision
508356 508356 508356
Forecast
accuracy, %
91,62 79,44 95,05
ISC SAI 2022 - V International Scientific Congress SOCIETY OF AMBIENT INTELLIGENCE
192
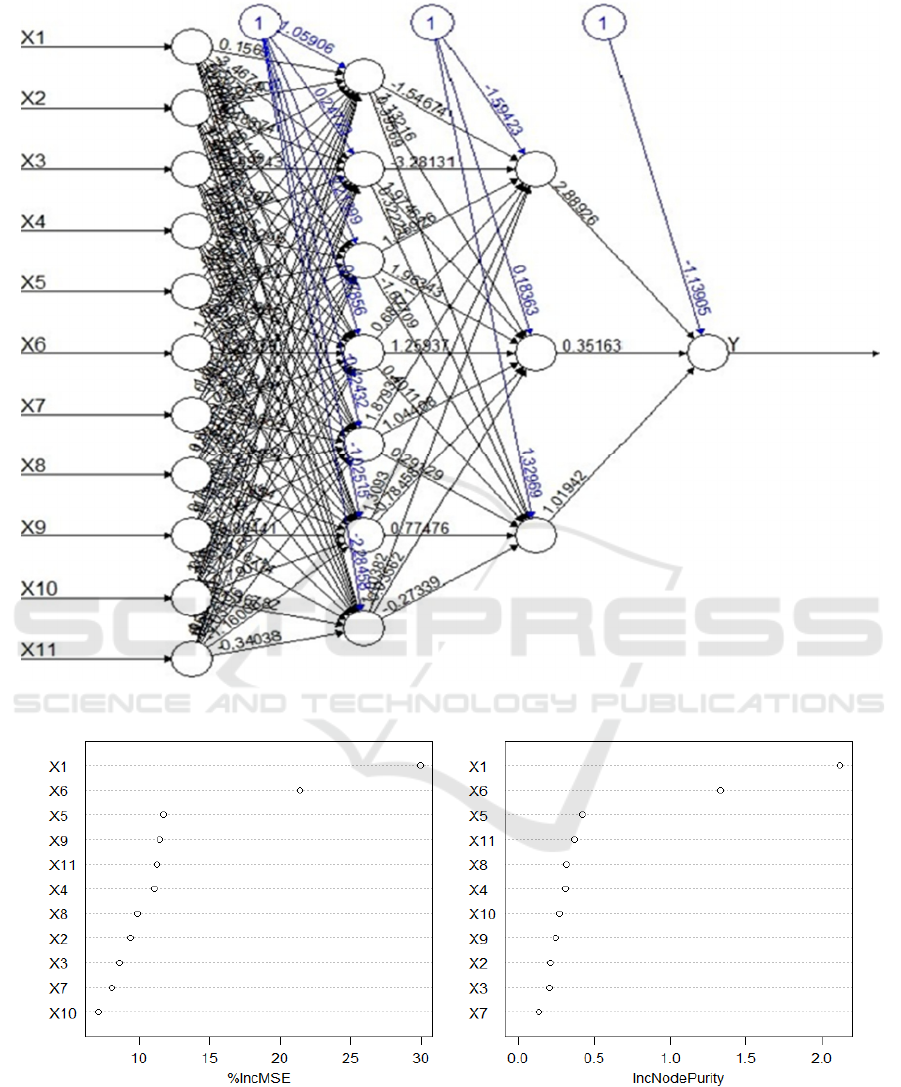
Figure 4: Adaptive neural model for forecasting sustainable development in the agrarian sector.
Figure 5: Each predictor`s importance.
Sustainable Development Forecasting of the Agricultural Sector using Machine Learning
193
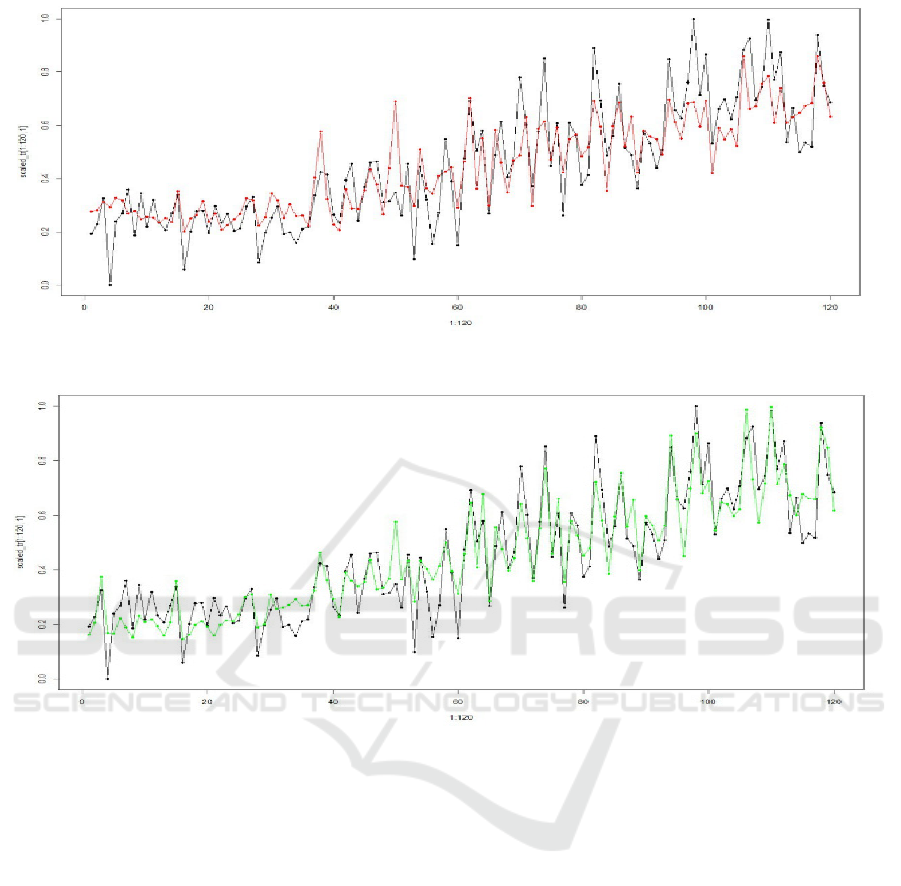
Figure 6: Calculated (black) and forecasted (red) values of Y (Random forest method).
Figure 7: Calculated (black) and forecasted (green) values of Y (Artificial neural networks method).
However, the results based on the neural network
give the lowest values of the RMSE metric. It means
that the model studied as much as possible real hidden
patterns of the analyzed data (necessary reliable
information for forecasting), and was able to build a
more reliable forecast. This is also proved by the
coefficient of determination R
2
of the neural network
model. It shows the degree of dispersion, being the
highest in the neural network.
The results based on the Random forest model
give much lower indices than in other models,
therefore, its application in this type of data for this
problem statement, in our opinion, cannot be
considered appropriate.
When doing research, the emulated data obtained
from the training data was applied for testing. Testing
results were similar to the results based on the training
data. In the future, for the accuracy of forecasting, it
is interesting to perform tests based on real historical
data. Their collection is somewhat complicated by the
changed methodology and reporting documentation
of the State Statistics Service of Ukraine.
Thus, based on the results, we can conclude that
the built neural network model gives more reliable
results for forecasting sustainable development
parameters in agriculture and can be used to develop
strategic management trends for labour potential in
agriculture, which will ensure its future development.
4 CONCLUSIONS
The neural network modelling allows to form a
multifactor impact model on the resulting indicator,
namely labour productivity in accordance with
sustainable development goals. The following impact
factors have been identified in the model: the average
monthly nominal wages of full-time employees in
agriculture, UAH (X
1
); energy security (power
capacities/sown area), kW/100 hа (X
2
); power-weight
ISC SAI 2022 - V International Scientific Congress SOCIETY OF AMBIENT INTELLIGENCE
194

ratio (power capacities /number of employees),
kw/per capita (X
3
); number of tractors per 100
hectares of sown area (X
4
); number of tractors per
1,000 employees (X
5
); mineral fertilizers per 1
hectare of sown area, kg (nutrients) (X
6
); organic
fertilizers for agricultural crops, per 1 hectare of sown
area, tons (X
7
); stationary and mobile sources of air
pollution, per capita, kg (X
8
); total waste accumulated
at landfill sites per capita, kg (X
9
); average index of
regional human development (X
10
); capital
investment per capita, UAH (X
11
). X
1
(average
monthly nominal wage), X
6
(mineral fertilizers), X
5
(number of tractors), and X
11
(capital investment)
have the most significant impact on the result. The
proposed model allows modelling and forecasting,
based not only on previously obtained indicators and
their change dynamics (it is the studied period from
2008 to 2019), but to set targets, which is important
in the context of sustainable development. That is
why there is possibility to have administrative impact
not only on the final result, but also on the process of
achieving it, including optimization. In addition, the
modelling allows to adjust impact factors, if they are
either insignificant, as it has been found out when
modelling, or lose significance due to technological
changes (e.g. energy security and power-weight
ratio). Thus, because of modelling aimed at
forecasting the level of labour potential in the context
of sustainable development, an approach to complex
systems has been used. According to it, each of its
components (impact factors on the resulting
indicator) is also a systemic phenomenon. Modelling
each factor`s behavior allows to affect their dynamics
and effectiveness.
The advantages of the applied neural network
modelling include the fact that there is no need to
check (as in traditional modelling) multicollinearity,
i.e. the linear relationship between factors. In the case
they are detected, the factors are being eliminated. It
devaluates the forecast. Therefore, the applied model
takes into account all input parameters, based on their
practical impact on the final result.
Thus, because of neural network modelling it is
possible to identify strategic trends of labour potential
management in the agricultural sector, as well as
economic, social and environmental activities aimed
at improving the quantitative and qualitative
indicators of human capital.
The proposed model allows not only modelling
and forecasting based on previously obtained
indicators and the dynamics of their change, but also
to set targets to obtain a range of possible scenarios
for system development, depending on forecasting
conditions and parameters, which not only increases
the validity of managerial decision-making. It also
ensures the relevance of management object`s
adaptation to the ever-changing environment;
managerial influence not only on the final result, but
also on the process of its achievement, including the
impact aimed at levers` of sustainable development
optimization.
In further research when determining the strategic
directions of labour potential management, it is
advisable to use other models` parameters to
characterize socio-environmental and economic
aspects, considering their significant effect on the
achievement of sustainable development goals in the
agricultural sector.
REFERENCES
Al'mukhamedova, O. (2021). Primenenie neyrosetevykh
sistem iskusstvennogo intellekta v dostizhenii
ustoychivogo razvitiya turizma. Servis v Rossii i za
rubezhom, 15 (3), 7-17. https://doi.org/10.24412/1995-
042X-2021-3-7-17
Bizianov, E., Gutnik, A., Pogorelov, R. (2021). Fuzzy
artificial neural network without rules for forecasting
and control tasks. Bulletin of DonNU. Series G:
Engineering Sciences. 1, 78-85.
Dawes, J.H.P. (2022). SDG interlinkage networks:
Analysis, robustness, sensitivities, and hierarchies,
World Development, 149, 105693,
https://doi.org/10.1016/j.worlddev.2021.105693
Derbentsev, V., Matviychuk, A., Datsenko, N.,
Bezkorovainyi, V. and Azaryan, A. (2020) Machine
learning approaches for financial time series
forecasting. Proceedings of the Selected Papers of the
Special Edition of International Conference on
Monitoring, Modeling & Management of Emergent
Economy (M3E2-MLPEED 2020) Odessa, Ukraine,
July 13-18, 2020. 434-450. http://ceur-ws.org/Vol-
2713/
Hornik, K. (2015). What is R? “R FAQ” The
Comprehensive R Archive Network.
Kernasyuk, Yu. (2017). Neyronni shtuchni merezhi yak
efektyvnyy instrument adaptyvnoho prohnozuvannya v
ahrarnomu sektori ekonomiky. Naukovi pratsi
Kirovohradsbkoho natsional'noho tekhnichnoho
universytetu. Ekonomichni nauky, 32, 224-231.
Khaykin, C. (2006). Neyronnye seti : Polnyy kurs. Moskva
: Vil'yams,. 1104.
Maehashi, K. & Shintani, M. (2020). Macroeconomic
Forecasting Using Factor Models and Machine
Learning: An Application to Japan. Journal of the
Japanese and International Economies, 101104.
https://doi.org/10.1016/j.jjie.2020.101104
Natsional'na dopovid' «Tsili Staloho Rozvytku: Ukrayina»
(2017).
Rehional'nyy lyuds'kyy rozvytok: stat. byuleten' (2018).
Kyyiv : Derzhavna sluzhba statystyky Ukrayiny.
Sustainable Development Forecasting of the Agricultural Sector using Machine Learning
195

Romanchukov, S., Berestneva, O., Petrova, L. (2019).
Teaching a neural network modeling socio-economic
development of the region. Digital sociology, 2 (2), 34-
40. https://doi.org/10.26425/2658-347X-2019-2-34-40
Sinha, P., Gaughan, A., Stevens, F., Nieves, J., Sorichetta,
A., & Tatem, A. (2019). Assessing the spatial
sensitivity of a random forest model: Application in
gridded population modeling. Computers, Environment
and Urban System, 75, 132-145.
https://doi.org/10.1016/j.compenvurbsys.2019.01.006
Vasyl'yeva, O. (2021). Trudovyy potentsial ahrarnoyi sfery
yak bazovyy imperatyv staloho rozvytku. Zaporizhzhya
: FOP Mokshanov, V.
Xie, X., Wu, T., Zhu, M., Jiang, G., Xu, Y., Wang, X., &
Pu, L. (2021). Comparison of random forest and
multiple linear regression models for estimation of soil
extracellular enzyme activities in agricultural reclaimed
coastal saline land. Ecological Indicators, 120, 106925.
https://doi.org/10.1016/j.ecolind.2020.106925
Zaporozhchenko, V. Y., Shepel, A. V., & Tkachuk, A. V.
(2019). Creation of neuron network productivity of
lucerne in Steppe zone of Ukraine. Agrology, 2(1), 47‒
50. https://doi.org/10.32819/2617-6106.2018.14017
ISC SAI 2022 - V International Scientific Congress SOCIETY OF AMBIENT INTELLIGENCE
196
