
Signal Detection for Tracer-Based-Sorting using Deep Learning and
Synthetic Data
Christian Linder
a
, Frank Gaibler, Andreas Margraf
b
and Steffen Geinitz
c
Fraunhofer Institute for Casting, Composite and Processing Technology IGCV,
Am Technologiezentrum 2, 86159 Augsburg, Germany
Keywords:
Signal Processing, Deep Learning, Tracer-Based-Sorting, Synthetic Data, Convolutional Neural Network
(CNN), Fluorescent Tracers, Data Augmentation, Recycling, Plastics Sorting.
Abstract:
Increasing environmental awareness and new regulations require an improvement of the waste cycle of plastic
packaging. Tracer-Based-Sorting (TBS) technology can meet these challenges. Previous studies show the
market potential of the technology. This work improves on the solution approach using artificial intelligence to
maximize the number of tracers that can be detected accurately. A convolutional neural network and random
forest classifier are compared for classification of each tracer based on signal intensities. The approach is
validated on different settings using synthetic data to counter the low amount of available data. The results
show that theoretically up to 120 tracers can be classified simultaneously under near-optimal conditions. Under
more difficult conditions, the maximum number of tracers is reduced to 45. Thus, the approach can increase
the diversity of TBS by increasing the maximum tracer count and enable a broader range of applications. This
helps to establish the technology in the field of recycling.
1 INTRODUCTION
Modern societies rely on mass production of all dif-
ferent kinds. One type of material in particular stands
out from the crowd: plastic has proven to be ex-
tremely useful because it is so easily moldable and
versatile which is why it is used almost everywhere.
This comes with a prize: production and disposal
of plastic generates greenhouse gases and hazardous
waste. At 3.22 million tons (2019), plastic sales pack-
aging is one of the most relevant plastic waste streams
in Germany alone. They take up over a quarter of
all plastic waste and are still mostly thermally recy-
cled. Since the share of plastic recyclate accounts for
a total of 13.7% of the processing volume, increasing
reuse is a major challenge (Conversio GmbH, 2020).
Increasingly, it is precisely the packaging properties
that pose barriers to high-quality recycling: packag-
ing is becoming smaller (pre-portioned units), more
wide-spread (“to-go” products) and is predominantly
equipped with portioning and handling functions as
e.g., pump dispensers. Unfortunately, design or dura-
bility reasons induce packaging units to be harmful to
a
https://orcid.org/0000-0002-2967-4581
b
https://orcid.org/0000-0002-2144-0262
c
https://orcid.org/0000-0001-9835-7937
the circulation (multilayer or black polymers). Pack-
aging waste can be sorted with state-of-the-art ma-
chinery (e.g., near infrared (NIR) sorter) only by main
polymers and colors and thus can no longer be re-
cycled on an equal basis by its plastic specification
(Woidasky et al., 2017). The state of Germany and
the European Union address this challenge with the
German Circular Economy Act 2012 (Bundesminis-
terium der Justiz, 2012) and the European Circular
Economy Action Plan (European Comission, 2018;
European Comission, 2020). They aim to establish a
sustainable circular economy, which is seen as a so-
lution to reduce raw materials and plastics. A more
comprehensible material flow is important to recycle
more efficiently. This work helps to establish new
ways to more reliably detect material flows, espe-
cially plastic materials. To achieve this, a new tech-
nology which was developed by Polysecure GmbH
called Tracer-Based-Sorting is used in combination
with artificial intelligence. This combination enables
the detection of many types of materials while main-
taining high accuracy.
Linder, C., Gaibler, F., Margraf, A. and Geinitz, S.
Signal Detection for Tracer-Based-Sorting using Deep Learning and Synthetic Data.
DOI: 10.5220/0011337000003332
In Proceedings of the 14th International Joint Conference on Computational Intelligence (IJCCI 2022), pages 323-330
ISBN: 978-989-758-611-8; ISSN: 2184-3236
Copyright © 2023 by SCITEPRESS – Science and Technology Publications, Lda. Under CC license (CC BY-NC-ND 4.0)
323
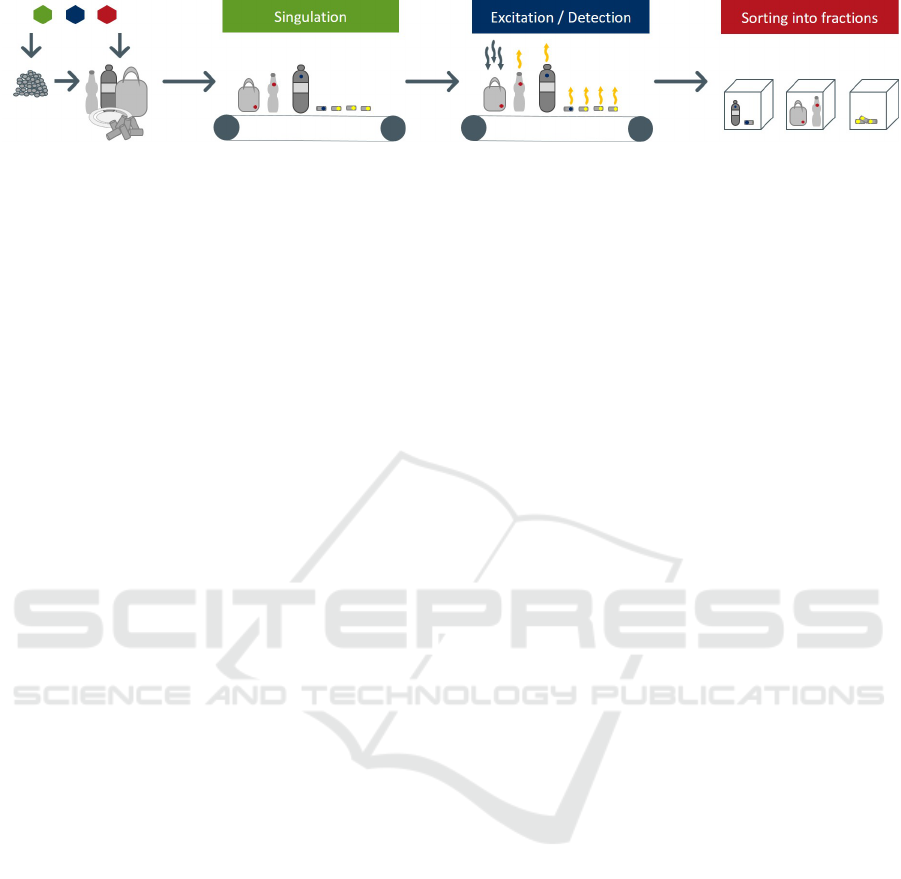
Figure 1: Illustration of the general tracer-based-sorting workflow for plastic waste (source: Polysecure GmbH; based on
(Treick, 2019; Gasde et al., 2020)).
1.1 Incentive
Comprehensive recycling is still a major challenge
(Conversio GmbH, 2020). The project MaReK
(Lang-Koetz and Woidasky, 2021) showed that the
establishment of a circular plastic economy can be
implemented with Tracer-Based-Sorting (TBS) tech-
nology, but not with a state-of-the-art NIR sorter
(Schmidt et al., 2021). At the same time, further
development needs for innovative approaches were
identified for market entry (Schmidt et al., 2022).
TBS can help plastics recycling to be more qualita-
tive and economical, enabling more circular economy
and environmental protection in terms of global mar-
ket economy. However, previous studies revealed the
importance of optimizing excitation, quantum yield,
and differentiability of fluorescence sorting codes
(Woidasky et al., 2020a).
The overarching goal of the project is to increase
the economic efficiency of TBS technology. This in-
novative sorting process is a central building block on
the way to a circular economy, as it allows for sub-
stantially higher material flow differentiation to be
achieved compared to current processes. The paper
aims to improve TBS for usage in a circular economy
and in addition widens its use to other fields of ap-
plication. Further extending the differentiable tracer
variants is one way to approach this. For that matter,
the goal is to develop a signal recognition approach
that classifies as many different tracers as possible
with as high an accuracy as possible.
1.2 Groundwork
TBS was developed by Polysecure GmbH and is an
innovative approach to detection and sorting steps in
waste management that enables sorting of materials or
products regardless of their physical properties. The
technology uses inorganic fluorescent tracers in ppm
concentrations. The tracers can be applied in the ma-
terial or on the surface by printing or using printed la-
bels. They emit bright emission lines in green, red and
near-infrared after stimulation with a laser. This sig-
nature emission differs depending on the used tracer
mixtures. The detection process is done by upconver-
sion. Upconversion is a multiphoton process. Lower
energy photons are absorbed and higher energy pho-
tons are emitted (Woidasky et al., 2020a). This pro-
cess practically does not occur in nature, so the mea-
surement is free from background noise.
Previous work showed that 11 out of 15 tested
variants could be detected (Woidasky et al., 2020b).
The waste sorting consists of a three stage ap-
proach, as sketched in Figure 1: The material waste is
collected and transported to the sorting facility, where
it is emptied in a waste bunker. During the singu-
lation stage, the objects are separated and placed in-
dividually on a conveyor belt, tray sorter or similar.
This is to ensure that only one item will be scanned
at a time during the following stage, in which the
fluorescent behavior of the inorganic tracers is trig-
gered by an electromagnetic stimulus. The emitted
light is captured by a sensitive sensor. The signal is
then further processed by a classification model dur-
ing the detection stage as can be seen in the cen-
tered excitation / detection label in Figure 1. The re-
sulting values are used to distinguish material types
in the sorting process and thus enable targeted pre-
sorting and subsequent processing into high-quality
recyclates (Woidasky et al., 2021).
1.3 Related Work
The following section will give an overview on the
research fields and previous work that inspired this
paper:
The field of time series classification has been ex-
amined in a comparative study by Bagnall et al. (Bag-
nall et al., 2016) who listed the most commonly used
algorithms based on series similarity, phase depen-
dent intervals, phase independent shapelets and dic-
tionaries. Further studies proposed deep learning for
time series classification (Ismail Fawaz et al., 2019),
analysis of EEG signals (Craik et al., 2019) and fea-
ture extraction using convolution and pooling opera-
tions (Zhao et al., 2017). Mertes et al. (Mertes. et al.,
2020; Mertes et al., 2022) demonstrated data augmen-
tation in an industrial application for images of tex-
tile defects. Also, fluorescence imaging was used for
plastic waste classification by Gruber et al. (Gruber
NCTA 2022 - 14th International Conference on Neural Computation Theory and Applications
324
et al., 2019).
As for garbage detection, Liu et al. (Liu et al.,
2021) designed a robot vision system to collect
and detect plastic waste and estimate poses using a
YOLACT FCN. A related machine vision approach
based on hyperspectral imaging for waste identifi-
cation was introduced by Krasniewski et al. (Kras-
niewski et al., 2021). Studies addressing signal pro-
cessing as bearing fault detection was published by
Zhang et al. (Zhang et al., 2020).
The authors of this paper confirm that to the best
of their knowledge this is the first publication that
presents a signal filter augmentation using a convo-
lutional neural network for TBS and packaging waste
identification.
1.4 Structure
The remainder of this paper is organized as follows:
Section 2 describes the algorithm design and config-
uration. Furthermore, section 3 elaborates the exper-
imental setup. Section 4 discusses the results accom-
panied by a critical reflection, before we conclude
with an overview of future applications and research
goals in section 5.
2 APPROACH
The following section proposes an approach to maxi-
mize the tracer count and accuracy for TBS. The ap-
proach uses the excited signals from the excitation /
detection step illustrated in Figure 1 to classify the
tracer variant. For that matter, each signal is prepro-
cessed. The classification method is based on a con-
volutional neural network (CNN) consisting of 1D-
filter operations due to its good performance for time
series classification (Ismail Fawaz et al., 2019). For
comparison, we use a state-of-the-art machine learn-
ing model from the random forest (RF) classifier fam-
ily. Due to the limited size of available data, we gen-
erate synthetic mixtures from real data to enlarge the
test and training dataset and to validate different tracer
mixture scenarios.
2.1 Preprocessing
For each classifier, we apply an appropriate prepro-
cessing method to prepare data to fit the input spec-
ification. The data consist of pulses for three chan-
nels in the time domain. As for the CNN, the data
is normalized to be in the range of 0 to 1. Further-
more, a down-sampling operation is applied so that
0.0
0.5
1.0
1.5
0 1000 2000 3000
Intensity
0.0
0.1
0.2
0.3
0 50 100
Time step
Intensity
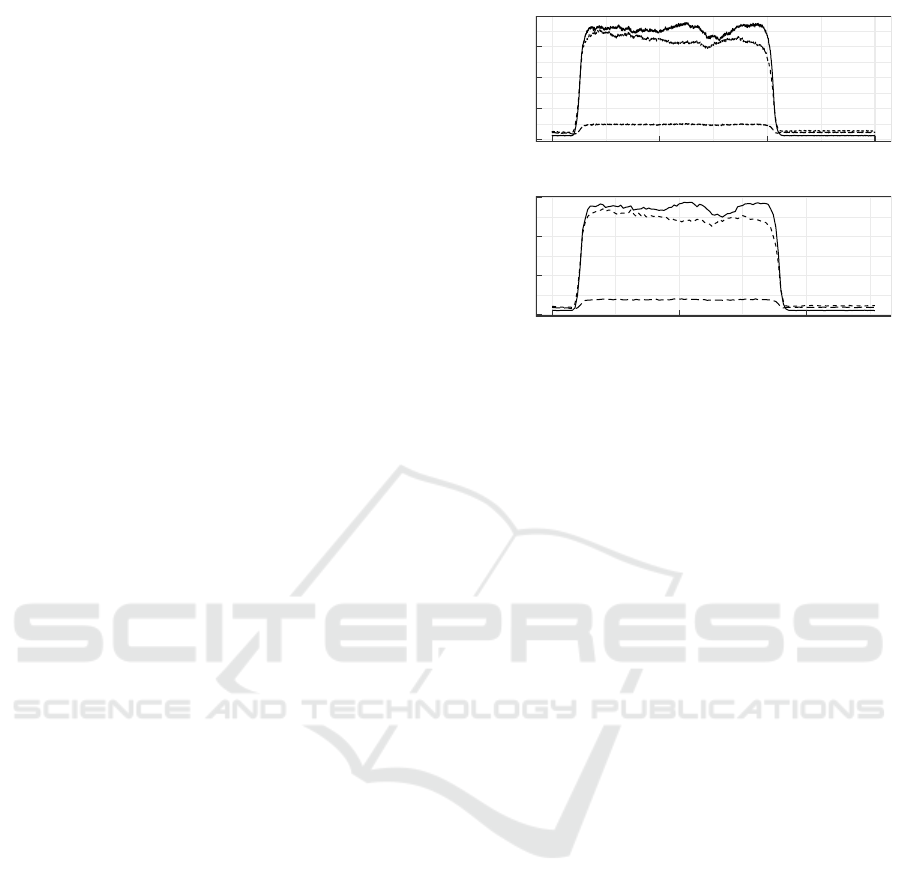
Figure 2: Preprocessing example of the CNN approach: the
top chart shows the original signal with three channels, the
bottom chart contains the time series after normalization
and compression.
each channel is reduced to 128 data points. The com-
pression lowers the complexity by removing redun-
dant information which in turn allows the model to
generalize better. Figure 2 presents an example of the
signal before preprocessing (top) and after normaliza-
tion and reduction; as can be seen, the number of time
steps is reduced from 3000 to 128. Likewise, the
maximum intensity decreases from 1.7 to less than
0.3 due to normalization. However, Figure 2 clearly
suggests that the main curve characteristics are pre-
served.
We then apply preprocessing and feature extrac-
tion to prepare data for the RF. Six features are ex-
tracted based on process-specific expert knowledge:
the channel ratio and peak value for each channel.
The channel ratios characterize a tracer mixture and
are derived from the maximum value of a channel.
The peak values are needed because the tracer ratios
can slightly vary due to the scan object’s conditions
like deformations and soiling on the packaging. Each
feature is subsequently normalized for the range from
0 to 1.
2.2 Generation of Synthetic Data
For this study, synthetic data is created in order to
counteract the small amount of mixture data available.
The synthetic data helps to validate the approach for
more different scenarios and can increase the gener-
alization of the model. Synthetic data is created by
scaling the primary (100%) tracer samples from each
category linearly and summing up the individual trac-
ers. During this process, each channel of each tracer
is augmented randomly by a factor of 0.02 to increase
Signal Detection for Tracer-Based-Sorting using Deep Learning and Synthetic Data
325

0.0
0.1
0.2
0.3
0 50 100
Time step
Intensity
Figure 3: Example of synthetically mixed tracers represent-
ing a mix rate of 50% of tracer 1 and 2 and 0% for tracer
3.
the variety of data. For example, a 50% mixture of
channel 1 and 2 with no augmentation is calculated
by taking 50% of tracer 1, 50% of tracer 2 and 0% of
tracer 3. Figure 3 exhibits the output of a synthetic
50% mix rate. This mix rate is equally applied to the
signal as for the example presented in Figure 2.
2.3 Convolutional Neural Network
In our approach we apply a CNN based on the residual
network (ResNet) kernel for classification (He et al.,
2016). The selection of the exact architecture is based
on multiple test runs and consists of 5 residual blocks.
Each residual block consists of two 1D convolutional
layers and one 1D max pooling layer. The architec-
ture is followed by two fully connected layers with
256 and 128 neurons subsequently where each layer
is combined with a dropout layer with a probability of
0.4. The last layer is a softmax layer.
The model is trained using the Adam optimizer
(Kingma and Ba, 2014) and a learning rate of 0.0001.
The batch size is set to 64. Furthermore, the model is
trained for 100 epochs where each epoch consists of
3456 synthetic samples.
2.4 Random Forest
A RF ensemble classifier with 100 decision trees is
trained for comparison due to its high generalization
ability and flexibility (H
¨
ansch and Hellwich, 2016).
The number of features to consider when looking for
the best split is set to 2 and the Gini criterion is used
for the evaluation of splits. The hyperparameter set-
ting is based on default values from scikit-learn (Pe-
dregosa et al., 2011).
3 EXPERIMENTAL SETUP
The following section describes the available data that
is used for the experiments. Furthermore, different
scenarios are proposed to validate our approach.
3.1 Data Acquisition and Preparation
The data was collected at Polysecure GmbH based on
several test runs with different tracers. Two individual
test runs are analyzed in detail. The test runs have to
be examined separately as individual datasets due to
different recording conditions.
The first dataset contains samples for the three pri-
mary tracers and samples for the 50 % mixtures of
these primary tracers. In total there are 11793 real
samples. In order to synthetically increase the vari-
ance in the dataset, the laser intensities for stimulat-
ing the tracers for individual recordings are varied.
This allows to emulate different conditions like soil-
ing on the packaging and therefore increased absorp-
tion which may occur in the real-world environment.
The second dataset consists of recordings of trac-
ers applied to printed white labels placed on black
panels. Dataset 2 contains samples for the primary
tracers and 50 % mixtures which is analogue to
dataset 1. In contrast, however, dataset 2 addition-
ally contains mixtures for 25 % step size. In total the
datasets comprise 1660 samples.
3.2 Evaluation Scenarios
To evaluate our approach, we define the following
three scenarios:
1. Incremental augmentation
2. Tracer count maximization
3. Synthetic mixture validation
In scenario 1, CNN and RF are compared by in-
crementally increasing the augmentation on the test
data. This becomes necessary because training and
testing is performed only on synthetic mixtures due to
limited availability of real mixtures. By augmenting
the data, the generalization to unknown scenarios can
be validated. Three different types of augmentation
are tested. In the first one, the noise level is gradu-
ally increased. The second augmentation deals with
the stepwise shifting of the curve in the time domain.
The last augmentation approaches an offset shift of
the curve intensity. The experiments are run five times
each due to the stochastic nature of the training meth-
ods while mean and standard deviation of the accu-
racy results are recorded.
The second scenario is designed to maximize the
tracer count. Hereby, the tracer count is incremented
stepwise, while the mean and standard deviation of
the related model’s accuracy are recorded over five
consecutive runs. As before, the training and valida-
tion is only applied to synthetic data. A stepwise noise
NCTA 2022 - 14th International Conference on Neural Computation Theory and Applications
326
augmentation is utilized on the test data to counterbal-
ance the usage of only synthetic data.
In scenario 3, the synthetic mixtures are validated
by training the model only on synthetic mixtures and
then validating on real samples. If the synthetic data is
similar to real data, then the model should generalize
well and achieve high accuracy values on the valida-
tion set. The training step is repeated five times.
4 RESULTS AND DISCUSSION
The following section describes the results for the
aforementioned experiment in details. At first, RF and
CNN are compared to each other. Then, the tracer
count is maximized by analyzing different tracer
count scenarios and lastly, the quality of the synthetic
data is investigated.
4.1 Model Comparison and Evaluation
CNN and RF are compared for a scenario with 45
tracer mixtures and incremental data augmentation.
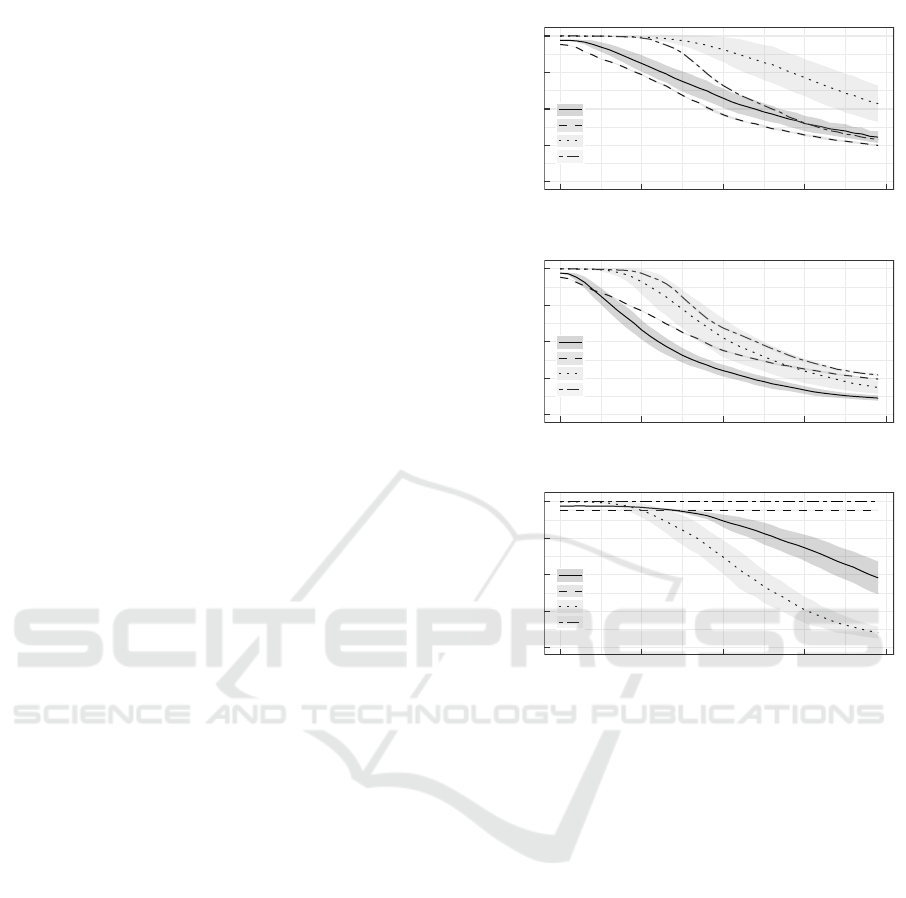
Figure 4 visualizes the results for noise, offset and
shift augmentation where the bars show the standard
deviation of five test runs. CNN-1 and RF-1 de-
scribe the results for dataset 1 and CNN-2 and RF-2
for dataset 2 respectively. The results appear simi-
lar but especially for noise augmentation, the CNN
exhibits slightly better accuracy values. Neverthe-
less, the CNN’s performance seems to significantly
decrease for high shift values. In contrast, high shift
values do not affect the RF approach because only
the maximum peak values are used for calculating the
features and the 40 time steps considered at maximum
are not enough to shift the peak of the curve out of the
time window.
It should be noted that the results for RF can prob-
ably be improved by more detailed hyperparameter
tuning and feature engineering. Nevertheless, the key
advantage of a CNN is that it automatically extracts
features and the model adapts for very complex sce-
narios if enough data is provided. Further studies are
expected to show, that more real data can be collected
once the demonstrator is ready for experimentation.
Furthermore, problems like shift can be alleviated by
using augmentation during training. Therefore, the
CNN approach will be further pursued for the previ-
ously mentioned tracer maximization scenario No. 2.
4.2 Maximizing Tracer Count
Next, we tested the model’s limitation on an increas-
ing number of tracers. Therefore, we applied the
0.00
0.25
0.50
0.75
1.00
0 1 2 3 4
Noise [%]
Accuracy
cnn-1
rf-1
cnn-2
rf-2
0.00
0.25
0.50
0.75
1.00
0 1 2 3 4
Offset [%]
Accuracy
cnn-1
rf-1
cnn-2
rf-2
0.00
0.25
0.50
0.75
1.00
0 10 20 30 40
Shift [time step]
Accuracy
cnn-1
rf-1
cnn-2
rf-2
Figure 4: Comparison of CNN and RF model configu-
rations: accuracies are measured for scenarios of varying
noise, offset and shift with 45 tracer mixtures.
CNN to different tracer counts by reducing the scal-
ing step width. Figure 5 shows the results, where the
top chart shows the results for dataset 1 and the bot-
tom accuracy values for dataset 2. Due to limited
space, the figures only display the values for noise
augmentation. Nevertheless, the results for offset and
shift are similar. As can be seen, the accuracy clearly
decreases for an increasing number of tracers. The
degradation of accuracy values between both datasets
derive from the use of different laser intensities during
data acquisition of dataset 1 which synthetically in-
creased the complexity in order to simulate real-world
conditions. Further results are shown in Table 1 for
dataset 1 and in Table 2 for dataset 2. In the tables,
more detailed results are illustrated for smaller tracer
numbers, whereas the previous plot had higher spac-
ing between tracer numbers to highlight the general
trend. Up to 45 tracers in dataset 1 and 120 tracers
in dataset 2 can be classified with high accuracy. For
these cases, the accuracy is greater than 97%. Nev-
Signal Detection for Tracer-Based-Sorting using Deep Learning and Synthetic Data
327

0.00
0.25
0.50
0.75
1.00
Accuracy
0.25
0.50
0.75
1.00
0 1 2 3 4
Noise [%]
Accuracy
Figure 5: CNN packaging material classification accuracy
for different numbers of tracer mixtures; Top: classification
accuracy for dataset 1. Bottom: classification accuracy for
dataset 2.
Table 1: CNN packaging material classification accuracy
for dataset 1.
Tracer
count
Noise
0 % 1 % 2 % 3 % 4 %
6 0.997 0.915 0.879 0.851 0.827
21 0.992 0.943 0.816 0.696 0.586
45 0.970 0.811 0.573 0.399 0.307
78 0.907 0.658 0.395 0.236 0.159
120 0.817 0.522 0.284 0.177 0.119
171 0.652 0.331 0.171 0.105 0.073
Table 2: CNN packaging material classification accuracy
for dataset 2.
Tracer
count
Noise
0 % 1 % 2 % 3 % 4 %
6 1.000 1.000 1.000 1.000 1.000
21 1.000 1.000 0.994 0.959 0.895
45 1.000 0.992 0.908 0.714 0.536
78 0.976 0.867 0.621 0.379 0.252
120 0.972 0.839 0.517 0.285 0.178
171 0.906 0.697 0.351 0.186 0.111
ertheless, the accuracy values decrease sharply with
increasing noise values. For dataset 1 and 45 trac-
ers the accuracy drops to 81% and for dataset 2 and
120 to 84% for a noise level of 1%. These results
suggest that considering both datasets, a maximum
of 120 tracers is possible under near-optimal condi-
tions. Whereas under more difficult conditions 45
tracers are accurately classifiable. Detailed results for
45 tracer are in the aforementioned Figure 4.
Nevertheless, the results have to be viewed with
some caution. The reason for this is that only syn-
thetic data is used for validation. The incremental
augmentation can only counter this problem to some
degree and further studies have to confirm these re-
sults with more real data.
4.3 Validation of Synthetic Mixtures
As for the last scenario, a training is applied only to
the synthetic mixtures and the validation on the real
mixture samples to validate how well the synthetic
data represents the real-world data. Figure 6 shows
the results for this scenario. CNN-1 and RF-1 exhibit
the results for dataset 1 validated on the according
model while CNN-2 and RF-2 show the related result
for dataset 2. In summary, the outcome suggests that
real mixtures can be mapped well for small numbers
of tracers. But as the number of tracers increase, the
accuracy significantly decreases.
This effect can be explained as follows: even
though we perform the experiments on augmented
data, we use the same overall dataset and partition
it in smaller subsets. Therefore, the tolerance range
becomes smaller with each additional mixture setting
which results in a potentially higher error rate. In
the previous validation scenario, this effect was not
as strong, but was already present. The small devi-
ation to the previous validation scenario shows that
synthetic and real data are not identical, but especially
the high accuracy values at low tracer counts indicate
that the synthetic and real data have similar proper-
ties. We consider this relation sufficient for initial the-
oretical analysis.
5 CONCLUSION AND OUTLOOK
The recycling of plastic waste is a ubiquitous chal-
lenge due to the incredible mass deployed around the
world each day. In this paper, we propose a technique
0.00
0.25
0.50
0.75
1.00
40 80 120
Tracer count
Accuracy
cnn-1
cnn-2
rf-1
rf-2
Figure 6: Validation of models trained exclusively on syn-
thetic data and validated on real data.
NCTA 2022 - 14th International Conference on Neural Computation Theory and Applications
328

for improving the efficiency of packaging waste recy-
cling by means of TBS. Our approach builds upon sig-
nal data from fluorescent emitting tracers which can
be combined in any way to indicate the type of plas-
tic. We applied two different classification models, a
RF and CNN to distinguish between the tracer com-
binations by signal intensity per channel. Due to the
limited size of the training and test data, we used syn-
thetic data which we generated by artificially varying
the tracer channels and their mixture. We then com-
pared the RF and CNN in different evaluation scenar-
ios in order to compare and assess the models.
The results show that although model perfor-
mance decreases for theoretically high numbers of
tracers, their accuracy still remains high enough for
classification decisions up to a tracer count of 120 un-
der near-optimal conditions. In more difficult condi-
tions, the maximum number of tracers is reduced to
45.
Furthermore, RF and CNN seem to provide simi-
lar results at first sight; however, the experimentation
suggests that the performance of the CNN is likely
limited due to the low variation in the dataset and the
small amount of available data. It should be men-
tioned that this problem could be alleviated by at-
taining more training data and using further data aug-
mentation methods while training. The experiments
suggest that synthesized data from tracer data repre-
sent the real-world data well enough for first insights.
Nevertheless, further studies with more real data are
needed to confirm our results. Especially the effects
of contamination on the surface need to be studied
more in detail on real data.
In view of the dataset size and tracer quality, this
study reveals the potential of future TBS applications.
In addition, the use of computer vision algorithms
in combination with our signal processing approach
would increase the search space and add to the avail-
able features which would certainly allow to better
distinguish between different tracers. The authors
plan to continue the work presented in this paper and
improve the field of TBS. Further studies are intended
to increase the economic efficiency of a circular econ-
omy of plastic packaging by means of AI innovation.
ACKNOWLEDGEMENTS
The authors would like to thank the German Federal
Ministry of Education and Research for supporting
the project Tracer Based Sorting – Effizient und Flex-
ibel (Tasteful). The authors would also like to express
their thanks to Polysecure GmbH for providing mea-
surement data and helpful support.
REFERENCES
Bagnall, A., Lines, J., Bostrom, A., Large, J., and Keogh,
E. (2016). The great time series classification bake
off: a review and experimental evaluation of recent
algorithmic advances. Data Mining and Knowledge
Discovery, 31(3):606–660.
Bundesministerium der Justiz (2012). Kreislaufwirtschafts-
gesetz. https://www.bkv-gmbh.de/studien/. Viewed
on 01.02.2022.
Conversio GmbH (2020). Studie: Stoffstrombild kunst-
stoffe in deutschland 2019. https://www.bkv-gmbh.
de/studien/. Viewed on 01.02.2022.
Craik, A., He, Y., and Contreras-Vidal, J. L. (2019). Deep
learning for electroencephalogram (EEG) classifica-
tion tasks: a review. Journal of Neural Engineering,
16(3):031001.
European Comission (2018). A european strat-
egy for plastics in a circular economy.
https://eur-lex.europa.eu/legal-content/EN/TXT/
?qid=1516265440535&uri=COM:2018:28:FIN.
Viewed on 01.02.2022.
European Comission (2020). A new circular economy ac-
tion plan. https://eur-lex.europa.eu/legal-content/EN/
TXT/?qid=1583933814386&uri=COM:2020:98:FIN.
Viewed on 01.02.2022.
Gasde, J., Woidasky, J., Moesslein, J., and Lang-Koetz, C.
(2020). Plastics recycling with tracer-based-sorting:
challenges of a potential radical technology. Sustain-
ability, 13(1):258.
Gruber, F., Gr
¨
ahlert, W., Wollmann, P., and Kaskel, S.
(2019). Classification of black plastics waste using
fluorescence imaging and machine learning. Recy-
cling, 4(4):40–0.
H
¨
ansch, R. and Hellwich, O. (2016). Random Forests,
pages 1–42. Springer Berlin Heidelberg, Berlin, Hei-
delberg.
He, K., Zhang, X., Ren, S., and Sun, J. (2016). Deep resid-
ual learning for image recognition. In Proceedings of
the IEEE conference on computer vision and pattern
recognition, pages 770–778.
Ismail Fawaz, H., Forestier, G., Weber, J., Idoumghar, L.,
and Muller, P.-A. (2019). Deep learning for time series
classification: a review. Data mining and knowledge
discovery, 33(4):917–963.
Kingma, D. P. and Ba, J. (2014). Adam: A
method for stochastic optimization. arXiv preprint
arXiv:1412.6980.
Krasniewski, J., Dabala, L., and Lewandowski, M. (2021).
Hyperspectral imaging for analysis and classification
of plastic waste. In 2020 25th International Confer-
ence on Pattern Recognition (ICPR). IEEE.
Lang-Koetz, C. and Woidasky, J. (2021). Markerbasiertes
sortier- und recyclingsystem f
¨
ur kunststoffverpackun-
gen.
Liu, J., Balatti, P., Ellis, K., Hadjivelichkov, D., Stoy-
anov, D., Ajoudani, A., and Kanoulas, D. (2021).
Garbage collection and sorting with a mobile manip-
ulator using deep learning and whole-body control.
Signal Detection for Tracer-Based-Sorting using Deep Learning and Synthetic Data
329

In 2020 IEEE-RAS 20th International Conference on
Humanoid Robots (Humanoids). IEEE.
Mertes, S., Margraf, A., Geinitz, S., and Andr
´
e, E. (2022).
Alternative data augmentation for industrial moni-
toring using adversarial learning. arXiv preprint
arXiv:2205.04222.
Mertes., S., Margraf., A., Kommer., C., Geinitz., S., and
Andr
´
e., E. (2020). Data augmentation for semantic
segmentation in the context of carbon fiber defect de-
tection using adversarial learning. In Proceedings of
the 1st International Conference on Deep Learning
Theory and Applications - Volume 1: DeLTA,, pages
59–67. INSTICC, SciTePress.
Pedregosa, F., Varoquaux, G., Gramfort, A., Michel, V.,
Thirion, B., Grisel, O., Blondel, M., Prettenhofer,
P., Weiss, R., Dubourg, V., Vanderplas, J., Passos,
A., Cournapeau, D., Brucher, M., Perrot, M., and
Duchesnay, E. (2011). Scikit-learn: Machine learning
in Python. Journal of Machine Learning Research,
12:2825–2830.
Schmidt, J., Auer, M., Moesslein, J., Wendler, P., Wiethoff,
S., Lang-Koetz, C., and Woidasky, J. (2021). Chal-
lenges and solutions for plastic packaging in a circular
economy. Chemie Ingenieur Technik, 93(11):1751–
1762.
Schmidt, J., Grau, L., Auer, M., Maletz, R., and Woidasky,
J. (2022). Multilayer packaging in a circular economy.
Polymers, 14(9):1825.
Treick, A. C. H. (2019). Evaluation der ablagetech-
nologie identifizierter artikel in fraktionen: Entwick-
lung von innovationsans
¨
atzen f
¨
ur das markerbasierte
sortieren von kunststoffverpackungen: zum erlangen
des akademischen grades bachelor of science.
Woidasky, J., Auer, M., Schmidt, J., Kusch, A., Gasde, J.,
Lang-Koetz, C., Wiethoff, S., Sander, I., Schau, A.,
Richards, B. S., Turshatov, A., Busko, D., Treick, A.,
Wendler, P., Kirchenbauer, D., Wacker, D., Fuchs, F.,
and Moesslein, J. (2021). Tracer-based-sorting in der
verpackungs-abfallwirtschaft. M
¨
ull und Abfall, (7):5–
13. 38.01.05; LK 01.
Woidasky, J., Heyde, M., Sander, I., Moesslein, J., Fahr,
M., Richards, B., Turshatov, A., and Lang-Koetz, C.
(2017). Hochwertiges recycling durch tracer-nutzung.
ReSource, 30(4):24–8.
Woidasky, J., Sander, I., Schau, A., Moesslein, J., Wendler,
P., Wacker, D., Gao, G., Kirchenbauer, D., Kumar, V.,
Busko, D., et al. (2020a). Inorganic fluorescent marker
materials for identification of post-consumer plastic
packaging. Resources, Conservation and Recycling,
161:104976.
Woidasky, J., Schmidt, J., Auer, M., Sander, I., Schau,
A., Moesslein, J., Wendler, P., Kirchenbauer, D.,
Wacker, D., Gao, G., et al. (2020b). Photoluminescent
tracer effects on thermoplastic polymer recycling. In
Advances in Polymer Processing 2020, pages 1–13.
Springer.
Zhang, S., Zhang, S., Wang, B., and Habetler, T. G.
(2020). Deep learning algorithms for bearing fault
diagnostics—a comprehensive review. IEEE Access,
8:29857–29881.
Zhao, B., Lu, H., Chen, S., Liu, J., and Wu, D. (2017). Con-
volutional neural networks for time series classifica-
tion. Journal of Systems Engineering and Electronics,
28(1):162–169.
NCTA 2022 - 14th International Conference on Neural Computation Theory and Applications
330
