
Random Walk Simulation on Crude Oil Price for the First 20 Years in
the 21
st
Century
Shaomin Yan
a
and Guang Wu
b
National Engineering Research Center for Non-Food Biorefinery, State Key Laboratory of Non-Food Biomass and Enzyme
Technology, Guangxi Academy of Sciences, 98 Daling Road, Nanning, 530007, Guangxi, China
Keywords: Big Data Mining, Crude Oil Close Price, Random Walk, Simulation.
Abstract: The crude oil perhaps is the most important commodity in the world. Therefore, not only the crude oil price
but also its derivates such as futures and warrants are closely following by hedge funds, investment banks and
institutions, individual investors, venture capitals, etc. In reality, the crude oil price is subject to many factors,
which lead it less manipulated and more random. We therefore apply the random walk simulation to study
the crude oil prices for the first 20 years in the 21st century in this report. The results show that the random
walk simulation can follow the general trend closely for a relatively short period, but fails to catch up with
historically unprecedented event.
1 INTRODUCTION
The crude oil perhaps is the most important
commodity in the world. Although the crude oil is a
natural resource, historically there were several oil
crises, which significantly impacted global economy.
In an ideal world, the crude oil price should be
relatively predictable because it should follow the
supply-demand principle while the increase of the
world economy is predictable. In reality, the oil price
influences not only the world economy but also the
world politics. Indeed, many conflicts in Middle East
and Africa have deep roots related to oil explorations
and productions.
Under the circumstance of climate change, as a
fossil energy, the oil is subject to environmental
activists, NGO and governmental policies, and is
relevant to the carbon footprint.
Therefore, not only the crude oil price but also its
derivates such as futures and warrants are closely
following by hedge funds, investment banks and
institutions, individual investors, venture capitals,
etc.
Needless to say, the oil price is also an objective
of enormous studies, which are even too many to cite
here. Of studies, every approach is applied to the oil
a
https://orcid.org/0000-0001-7642-3972
b
https://orcid.org/0000-0003-0775-5759
price including fundamental and technological
analyses, mathematical and statistical investigations,
empirical and theoretical examinations, etc. Of
numerous approaches, the random walk is attractive
(Zhu, et al., 2017; Chen, et al., 2017) because the
crude oil as influenced by too many factors to count
should have some property of randomness not as a
local market is subject to manipulation.
Because of particular randomness, we apply the
random walk simulation to study the crude oil prices
for the first 20 years in the 21st century in this report.
2 MATERIALS AND METHODS
2.1 Crude Oil Price Data
The NY Mercantile - NY Mercantile Delayed Price
for the first 20 years in the 21st century was
downloaded from Yahoo Finance (
Yahoo Finance,
2021)
. As always, the crude oil price includes daily
open, high, low, close, adjusted close prices, and
volume. We consequentially use the close price for
the simulations
The data consist of 4991 trading days. We
arbitrarily stratify the data into five fractions: (i) 4991
Yan, S. and Wu, G.
Random Walk Simulation on Crude Oil Price for the First 20 Years in the 21st Century.
DOI: 10.5220/0011191900003440
In Proceedings of the International Conference on Big Data Economy and Digital Management (BDEDM 2022), pages 569-573
ISBN: 978-989-758-593-7
Copyright
c
2022 by SCITEPRESS – Science and Technology Publications, Lda. All rights reserved
569

close prices from 2001 to 2020, (ii) 3744 close prices
from 2006 to 2020, (iii) 2895 close prices from 2011
to 2020, (iv) 1247 close prices from 2016 to 2020,
and (v) 251 close prices for 2020.
2.2 Random Walk
The random walk (Feller, 1968) is practically
straightforward and easily understandable because it
simply records a movement in x, y coordinates. This
movement starting from the origin is dictated to move
just one unit along both axes. Because the x-axis
represents the time course, so the movement along the
x-axis is always towards the positive direction. In
contrast, the movement along y-axis can go two
ways, i.e. each movement can either be positive, 1, or
negative, –1. Historically, 1/–1 came from tossing a
fair coin, but it now can achieve through a random
number generator in any computer program because
the outcome of tossing a coin is a pseudo-random
event with the Monte Carlo algorithm such as
SigmaPlot (SPSS Inc, 2002).
2.3 Crude Oil Close Price in
Conformation of a Random Walk
To be simulated by random walk, it is better to
convert the crude oil close price into the
conformation of a random walk. This is relatively
easily done by comparing a crude oil close price with
that in its preceding trading day, and by then
assigning 1 or –1 if the comparison results in larger
or smaller.
In the x, y coordinates, both random walk
simulation and crude oil close price in conformation
of a random walk are spotted as the trading date goes
along the x-axis and 1 or –1 moves along the y-axis.
The, we can compare the difference between these
two profiles to determine the good-of-fitness.
Because each seed in the command to generate the
random numbers generates different series of random
numbers, which results in different random walk
simulations, so we find the seed for good-of-fitness
from 100 000 seeds.
2.4 Random Walk in Decimal
Conformation
The conversion of crude oil close price into the 1/–1
conformation would be accused of oversimplifying
the real-life complicated situation although it answers
the simplest question of whether the crude oil goes up
or down overnight. To overcome this shortage, we
should push the classical random walk to the decimal
conformation from the 1/–1 conformation. This is not
difficult to do because we can simply omit the step of
comparison of sequential random numbers and
assignment of the 1 or 1, but directly use these
generated random numbers to form a random walk
simulation. In such a case, we need to set the
command with relevant upper and lower ranges.
2.5 Worked Example
Table I shows a worked example on the procedure to
create random walk simulations. Columns 1 and 2 are
the data documented in NY Mercantile. Column 3 is
the comparison between two sequential crude oil
close prices, for example, the crude oil close price is
$ 61.18 on January 2, 2020 (Columns 1 and 2) while
the price on January 3, is $ 63.05 (Columns 1 and 2),
which is higher than its preceding day, so we assign
1 to the second cell in Column 3, and continue this
comparison until the end of Table I. Column 4 is the
created random walk for the crude oil close price in
the 1/–1 conformation, which is the accumulation of
data in Column 3. Column 5 is the random numbers,
which were generated by SigmaPlot using a seed of
4.33068. Column 6 is the comparison between two
sequential random numbers in Column 5. Column 7
is a random walk, which is in fact a simulation on this
particular seed of 4.33068. Column 8 is the random
numbers, which were generated by SigmaPlot using
a seed of 6.16373 with upper and lower ranges of
standard deviations of crude oil close price for 2020.
Column 9, although it is similar to the operation for
Column 7, is the addition of cells in Column 1 with
the next cells in Column 8, which is a random walk
simulation in the decimal conformation.
Table 1: Procedure to create random walk simulations.
Date Crude
Oil Close
Price
Compare
Preceding
Close Price
Random Walk in
1 or–1
Conformation
Generated
Random Number
Compare
Preceding
Random Number
Random Walk in
1 or–1
Conformation
Generated
Random
Number
Random Walk
in Decimal
Conformation
January 2, 2020 61.18 0 0.892394 0 –1.293315
January 3, 2020 63.05 1 1 –0.40909 –1 –1 1.915306 63.1
January 6, 2020 63.27 1 2 –0.641479 –1 –2 4.652787 67.75
January 7, 2020 62.7 –1 1 0.860897 1 –1 –2.84741 64.9
January 8, 2020 59.61 –1 0 0.645762 –1 –2 0.478926 65.38
January 9, 2020 59.56 –1 –1 –0.339257 –1 –3 –4.264635 61.11
BDEDM 2022 - The International Conference on Big Data Economy and Digital Management
570
January 10, 2020 5904 –1 –2 –0.412953 –1 –4 –1.34917 59.77
January 13, 2020 58.08 –1 –3 0.878346 1 –3 –0.531944 59.23
January 14, 2020 58.23 1 –2 0.069734 –1 –4 3.44592 62.68
January 15, 2020 57.81 –1 –3 0.191641 1 –3 –1.6466 61.03
3 RESULTS AND DISCUSSION
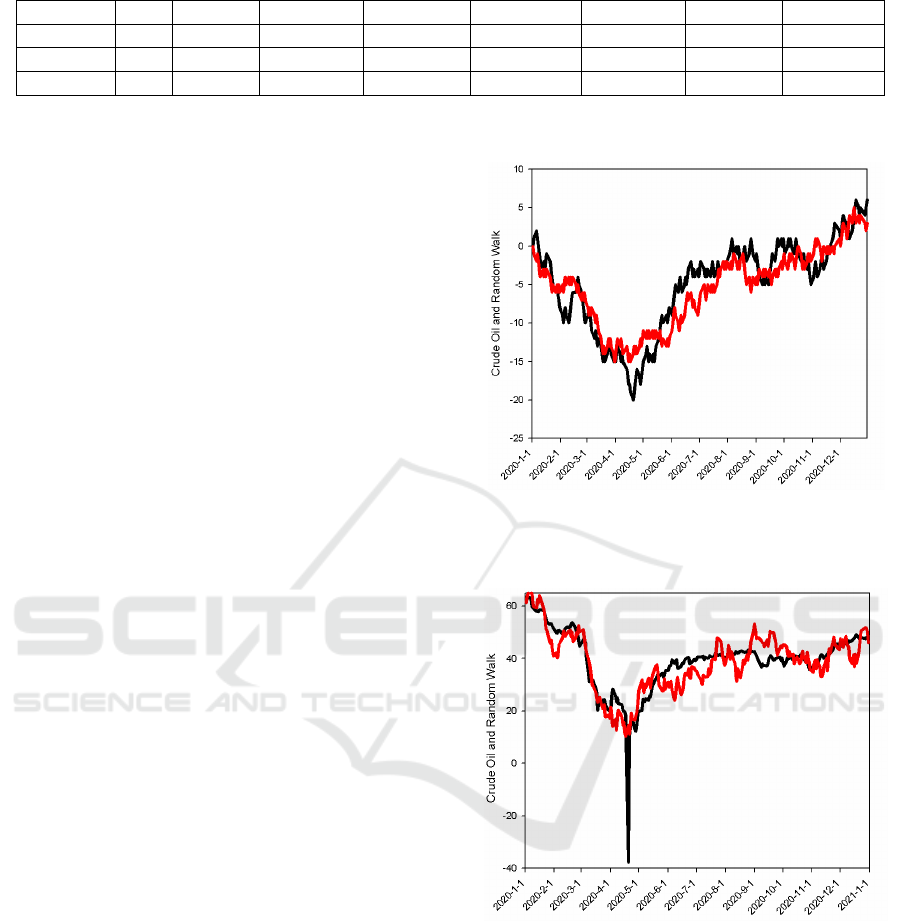
Figure 1 shows the comparison between the crude oil
close price and its random walk simulation in the 1/–
1 conformation for 2020. Because this conformation
answers the simple question of whether the crude oil
close price is higher or lower in comparison with that
in its preceding day, we can see that there are more
trading days, in which the close price is lower than
that in its preceding day before May 2020. Then there
are more trading days, in which the close price is
higher than that in its preceding day after May 2020,
and the trading days, in which the price may be one
higher or lower than that in the preceding day without
reasoning.
The unique difference between the crude oil price
and other stock indices such as S&P 500 (Yan, Wu,
2020), S&P/TSX (Yan, Wu, 2021), CAC40 (Yan,
Wu, 2021), DAX (Yan, Wu, 2021), KOSPI (Yan,
Wu, 2021), Nasdaq (Yan, Wu, 2021), Hang Seng
(Yan, Wu, 2021), Dow Jones (Yan
, Wu, 2021), and
NIKKEI 225 (Yan, Wu, 2021) is that the crude oil
price experienced a unheard and unprecedented fall
down to the negative territory, $ -37.63 on April 20,
2020. It is still hard and difficult to define or explain
or argue whether this is a random event, but it is
definitely different from all the shocks around the
world, and can be considered as highly irrational.
Figure 2 illustrates this awkward crude oil close
price with its random walk simulation in the decimal
conformation. Likely the random walk simulation can
follow the crude oil close price except for April 20,
2020.
The similar situation can also be observed in
Figure 3, where the unique negative territory fall
down cannot be simulated by the random walk. Based
upon our experience (Yan, Wu, 2020, Yan, Wu,
2021), the difficulty in simulation of this
unprecedented fall down came the command of
random number generator, which has four
parameters, number, seed and upper and lower
ranges. The upper and lower ranges always are hard
to define. Perhaps, we should change these two
parameters into random numbers, i.e. the random
number generator embraces the random number
generators in our future studies.
Figure 1: The crude oil close price in 2020 in 1/–1
conformation (black line) and its random walk simulation
(red line) using the seed of 4.33068.
Figure 2: The crude oil close price in 2020 (black line) and
its random walk simulation (red line) in the decimal
conformation using the seed of 6.16373.
Figure 4 tells the similar story as Figure 3, that is,
the random walk simulation satisfactorily fits the
pathway of crude oil close price. Even it is better than
the simulation in Figure 3, because the simulation
went down the negative valley to some degree.
Figures 5 and 6 reveal another interesting
phenomenon that is the surge of crude oil price in
2008, which researched to $ 145.18 on July 14, 2008.
To some extent, the curve of crude oil close price in
Figure 5 is symmetric with one peak up and one peak
Random Walk Simulation on Crude Oil Price for the First 20 Years in the 21st Century
571
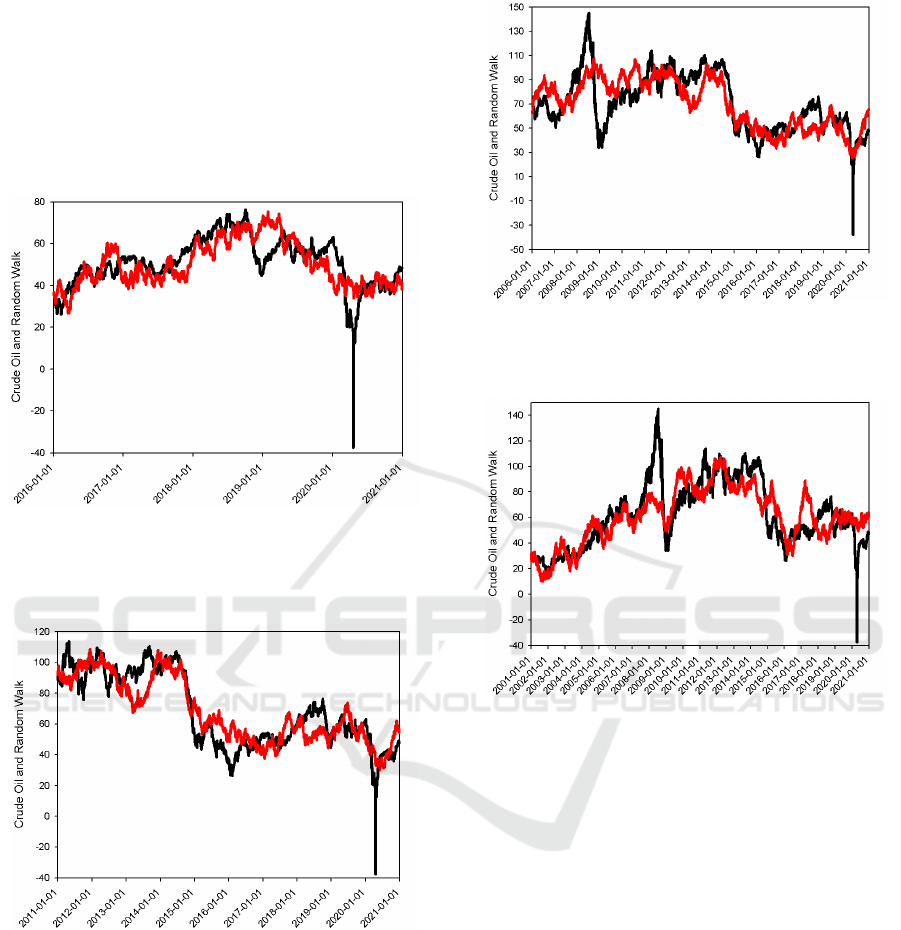
down. In such a case, the symmetry would render a
better simulation for the sake of upper and lower
ranges in random number generator command.
However, this is not the case. Therefore, the deeper
source for this incapable simulation requires further
investigations. In fact, it seems that only the random
walk simulation has the potential to mimic something
in negative territory.
Figure 3: The crude oil close price from 2016 to 2020 (black
line) and its random walk simulation (red line) in the
decimal conformation using any of fifteen seeds from
9.25671 to 9.25485 with increment of 1.
Figure 4: The crude oil close price from 2011 to 2020 (black
line) and its random walk simulation (red line) in the
decimal conformation using the seed of 2.03358.
Perhaps, what happened in Figure 5 becomes
more visible in Figure 6, where we could say that the
simulation ran through the general trend relatively
good, but was unable to rise or fall to any degree. This
indeed is a failure. However, this failure can be
balanced by the facts that other models fail to predict
these two outliers too.
Figure 5: The crude oil close price from 2006 to 2020 (black
line) and its random walk simulation (red line) in the
decimal conformation using the seed of 2.28541.
Figure 6: The crude oil close price from 2001 to 2020 (black
line) and its random walk simulation (red line) in the
decimal conformation using any of two seeds of 0.7239 and
1.42371.
In some sense, our approach is very more empiric
because there is no theoretical proof on whether the
random walk can be applicable to either stock market
or commodity although numerous studies have been
done using various statistical tests such as variance
ratio, unit root, and autocorrelation tests (Lo,
MacKinlay, 1988, Liu, He, 1991, Deo, Richardson,
2003). We lack progress and advance in theoretical
proof.
In our series of reports on random walk simulation
(Yan, Wu, 2020, Yan, Wu, 2021), .we have great
difficulty to unity the term used to describe 1/–1 and
decimal random walk, because the currently popular
software detecting plagiarism would give warning of
the same scientific term used in different reports.
Thus, we had to adopt different terminologies before
exhausting our vocabulary. We had used format,
pattern, form, configuration, conformation, etc., but
they are the same in essence. Nevertheless, we expect
BDEDM 2022 - The International Conference on Big Data Economy and Digital Management
572

to use other terms in our future reports although they
mean the same concept and definition.
4 CONCLUSIONS
In this report, we apply the random walk simulation
to the crude oil close price for the first 20 years in the
21st century, not only because of importance of crude
oil price, but also because of appearance of oil price
in the negative territory due to Covid-19 pandemic,
which was never seen in any stock indices. The
results being clearer than our previous reports (Yan,
Wu, 2020, Yan, Wu, 2021) demonstrate the
incapability to let the simulation to deal with sudden
fall and rise. However, he results do reveal that the
random walk has the potential to lead to the
simulation to follow any unprecedented event. The
results also suggest the possibility to use the random
number generator to embrace other random number
generators in software commands.
ACKNOWLEDGEMENTS
The authors express their thanks for the Scientific
Development Fund of Guangxi Academy of Sciences
(2021YFJ1203).
REFERENCES
Chen, Y., He, K. & G. K. F. Tso. (2017). Forecasting crude
oil prices: a deep learning based model. Precedia
Comput. Sci., 122, 300–307.
Deo, R. S. & M. Richardson. (2003) On the asymptotic
power of the variance ratio test. Econometric Theory
19, 231–239.
Feller, W. 1968. An introduction to probability theory and
its applications. John Wiley, New York, 3rd edition.
Liu, C.Y. & J. He. (1991) A variance ratio tests of random
walks in foreign exchange rates. J. Finan. 46, 773–785.
Lo, A. W. & A. C. MacKinlay. (1988) Stock market prices
do not follow random walks: Evidence from a simple
specification test. Rev. Finan. Studies 1, 41–66.
SPSS Inc., SigmaPlot 2002 for Windows Version 8.02.
(1986–2001).
Yahoo Finance (2021) https://de.finance.yahoo.com/.
Yan, S. & G. Wu. (2020) Fitting of impact of COVID-19
pandemic on S&P 500 Index using random walk.
Conference Publishing Services: ICEMME 4, 1007–
1011.
Yan, S. & G. Wu. (2021a). Simulation of Canadian
S&P/TSX composite index for the first 20 years in the
21
st
century with random walk model. Proceedings in
2021 International Conference on Data Mining and
Statistical Applications (DMSA 2021). Conference
Publishing Services: DMSA, 45–48.
Yan, S. & G. Wu. (2021b). Simulation of French CAC40
index for the first 20 years in the 21
st
century with
random walk model. Proceedings in 2021 International
Conference on Data Mining and Statistical
Applications (DMSA). Conference Publishing
Services: DMSA, 1092–1095.
Yan, S. & G. Wu. (2021c). Simulation of German DAX
index for the first 20 years in 21
st
century with random
walk model. Proceedings in the 2021 International
Conference on Cloud Computing, Big Data and Digital
Economy. Conference Publishing Services: ICCBD,
913–916.
Yan, S. & G. Wu. (2021d). Simulation of KOSPI index for
the first 20 years in the 21
st
century using random walk.
Proceedings in the 2nd International Conference on Big
Data and Social Sciences (ICBDSS 2021). Conference
Proceedings Services: ICBDSS, 866–870.
Yan, S. & G. Wu. (2021e) Simulation of NASDAQ
Composite Index for the first 20 years of the 21
st
century by means of random walk model. Proceedings
in the 2021 International Conference on Education,
Information Management and Service Science.
Conference Publishing Services: EIMSS, 454–457.
Yan, S. & G. Wu. (2021f) Fit Hang Seng index for 21
st
century with random walk model. Conference
Publication Series: CBFD 66–69.
Yan, S. & G. Wu. (2021g) Simulation of impact of COVID-
19 pandemic on Dow Jones index using random walk.
Proceedings in the 2nd International Conference on
Computing and Data Science (CONFCDS) 2021; 59–
64.
Yan, S. & G. Wu. (2021h) Simulation of NIKKEI 225
index for 21st century using random walk. 2021 2nd
International Conference on Big Data and
Informatization Education (ICBDIE) 330–333.
Zhu, D. M., Ching, W. K., Elliott, R. J., Siu, T. K. & L. M.
Zhang. (2017). Hidden markov models with threshold
effects and their applications to oil price forecasting. J
Indust. Manag. Optim., 13, 757–773.
Random Walk Simulation on Crude Oil Price for the First 20 Years in the 21st Century
573
