
SVAR Metrics Analysis for the Impact of Fintech on Rural
Economy Growth
Yu Duan
a
, Yuxin Liu
b
and Jinchuan Ke
c
School of Economics & Management, Beijing Jiaotong University, 100044, Beijing, China
Keywords: Fintech, SVAR, Impulse Function.
Abstract: The Fintech (financial technology) has the characteristics of low transaction costs, high transaction efficiency
and strong assistance. In the past decade, it has gradually become one of the main forms of Fintech. Based on
the background of the rapid development of Fintech, this article discusses the impact mechanism of Fintech
on rural economic development from the perspective of the development scale of internet third-party payment
and P2P network loans. The results of the research show that the impact of Fin-tech on the development of
the rural economy is weak in the short-term and strengthened in the long-term. The results of the impulse
response show that the positive changes in rural economic growth itself, third-party payments and P2P
network loans can significantly promote local economic development.
1 INTRODUCTION
Fintechs such as P2P and crowd funding platform
have injected new vitality into finance and related
industries from all aspects. It is not difficult to find
that the sudden emergence of Fintech (financial
technology) is significantly impacting the existing
profit model of traditional financial institutions. The
rural market is an indispensable part of the internet
economic system, and the development of Fintech
can greatly meet the innovation needs of its financial
service system. In addition, the innovative
characteristics of Fintech itself are compatible with
the ideas for the transformation and upgrading of my
country's rural economy, and can help the rural
economy move towards high efficiency and high
quality. Driven by innovation, the development mode
of "Internet + modern countryside" has become
commonplace. Financial institutions are actively
deploying rural areas. From the perspective of
econometrics, this article takes the entire rural
economic development as an explanatory variable,
and uses the SVAR model to empirically analyze the
relationship between Fintech and the rural economy.
a
https://orcid.org/0000-0001-7465-5323
b
https://orcid.org/0000-0003-0809-9685
c
https://orcid.org/0000-0001-6747-6968
2 LITERATURE REVIEW
In the context of global economic integration, the
economic ties between different regions and
industries are closer, and financial technology and its
service products are continuously integrated with the
real economy (Li 2015). Industry 4.0 is the fourth
industrial revolution, which is closely related to the
Internet of things (IOT), communication technology
(ICT) and enterprise architecture (EA). Therefore,
fintech has also developed rapidly with industry 4.0
(Lu 2017). In the era of industry 4.0, through fintech,
all forms of financial transactions not only make
faster, easier and more efficient, but also make a
positive contribution to improving public financial
services and help promote the economy in the digital
age (Mardiana 2020).
Many scholars have carried out detailed
interpretation and analysis of Fintech risk, and
successfully applied it to real economic development
research. For example, Ying (2016), Kai (2016) and
Xianyu (2018) believes that Fintech has developed
rapidly in recent years, but it needs to be strictly
regulated by the government. Ting (2017) believes
that the theory of rural finance still needs to be
Duan, Y., Liu, Y. and Ke, J.
SVAR Metrics Analysis for the Impact of Fintech on Rural Economy Growth.
DOI: 10.5220/0011188300003440
In Proceedings of the International Conference on Big Data Economy and Digital Management (BDEDM 2022), pages 497-502
ISBN: 978-989-758-593-7
Copyright
c
2022 by SCITEPRESS – Science and Technology Publications, Lda. All rights reserved
497

developed in depth, and that the government's timely
and appropriate intervention is particularly needed to
help traditional and new rural financial institutions
embark on the development path of inclusive finance.
The view point of Jianbing (2018) is that Fintech has
become a new vitality in rural economic development
from budding to vigorous development in just a few
years. Wenqi (2018) combed and summarized the
theory of rural finance, summarized and analyzed the
development process and current situation of rural
finance, constructed a panel model to study the
mechanism of rural financial development and
farmers’ income growth. Yongcang (2021) deeply
analyzed the evolution process and structural changes
of rural household income growth, the characteristic
facts and evolution trends of digital finance, and
constructed a theoretical framework for the influence
of digital finance on household income growth.
3 SVAR MODEL
The Vector Auto Regressive Model to study the
interaction between two or more variables is referred
to as VAR model. The VAR model is essentially a
multivariate data analysis method, which takes each
endogenous variable in the system as a function of the
lag value of all endogenous variables in the system.
Therefore, this model successfully extended the
univariate autoregressive model to the vector
autoregressive model composed of multiple time
series variables. If the VAR model is not based on
strict economic theory, the explanatory variables are
all lagged terms, and no parameter constraints are
imposed, then it can avoid identification problems
and endogenous explanatory variable problems, so it
is structural and non-restrictive, and is recorded as
SVAR. The important premise of the realization of
the VAR model is that the time series corresponding
to all variables are stable. Therefore, this paper uses
the ADF unit root test method to test the stationarity
of the selected time series and their difference terms.
Its basic form is as follows:
∆Y
=β
+γt+∅Y
+
∑
β
∆Y
+δ
(1)
Where, ∅=0, the original series is a non-
stationary series, and ∅<0, the original series is a
stationary series. The general mathematical formula
of the SVAR model is shown as follows, setting the
number of variables as N and the lag order as p, where
c is the n-dimensional constant column term, 𝜀
is
the n-dimensional error column vector, the
coefficient α is a matrix of N×N:
Y
=c+
α
Y
+
α
Y
+
α
Y
+⋯+
α
Y
+
ε
(2)
Where, Y
=(y
,
,y
,
,y
,
,⋯,y
,
) , c=
(c
,c
,c
,⋯,c
),
ε
~ΠN(0,Ω)
,
ε
=(ε
,
,ε
,
,ε
,
,⋯,ε
,
)
.
Π
=
π
,
⋯
π
,
⋮⋱⋮
π
,
…
π
,
, j=1,2,3,⋯,p
(3)
If the model meets the conditions: (1) The n*n-
dimensional matrix formed by the coefficient is not 0
and p>0; (2) The roots of the characteristic
equation fall outside the unit circle; (3) ε
are
independent of each other. At this time, ε
is an n-
dimensional white noise vector sequence, also called
an impact vector. Cov(ε
x
)=E(ε
x
)=0, (
j=1,2,3,⋯), that is, the lag period of x
, x
and ε
is not correlated.
In order to solve the problem of correlation
between the random error terms corresponding to
different equations, we usually use Cholesky
decomposition to attribute the relevant part to the
random disturbance term of the first variable in the
SVAR system. Processing in this way can make the
random error terms corresponding to different
equations irrelevant.
The SVAR model estimation method used in this
paper is OLS estimation, and the model parameter
matrix is:
A
=
a
,
⋯a
,
⋮⋱⋮
a
,
…a
,
,i=1,2,3,⋯,p (4)
Then find the OLS estimate of the model
parameter matrix A
,A
,⋯,A
, that is, find the
(A
,
A
,
⋯,A
) that makes the following formula
obtain the minimum value:
Q=
∑
y
−
∑
A
y
y
−
∑
A
y
(5)
For the order determination, this article uses the
AIC and SC information criteria, also called the
minimum information criterion, to determine the lag
order of the SVAR model:
AIC=−2l/T+2n/T,SC=−2l/T+nlnT/T
(6)
Where, l=−
(1 + ln2π) −
lnΣ
, n is the
number of parameters that the model needs
to estimate,
n=pN
. The minimum information criterion is to
take p=1,2,3... for AIC or SC respectively. When AIC
or SC=min, the corresponding p is the appropriate
order of the model, and the corresponding
A
1
,
A
2
,
⋯,A
P
is the best model parameter estimation.
After establishing the SVAR model, we need to
make a judgment on the stability of the SVAR model,
based on the value of the characteristic root. Calculate
the value of the characteristic root and compare the
absolute value of its reciprocal with 1. If the absolute
BDEDM 2022 - The International Conference on Big Data Economy and Digital Management
498

value of all the reciprocal of the characteristic root is
less than 1, it means that the SVAR model is stable.
If the absolute value of the reciprocal of the
characteristic root is greater than 1, it means that the
SVAR model is unstable. The stationary SVAR
model can be written as a vector moving average
model, denoted as VMA:
y
=μ+
∑
A
ε
(7)
Where, μ is the p×1 dimensional vector of the
mean value of y
t
, and A
i
represents the impulse
response matrix, which shows the response of the
variable to short-term impacts of other variables, and
can reflect the dynamic interaction characteristics
between the variables. For the impulse response, the
cumulative response function caused by the pulse of
y
j
is
∑
d
ij
(q)
∞
q=0
, among them, d
ij
(q)
is the element in
the i-th and j-th columns of A
q
(
q=0,1,2,3, ⋯
)
.
The matrix can be expressed as: A
=
∂y
∂v
⁄
, that is, the element in the i-th row and j-
th column of A
is equal to the j-th variable
perturbation term in the period t plus one unit. When
the disturbance term in other periods is constant, the
influence on the value of the i-th variable in the period
t+q.
In addition, based on the estimation of the SVAR
model, this paper further introduces Granger
causality test to clarify whether the correlation
between the variables we obtained is meaningful. The
Granger causality test is aimed at estimating the
following regressions in the time series:
y
t
=
∑
a
i
x
t−i
q
i=1
+
∑
b
j
y
t−j
q
j=1
+u
1t
(8)
x
=
∑
φ
x
+
∑
ω
y
+u
(9)
Among them, u
and u
are white noise. It is
assumed that y is related to itself and the past value
of x, and x is related to itself and the past value of y.
4 EMPERICAL ANALYSIS
4.1 Data Processing
This paper selects rural GDP as an indicator to
measure rural economic development and analyzes it
as an explanatory variable. In terms of Fintech, this
paper selects representative third-party payment scale
and P2P network loan transaction volume as
independent variables. This article selects the 2012-
2020 quarterly data for analysis. Due to the
exponential trend and heteroscedasticity that may
exist in the data, logarithmic processing is adopted for
the transformed data. After processing, the
corresponding symbols of the variables are:
LNGDP (Rural economic growth), LNPAY (Third-
party payment LNPAY), LNP2P (P2P network loan
LNP2P).
4.2 Staionarity Test of Variables
The stationarity of the time series can effectively
prevent the emergence of pseudo-regression models.
In this paper, the ADF unit root test method is used to
test the stationarity of the selected variables after
logarithmization of the time series data. The results
show that LNGDP, LNPAY, and LNP2P are all first-
order single integers at the 5% confidence level,
which meets the conditions for establishing the VAR
model. The stationarity test results are shown in Table
1.
Table 1: Unit root test results.
Variable t-Statistic Prob
LNGDP -26.5 0.0001
LNPAY -4.47 0.0004
LNP2P -3.37 0.0346
4.3 Lag Order Selection
The degree of freedom of the variables in the SVAR
model depends on the choice of the variable lag order.
The larger the lag order, the more complete the
dynamic relationship between the variables shown by
the model, but the increase in the variable lag order
will also cause the overall degree of freedom of the
model to decrease. Next, this article selects a more
appropriate lag order based on the model design and
selection of AIC and SC information criteria.
Through software analysis, it is found in Table 2
that the AIC value and SC value are the smallest when
the lag order is 5, so the optimal lag order is 5.
Table 2: Lag order performance.
Lag order AIC value SC value
Level 2 -2.94 -2.66
Level 3 -2.62 -2.37
Level 4 -3.67 -3.46
Level 5 -6.03 -5.88
However, when the lag order is 4 or 5 in the
characteristic root test result, there are points outside
the unit circle, and when the lag order is 3, as shown
in Figure 1, all points fall within the unit circle.
SVAR Metrics Analysis for the Impact of Fintech on Rural Economy Growth
499
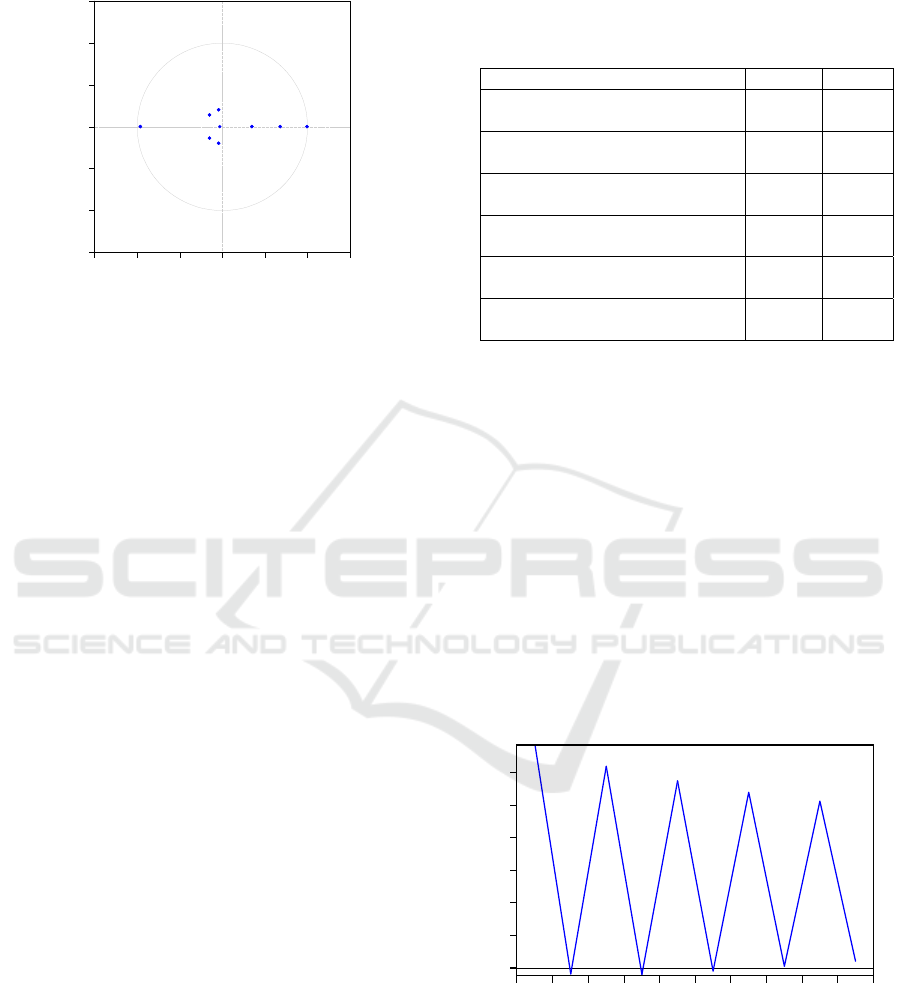
Therefore, the final reasonable lag order selected is 3,
and the VAR model we build is stable at this time.
-1.5
-1.0
-0.5
0.0
0.5
1.0
1.5
-1.5 -1.0 -0.5 0.0 0.5 1.0 1.5
Figure 1: Roots of AR characteristic polynomials.
4.4 Granger Causality Test
After determining the lag order, the SVAR (3) model
parameter estimation results are as follows.
LNGDP=0.9168∗LNGDP
(
−1
)
+0.936∗LNGDP
(
−2
)
+0.6046∗LNGDP
(
−3
)
+0.0204∗LNP2P
(
−1
)
+0.006∗LNP2P
(
−2
)
+0.0638∗LNP2P
(
−3
)
+0.01259∗LNPAY
(
−1
)
+0.0018∗LNPAY
(
−2
)
+ 0.0291∗LNPAY(−3)+8.579
From the estimation results, rural economic
growth is greatly affected by its own lagging items,
but the lagging coefficients of third-party payment
and P2P network loans are still positive. Therefore,
the lagging items of third-party payment and P2P
network loans are still affected by the level of
economic growth has a positive impact. The
development of Fintech has a positive impact on rural
economic growth. In addition, from the perspective
of the change trend of the coefficient of the lagging
term, the coefficients of third-party payment and P2P
network loans in the lagging three phases are slightly
higher than those of the lagging phases one and two.
The impact of growth has a time lag, and its positive
effects will gradually appear and increase over time.
Aiming at the established SVAR model, this paper
uses Granger Causality/Block Exogeneity Wald Tests
to test the causality between variables to clarify
whether the correlation between variables is
meaningful, and analyze third-party payment, P2P
network loans and rural economy.
Table 3 shows the results of the Granger causality
test, at a significance level of 10%, "third-party
payment is not the Granger reason for rural economic
development" and "P2P network loans are not the
Granger reason for rural economic development"
hypothesis rejected, that is to say, the development of
Fintech has a significant role in promoting the
transformation and upgrading of the rural economy,
while the back-feeding effect of rural economic
development on Fintech is not significant.
Table 3: Granger causality test results
Null H
yp
othesis F-Statist. Prob
LNPAY does not Granger
cause LNGDP
23.894 0.0007
LNGDP does not Granger
cause LNPAY
0.6944 0.5308
LNP2P does not Granger
cause LNGDP
3.8763 0.0736
LNGDP does not Granger
cause LNP2P
0.3628 0.7081
LNP2P does not Granger
cause LNPAY
0.8465 0.4686
LNPAY does not Granger
cause LNP2P
1.8084 0.2327
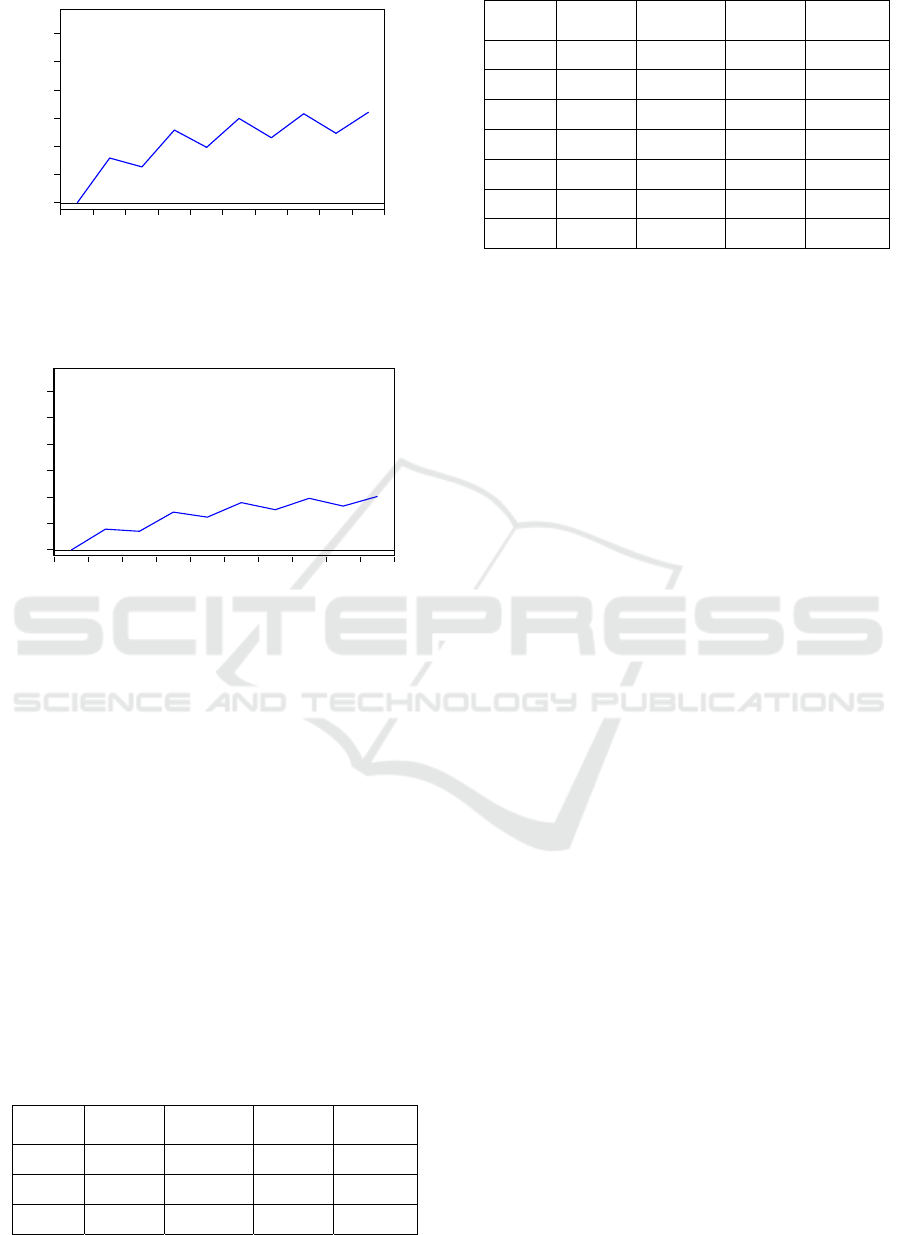
4.5 Impulse Response Analysis
Through the impulse response function of the SVAR
model, the time path of the response function of each
variable in the model can be analyzed. Figure 2 shows
the economic growth impulse response function.
Figure 3 shows the impact of P2P network loans on
rural economic growth.
From the impulse response results in Figure 2,
Figure 3, and Figure 4, it can be seen that rural
economic growth responds to its own disturbances or
shocks to a greater extent, while third-party payment
and P2P network loans have less impact on the
changes in rural economic growth. But from the result
point of view, the solid line is above the axis, so the
effects of the variables are in the same direction.
.00
.01
.02
.03
.04
.05
.06
1 2 3 4 5 6 7 8 9 10
Figure 2: Economic growth impulse response function.
(LNGDP to LNGDP)
BDEDM 2022 - The International Conference on Big Data Economy and Digital Management
500
.00
.01
.02
.03
.04
.05
.06
1 2 3 4 5 6 7 8 9 10
Figure 3: Economic growth impulse response function.
(LNGDP to LNP2P)
The impact of third-party payment on the growth
rate of the rural economy is shown in Figure 4.
.00
.01
.02
.03
.04
.05
.06
1 2 3 4 5 6 7 8 9 10
Figure 4: Economic growth impulse response function.
(LNGDP to LNPAY)
Third-party payment and P2P network loans can
promote rural economic development. In addition,
the first-phase response value of the impulse response
results of third-party payment, P2P network loans and
rural economic growth is 0, which shows that the
impact of third-party payment and P2P network loans
on rural economic development is lagging. This is
because Fintech to inject capital or provide financial
services for the development of rural related
industries does not have immediate effect. It needs to
go through production, market and other links to
gradually emerge. As time goes by, the response
value shows a gradual upward trend, which shows
that from a long-term perspective, The development
of rural Fintech has a significant positive effect. The
variance analysis can be seen in Table 4.
Table 4: Variance analysis results.
Period S.E. LNGDP LNP2P LNPAY
1 0.04799 100.0000 0.00000 0.00000
2 0.06098 74.0808 3.31968 22.5994
3 0.06558 71.2910 8.54267 20.1662
Period S.E. LNGDP LNP2P LNPAY
4 0.08073 51.2922 8.04840 40.6593
5 0.08526 55.2787 8.25947 36.4617
6 0.09907 41.3591 9.94682 48.6940
7 0.10433 47.0140 8.99896 43.9870
8 0.11634 37.8143 11.6640 50.5216
9 0.12204 43.3885 10.6797 45.9317
10 0.13145 37.5307 13.6003 48.8689
The results show that the third-party Internet
payment has the highest contribution rate to the rural
economic development. In the long-term
development process, the contribution to the rural
economy reaches 48.87%. Followed by P2P network
loans, in the long-term development process, the
contribution to rural economic development reached
13.6%. The influence of rural economic development
on itself has gradually weakened over time, while the
influence of third-party Internet payment and P2P
network loans on rural economic development has
gradually increased, which further proves that the
impact of Fintech on rural economic growth has a
time-lag conclusion.
5 CONCLUSIONS
In this study, the results that the scale of third-party
payment and whether P2P network loans have played
a positive role in rural economic development, and
the degree of this influence changes in a dynamic
environment. The results of Granger causality test
show that third-party payment and P2P network loans
have a significant role in promoting rural economic
development, while the back-feeding effect of rural
economic development on financial innovation is not
significant.
According to the results of impulse response, the
positive changes of rural economic growth itself,
third-party payment and P2P network loans can
obviously promote rural economic development, but
the promotion of rural economic growth by third-
party payment and P2P network loans has a time lag.
The results of variance decomposition also show that
third-party Internet payment has the highest
contribution rate to rural economic development.
We also find that financial innovation cannot play
a significant role in promoting in the short term, so it
is imperative to improve the construction of
information network in rural areas and service quality
of science such as e-commerce in the long term.
SVAR Metrics Analysis for the Impact of Fintech on Rural Economy Growth
501

REFERENCES
Jianbing, L. (2018). Research on rural economic
development under the background of financial
innovation. Natl Circu. Econ. 31, 84-86.
Kai, W. (2016). Research on the status quo, problems and
countermeasures of financial innovation in promoting
rural development in taizhou city. Times Financ. 30,
58-60.
Li, J. (2015). Thoughts on Internet Finance. Manag. World.
07, 1-7.
Lu, Y. (2017). Industry 4.0: A Survey on Technologies,
Applications and Open Research Issues. J. Ind. Inf.
Integrat. 6, 1-10.
Mardiana, S.L., 2020. Faridatul, T., Mardiyana, L.O. The
contribution of Financial Technology in Increasing
Society's Financial Inclusions in the Industrial Era 4.0.
Proc. 2nd Intl. Conf. Env. Geo. Edu. (ICEGE). IPO
Publishing Ltd.
Ting T., 2017. Research on the operation mechanism of
rural inclusive finance. Dissertation, nanjing forest.
univ.
Wenqi X., 2018. Development of rural finance in China.
Dissertation, Tianjin Univ. Financ. & Econ.
Xianyu X. (2018). Analysis of the impact of financial
innovation on economic development. Chin. Bus.
Forum. 28, 42-44.
Ying Z. (2016). The impact of the new round of financial
innovation reform on the rural economy. Econ. Res.
Ref. 64, 73-76.
Yongcang, W., 2021. Digital finance and farmers’ income
growth. Dissertation, S. Univ.
BDEDM 2022 - The International Conference on Big Data Economy and Digital Management
502
