
Stock Market Analysis and Stock Prices Prediction with Long
Short-term Model
Hang Yu
a
Queen’s University Belfast, BT7 1NN, Belfast, U.K.
Keywords: Stock Market, Finance, Pandas, Data Visualization, Long Short-Term Memory.
Abstract: The Stock Market Analysis and Prediction project uses Yahoo Finance data to investigate and anticipate stock
market volatility using technical analysis, visualization, and forecasting. Analyzed a stock's risk based on its
prior performance history by using pandas to gather stock information and then visualizing it in a variety of
ways. With the use of data visualization, we want to get a deeper knowledge of the stock market data in order
to create predictions about future stock performance and risk value for specific stocks as part of this project.
Statistical analysis and data mining are part of the project. NumPy, Pandas, and Data Visualization Libraries
are all heavily used in this project. Long short-term memory was used to make predictions about future stock
values. With historical data, the long short-term memory approach was able to forecast properly, with a mean
square error of roughly 3. Pre-training models of long-term memory were used to predict the validation data.
1 INTRODUCTION
Millions of dollars are exchanged every day, and
behind each dollar is an investor seeking to make a
profit (Ince, 2000). Corporate fortunes fluctuate on a
daily basis depending on market conditions and
sentiment. There is a tempting promise of money and
power if an investor can precisely forecast market
moves. When the stock market goes haywire, it is no
surprise that the public's attention is drawn to the
market's problems. A greater grasp of stock market
forecasting might be useful in the event of similar
occurrences in the future (Gers, et al, 2002).
Exchanging the stocks on money markets is one
of the significant speculation exercises. Already,
scientists developed different stock examination
system that could empower them to envision the
bearings of stock esteem development. Predicting and
foreseeing of significant worth future cost, in
perspective of the present cash related information
and news, is of colossal use to the financial pros
(Akita, et al, 2016). Financial masters need to know
whether some stock will get higher or lower over
particular time-period. To obtain the accurate output,
the approach used is to implemented is machine
learning along with supervised learning algorithms.
a
https://orcid.org/0000-0002-0679-7239
Results are tested using different types of supervised
learning algorithms with a different set of a features
(Siew, et al, 2012).
This paper is mainly about the analysis of short-
term stock prices, seeking stock market data,
especially some technology stocks. In this article,
four technology stocks are selected for analysis,
including Amazon, Apple, Microsoft and Google. On
the premise of solving the changes in stock prices
over time and the moving averages of various stocks,
we then use python Use machine learning models to
predict short-term stocks on historical data. We will
learn how to use Pandas to obtain stock information
and visualize different aspects of it. Finally, this
article will use the long and short-term memory
(LSTM) method to predict future stock prices by
studying the previous performance history of stocks.
2 METHODOLOGY
2.1 LSTM Introduction
The output of a Long short-term memory (LSTM)
variant of Recurrent Neural Network (RNN) does not
fade or burst as it cycles through the feedback loops
466
Yu, H.
Stock Market Analysis and Stock Prices Prediction with Long Short-term Model.
DOI: 10.5220/0011186200003440
In Proceedings of the International Conference on Big Data Economy and Digital Management (BDEDM 2022), pages 466-470
ISBN: 978-989-758-593-7
Copyright
c
2022 by SCITEPRESS – Science and Technology Publications, Lda. All rights reserved

(Sak, et al, 2014). As a result, recurrent neural
networks are better at identifying patterns. Because
they do not suffer from the vanishing gradient
problem, long short-term memory networks are more
suited to sequence learning tasks than other RNN
architectures (Mali, et al, 2017).
2.2 Data Selection
This section will go over how to handle requesting
stock information with pandas, and how to analyze
basic attributes of a stock. For reading stock data from
yahoo, this research uses DataReader to get the yahoo
finance data. In order to better understand the
situation of these four stocks and build a better model,
we calculated the moving average values of various
stocks on the basis of these data, paving the way for
our following calculation.
2.2.1 What Was the Moving Average of the
Various Stocks?
This section is now going to analyze the risk of the
stock. In order to do so, it needs to take a closer look
at the daily changes of the stock, and not just its
absolute value. This paper will use pandas to retrieve
the daily returns for the Apple stock, and use
pct_change to find the percent change for each day
(Li, et al, 2016).
Figure 1: Change curve of the stock difference of each company.
Figure 1 shows the change curve of the stock
difference of each company. It can be seen from the
graph that the daily difference of APPLE, GOOGLE,
MICROSOFT companies have obvious positive and
negative fluctuations, while the stock fluctuations of
AMAZON are all positive. Value fluctuates. From the
analysis in 2.2.1 section, although AMAZON’s stock
fluctuates throughout the year and has no obvious
upward trend, its daily spread is greater than 0.
Therefore, AMAZON’s stock returns will be the best
among the four companies.
2.3 Clean Data
This paper uses 95% of the data as the training set and
the rest as the test set. According to the above code,
the number of lines of the training model is 2387.
Through the MinMaxScaler method in the sklearn
module, the features are normalized, and the
processing results are as follows:
2.4 Exploratory Data Analysis
The Figure 2 shows the trend of AAPL’s stock price
change. The time is from 2021 to 2022. It can be seen
from the figure that APPLE’s stock price is on the
rise.
The rise in 2012-2019 is relatively slow. After
Stock Market Analysis and Stock Prices Prediction with Long Short-term Model
467
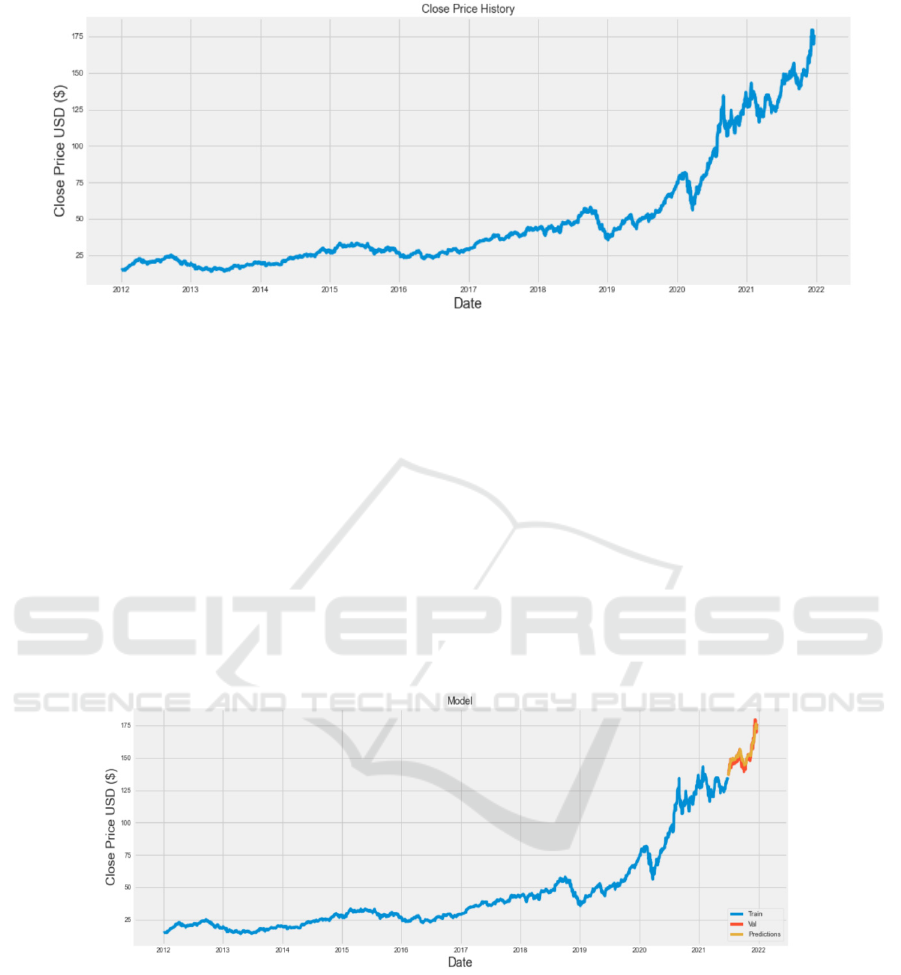
Figure 2: The trend of AAPL’s stock price change.
2019, the price rise is very high. Quickly, with small
fluctuations.
2.5 Model Building
A two-layer LSTM with a network structure of fully
connected layers on both sides will be used. Among
them, the number of neurons in the first layer of
LSTM is 128, the number of neurons in the second
layer of LSTM is 64, the number of neurons in the
first fully connected layer is 25, and the number of
neurons in the second fully connected layer is 25. The
number of neurons is one. The gradient descent
optimizer uses the adam algorithm, and the loss is
represented by the mean square error. The number of
iteration steps is 1. After the above code calculation
that after one round of iteration, the model has
converged very well, with a loss of 0.0013.
2.6 Evaluate Model
The error results of the LSTM model obtained
through 3.5 training on the test. According to the
calculation of the code program, the error of the
trained model on the test set is about 3.3.
Figure 3: The distribution of the true value and the predicted value.
It can be seen from the figure 3 that the predicted
value of the model is basically consistent with the true
value, indicating that the training effect of the model
is better.
3 DISCUSSION
In most cases, investments are made on the basis of
forecasts derived from previous stock price data after
taking into account all relevant variables. The Long
short-term memory (LSTM) can properly forecast
whether stocks rise or fall, and the findings suggest
that the LSTM can predict future states better than
BDEDM 2022 - The International Conference on Big Data Economy and Digital Management
468

current ones. For example, the classifier may be
trained on a wider range of organizations rather than
just one. An improved classifier that can be used to
categorize equities from a variety of different firms
will be created as a consequence. A news headline's
certainty of feeling may also be improved. As a
consequence, the classifier will be able to provide
even better results.
An LSTM model's fundamental weakness is that
it relies largely on stepwise forecasts to anticipate a
time series. We showed in our example that we could
forecast the number of passengers flying at time t by
using the five prior data that we had. With an LSTM,
long-term forecasting may not work. The amount of
the data is also a concern. Like any other neural
network, an LSTM has to be trained on a huge
quantity of data (Lu, et al, 2019). In spite of this, the
RMSE as calculated throughout the test data was still
not too high.
In the next few years, ResNet appeared. ResNet is
a residual network, which means to train a deeper
model. In 2016, a team of researchers from Microsoft
Asia Research Institute used an amazing 152-layer
deep residual networks in the ImageNet Image
Recognition Challenge to obtain all three major
projects of image classification, image positioning,
and image detection with absolute advantage (Liu, et
al, 2018). After that, the Attention model appeared.
All large technology companies have replaced LSTM
and its variants with attention-based models. Because
LSTM requires more resources to train and run than
attention-based models (Zhu, et al, 2019).
4 CONCLUSIONS
In today's world, stock market forecasting has
become a major concern. In most cases, investments
are made on the basis of forecasts derived from
previous stock price data after taking into account all
relevant variables. This study's findings demonstrate
that the LSTM is superior to current models in
predicting future state variables. There's still a lot of
room for experimentation. For example, the classifier
may be trained on a wider range of organizations
rather than just one. An improved classifier that can
be used to categorize equities from a variety of
different firms will be created as a consequence. This
might aid in further refining the classifier to get more
precise results. With the use of data visualization, we
want to get a deeper understanding of this data so that
we can generate more accurate forecasts regarding
stock performance and risk value for specific stocks
as part of this project. This project makes extensive
use of the NumPy, Pandas, and Data Visualization
libraries. Long short-term memory was used to make
predictions about future stock values. It is feasible to
forecast stock market movements using
previous data,
as shown by the findings, where the Long short-term
memory approach was able to properly predict using
the historical data and the mean square error on the
test data is about 3. As seen in the picture, the model's
projected value is almost exactly in line with the real
value, demonstrating that it has a better training
impact than previously thought.
ACKNOWLEDGEMENTS
First of all, I am honored to participate in this research
project of Financial Analysis & The Capital Asset
Pricing Model. I also like professor Honigsber's
teaching style. Thank you very much for your patient
explanation and help during this period. After that, I
am very grateful to my teacher Alan in university for
teaching me to write models in Python language.
REFERENCES
Akita, Ryo, et al. (2016). Deep learning for stock prediction
using numerical and textual information. IEEE/ACIS
15th International Conference on Computer and
Information Science (ICIS).
Gers, Felix A., Nicol N. Schraudolph, and Jürgen
Schmidhuber. (2002). Learning precise timing with
LSTM recurrent networks. Journal of Machine
Learning Research 3, August, pp. 115-143.
Ince, H. (2000). Support Vector Machine for Regression
and Applications to Financial Forecasting, Ieee-Inns-
Enns International Joint Conference on Neural
Networks IEEE Computer Society, vol6, pp. 348-353.
Li, P. C. Jing, Liang, T. Liu, M. Chen, Z. and Guo, L.
(2016). Autoregressive moving average modeling in the
financial sector, ICITACEE 2015 - 2nd Int. Conf. Inf.
Technol. Comput. Electr. Eng. Green Technol.
Strength. Inf. Technol. Electr. Comput. Eng.
Implementation, Proc., no. 4, pp. 68-71.
Liu, P., Hong, Y. and Liu, Y. (2018). Multi-Branch Deep
Residual Network for Single Image Super-
Resolution. Algorithms, 11(10), p.144.
Lu, N., Wu, Y., Feng, L. and Song, J. (2019). Deep
Learning for Fall Detection: Three-Dimensional CNN
Combined with LSTM on Video Kinematic Data. IEEE
Journal of Biomedical and Health Informatics, 23(1),
pp.314-323.
Mali, M. P. Karchalkar, Jain, H. A. A. Singh, and V.
Kumar. (2017). Open Price Prediction of Stock Market
using Regression Analysis, Ijarcce, vol. 6, no. 5, pp.
418-421.
Stock Market Analysis and Stock Prices Prediction with Long Short-term Model
469

Sak, Ha, sim, Andrew Senior, and Françoise Beaufays.
(2014). Long short-term memory recurrent neural
network architectures for large scale acoustic modeling.
Fifteenth annual conference of the international speech
communication association.
Siew H. L. and Nordin, M. J. (2012). Regression techniques
for the prediction of stock price trend, ICSSBE 2012 -
Proceedings, 2012 Int. Conf. Stat. Sci. Bus. Eng.
Empowering Decis. Mak. with Stat. Sci., pp. 99-103.
Zhu, Y., Zhang, W., Chen, Y. and Gao, H. (2019). A novel
approach to workload prediction using attention-based
LSTM encoder-decoder network in cloud
environment. EURASIP Journal on Wireless
Communications & Networking, (1), pp.1-18.
BDEDM 2022 - The International Conference on Big Data Economy and Digital Management
470
