
Research on the Index System of Cities’ Digital Economy
Development Level in the Yellow River Basin
Jie Ren and Yifan Lv
Inner Mongolia University of Science & Technology, Baotou, Inner Mongolia Autonomous Region, China
Keywords: The Yellow River Basin, Digital Economy, Index Measurement, Entropy-TOPSIS Method.
Abstract: By constructing the index system of urban digital economy development, using entropy-TOPSIS method, and
combining China Urban Digital Economy Index and China City Statistical Yearbook from 2020 to 2021, this
paper makes index construction and empirical analysis of 22 key cities in the Yellow River Basin, and
compares and analyzes with the national development from data information infrastructure, digital
government and digital society, digital economy and digital industry. The results of the study show that the
overall scores of cities in the Yellow River Basin are higher than the national average in digital information
base, digital policy planning, government service digitalization and industrial digitalization. However, in
terms of data foundation, government governance digitalization and digital industrialization, it is lower than
the national average, indicating that the growth rate of digital economy in the Yellow River Basin is good,
but the development is uneven. The overall level of digital economy development is evaluated by entropy-
TOPSIS method and the results show that ten cities are star-level, five mediocre-level and seven backward-
level. Thus, it is necessary to promote the balanced and high-quality development of the region through
adjustment of economic policies in the Yellow River Basin.
1 INTRODUCTION
General Secretary Xi Jinping pointed out that “digital
economy is the future direction of global
development, and innovation is the wing of the Asia-
Pacific economy”. The world is entering a period of
rapid development in digital economy. New
technologies, new business models and new
platforms such as 5G, artificial intelligence and smart
cities are flourishing, profoundly affecting global
scientific and technological innovation, industrial
restructuring as well as economic and social
development. During the period of the 14
th
Five-Year
Plan, China is actively promoting digital
industrialization and industrial digitalization, and
promoting the deep integration of digital technology
with economic and social development. As a result,
the new generation of communication technologies
represented by informatization, digitization and
intelligence have driven the digital transformation of
cities into an accelerated exploration period. Specific
governance practices continue to explore and update
the path and methods of digital technology
applications to integrate resources to promote the
modernization of governance system and capacity,
forming a good situation in which digital technology
drives all-round digital transformation of cities.
However, the gap between the North and the
South is widening in that situation, and with the high-
quality development of the Yellow River Basin
during the 14
th
Five-Year Plan period, it has become
a major agenda for regional coordinated
development. The development level of urban digital
economy in the Yellow River Basin and whether it
can drive regional high-quality development with
digital economy have become important issues that
need to be resolved urgently in the new period.
According to domestic research, scholars focused on
the Yellow River Basin from ecological governance
(Wang, 2020, Shen, 2020), industrial development
(Chen, 2021, Tian, 2021), watershed governance
(Liao, 2021, Du, 2021)
and other issues. Although
(Zhou, et al., 2020) had carried out a logical
construction of digital economy development in the
Yellow River Basin through macro, meso and micro
levels, (Wang, 2021) had explored the ecological
protection and high-quality development of the
Yellow River Basin through digital technology
applications. On the whole, the measurement
research on urban digital economy development of
432
Ren, J. and Lv, Y.
Research on the Index System of Cities’ Digital Economy Development Level in the Yellow River Basin.
DOI: 10.5220/0011183400003440
In Proceedings of the International Conference on Big Data Economy and Digital Management (BDEDM 2022), pages 432-440
ISBN: 978-989-758-593-7
Copyright
c
2022 by SCITEPRESS – Science and Technology Publications, Lda. All rights reserved

cities in the Yellow River Basin still needs further
attention.
This paper analyzes the comprehensive level of
digital economic development in 22 key cities in the
Yellow River Basin by combining the indicator
construction and empirical analysis of China Urban
Digital Economy Index from 2020 to 2021 (the actual
statistical data is 2019 to 2020) and China City
Statistical Yearbook, and comparing and analyzing
the data information infrastructure, digital
government and digital social governance, digital
economy and digital industry with the national
average level of development respectively. The index
is designed to provide policy suggestions for
accelerating the growth of digital economy and
promoting high-quality development of the Yellow
River Basin.
2 MODELING METHOD AND
INDEX CONSTRUCTION
2.1 Measurement Methods
In this paper, the entropy-TOPSIS method is used to
measure the development level of urban digital
economy in the Yellow River basin. The core idea is
to use the entropy method to assign weight to each
indicator on the basis of standardization, and then
quantify and sort the relative distance between the
evaluation object and the optimal and worst scheme
by TOPSIS. This method combines the objective
advantages of the entropy method with the advantages
of easy calculation and reasonable results of TOPSIS
method. Its specific calculation steps are as follows:
First, in order to avoid the influence of
dimensional differences such as unit and quantity
among the original data on the data results, all the
original data are standardized and converted into
relative values to make the data comparable. Since
there is no negative indicator in this index system,
only positive indicator standardization can be carried
out. To avoid the influence of extreme data on the
results of entropy method, we refer to the
standardized formula of (Yin, et al. 2017):
y
=
∗ 0.9 + 0.1 (1)
Where
ij
x
is the value
()
mjni ,,,, 21;21 ==
of the j-th indicator j for the i-th unit and
j
xmax
is the
maximum value of j, and
j
xmin
is the minimum value
of the j-th indicator.
The second step is to calculate the proportion of
the i-th data under the j-th indicator to the indicator:
=
=
n
i
ijijij
yyp
1
/
(2)
The third step is to calculate the entropy value of
the j-th indicator:
ij
n
i
ijj
lnppke
=
−=
1
(3)
Where
)ln(/1 rnk =
,
r
is the year and
n
is
the number of cities.
The fourth step is to calculate the information
entropy redundancy:
jj
ed −= 1
(4)
The fifth step is to calculate the weight of the j-th
indicator:
=
=
m
i
jjj
ddw
1
/
(5)
The sixth step is to calculate the weighting matrix
of the indicators measuring the development level of
the digital economy:
mnij
rR
×
= )(
(6)
The seventh step is to determine the optimal
solution Q
and the worst solution Q
based on the
weighting matrix:
=
−−
=
++
−=
−=
m
j
ijji
m
j
ijji
rQd
rQd
1
2
1
2
)(
)(
(7)
The eighth step is to calculate the relative
proximity Ci between each measure scheme and the
ideal scheme:
−+
−
+
=
ii
i
i
dd
d
C
(8)
Where the relative proximity Ci lies between 0
and 1. The larger the value of Ci, the better the
development level of digital economy in the city i. On
the contrary, the development level of digital
economy in city i is poor.
Research on the Index System of Cities’ Digital Economy Development Level in the Yellow River Basin
433
2.2 Establishing Index System
Creating a regional economic center city and building
a regional digital highland are the strategic priorities
of Baotou’s economic and social development during
the 14th Five-Year Plan period. Digital economy,
digital government and digital society led by digital
technology have become the main direction of
accelerated urban development. In terms of the
development trend of digital transformation,
indicators based on digital information infrastructure,
digital government, digital society and digital
industry can effectively measure the basic situation
and development direction of urban digital
transformation. This paper investigates 8 provinces in
the Yellow River Basin. Because of the severe lack
of urban measurement indicator data in some
provinces, this paper finally selects 22 key cities in
the Yellow River Basin for measurement.
Considering the data availability and reliability, the
research is based on the relevant data of China Urban
Digital Economy Index (the actual statistical data is
2019 to 2020) and China City Statistical Yearbook
from 2020 to 2021. The index system of digital
transformation of 22 key cities in the Yellow River
Basin is constructed through the three dimensions of
digital infrastructure, digital government, digital
society and digital industry. Tertiary indicators are
constructed around digital information base, data
foundation, digital policy planning, government
service digitalization, government governance
digitalization, digital industrialization and industrial
digitalization. The entropy method is used to measure
the weight and evaluate the overall situation of digital
transformation and development of 22 key cities in
the Yellow River Basin, and compare it with the
national average level of digital development, as
shown in Table 1.
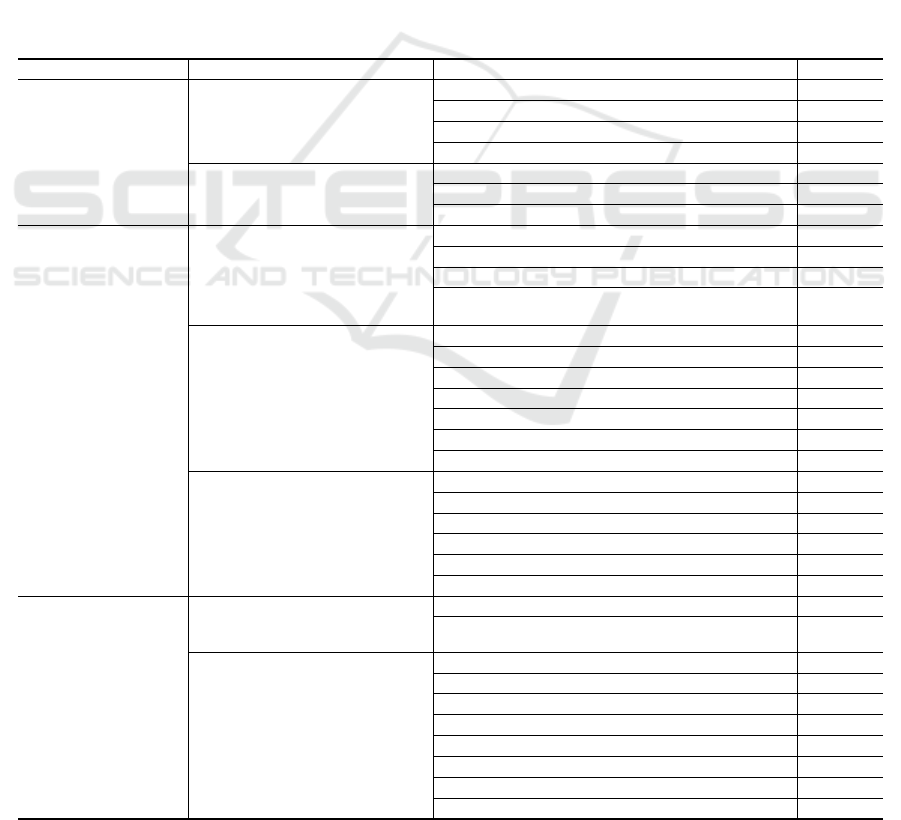
Table 1: Digital economy development level index system and weight.
Guideline Secondary index Tertiary index Weight
Digital Infrastructure
(0.2012)
F1
Digital Information Base
(0.1064)
F11 Fixed-line broadband application permeability
0.0208
F12 mobile network application permeability
0.0228
F13 Urban Cloud Platform
0.0283
F14 Information Security
0.0345
F2
Data Foundation
(0.0948)
F21 Urban Big Data Platform
0.0342
F22 Government Data Sharing Platform
0.0276
F23 Open Data Platform
0.0329
Digital
Government
with
Digital
Social
(0.4883)
S1
Digital Policy Planning
(0.1259)
S11 Number of policies covering livelihood areas
0.0284
S12 Digital policy projects in the field of livelihood
0.0338
S13 Number of governance areas covered
0.0321
S14 Number of digitization projects in the
governance area
0.0316
S2
Digitization of Government
Services
(0.2001)
S21 Education Digitalization
0.0206
S22 Healthcare Digitalization
0.0275
S23 Civil Service Digitalization
0.0370
S24 Human Services Digitalization
0.0300
S25 Poverty Alleviation Digitalization
0.0365
S26 Doing Business Digitalization
0.0206
S27 Living Environment Digitization
0.0279
S3
Digitalization of Government
Governance
(0.1623)
S31 Public Security Governance Digitalization
0.0228
S32 Information Governance Digitalization
0.0245
S33 Eco-friendly Digitalization
0.0384
S34 Municipal Management Digitalization
0.0217
S35 Emergency Management Digitalization
0.0216
S36 Digitization of natural resource management
0.0335
Digital
Industry
(0.3105)
I1
Digital Industrialization
(0.0647)
I11 digital industrialization drives industry
0.0301
I12 digital industrialization main industry
0.0346
I2
Industry Digitization
(0.2457)
I21 Agriculture Digitization
0.0343
I22 Financial Digitization
0.0311
I23 Manufacturing Digitization
0.0343
I24 Energy Digitization
0.0324
I25 Life Service Digitalization
0.0305
I26 Transportation and Logistics Digitalization
0.0355
I27 Science, education, culture and sports digital
0.0240
I28 Healthcare Digitization
0.0237
BDEDM 2022 - The International Conference on Big Data Economy and Digital Management
434
3 EMPIRICAL MEASUREMENT
3.1 A Digital Economy Development
Level of Each Subsystem
According to the comprehensive evaluation model,
the weights of each index can be obtained after
standardizing the original data, calculating the
entropy value and the entropy redundancy. Then, the
weight of urban digital economy development index
in the Yellow River Basin from 2020 to 2021 and the
comprehensive average level of national digital
economy development are obtained, as shown in
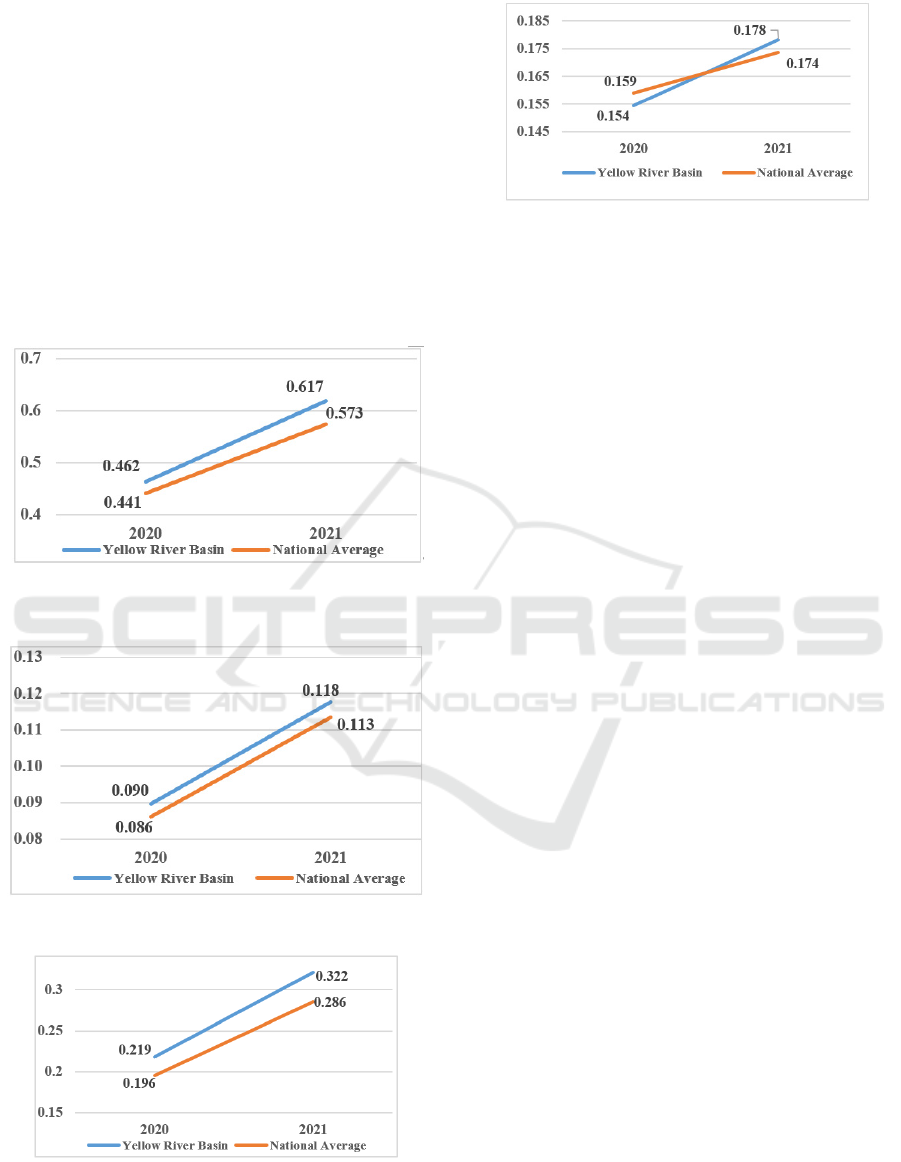
Figure 1.
Figure 1a: Overall Scores of Digital Economy
Development.
Figure 1b: Digital infrastructure.
Figure 1c: Digital government and digital society.
Figure 1d: Digital plus industry.
3.1.1 Overall Development of Digital
Economy in the Yellow River Basin
First, from Figure 1a, it can be seen that the overall
digital economy development index of cities in the
Yellow River Basin as a whole has increased from
0.462 in 2020 to 0.617 in 2021, with a development
rate of 33.51%, which is faster than the national
average digital economy development growth rate of
29.96% (Figure .1a).
Second, from the dimensions of "digital
infrastructure" and "digital government and digital
society" (Figure .1b and Figure .1c), cities in the
Yellow River Basin as a whole are higher than the
national average, with growth rates of 31.29% and
47.14% respectively, among which the development
growth rate of digital infrastructure in the Yellow
River Basin is lower than the national average of
31.73%, while the development growth rate of digital
government and digital society is higher than the
national average of 45.96%.
Third, in the dimension of "digital plus industry"
(Figure .1d), although the cities in the Yellow River
Basin as a whole lag behind the national average of
0.159 from 2020, they exceed the national average of
0.178 in 2021 with a growth rate of 15.49%.
3.1.2 Development Status of Urban Digital
Economy in Yellow River Basin
Figure 2 shows the overall scores of 22 cities in the
Yellow River Basin on the secondary indicators of
digital economy development. From a holistic
perspective, the overall scores of cities in the Yellow
River Basin are higher than the national average in
the dimensions of digital information base (0.066),
digital policy planning (0.078), digital government
services (0.110), and digital industry (0.135). Among
them, cities higher than the national average account
for 68.18%, 68.18%, 63.64% and 50% of the total
number of cities investigated respectively, while they
are lower than the national average in the dimensions
of data foundation (0.037), digital government
Research on the Index System of Cities’ Digital Economy Development Level in the Yellow River Basin
435
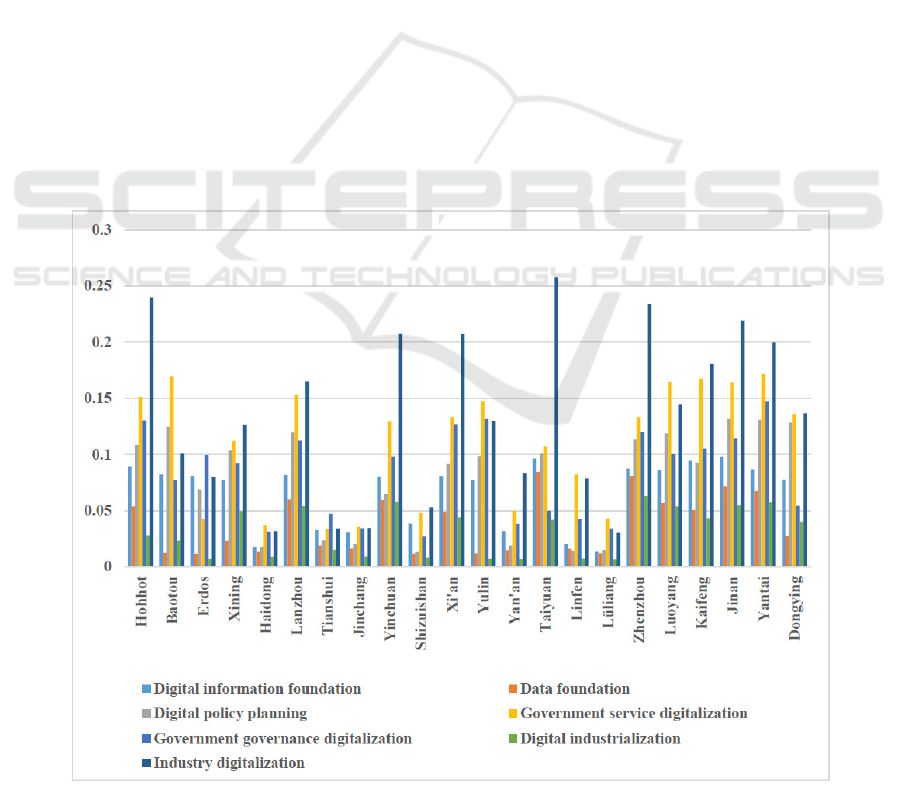
governance (0.082), and digital industrialization
(0.031). Among which cities with lower ratio than the
national average accounts for 68.18%, 45.45%, and
50% of cities investigated respectively.
In terms of cities, in the dimension of "digital
information base", the top three are Jinan, Taiyuan
and Kaifeng, whose digital information base levels
are high, with scores of 0.098, 0.096 and 0.095
respectively. While the last three are Linfen, Haidong
and Lyu liang, whose digital information base levels
are low, with scores of 0.020, 0.018 and 0.014
respectively. In the dimension of "data foundation",
Taiyuan, Zhengzhou and Jinan are ranked in the top
three, with high data foundation levels and scores of
0.084, 0.081 and 0.072 respectively. While Lüliang,
Shizuishan and Erdos are ranked in the bottom three,
with low data foundation level and scores of 0.012. In
the dimension of "digital policy planning", the top
three are Jinan, Yantai and Dongying, which show
that their digital policy planning levels are high, with
scores of 0.132, 0.131 and 0.128 respectively. While
the last three are Lüliang, Linfen and Shizuishan,
whose digital policy planning levels are low, with
scores of 0.015, 0.014 and 0.012 respectively. In the
dimension of "digitalization of government services",
the top three are Yantai, Baotou and Kaifeng, whose
digitalization levels of government services are high,
with scores of 0.172, 0.169 and 0.167 respectively.
While the last three are Haidong, Jinchang and
Tianshui, whose digitalization levels of government
services are low, with scores of 0.037, 0.036 and
0.033 respectively. In the dimension of "government
governance digitalization", the top three are Yantai,
Yulin and Hohhot, whose digitalization levels of
government governance are high, with scores of
0.147, 0.132 and 0.130 respectively. While the last
three are Lüliang, Haidong and Shizuishan, whose
digitalization levels of government governance are
low, with scores of 0.034, 0.031 and 0.027
respectively. In the dimension of "digital
industrialization", the top three cities are Zhengzhou,
Yinchuan and Yantai, whose digital industrialization
development levels are high, with scores of 0.063,
0.058 and 0.057 respectively. While the last three
cities are Yan’an, Erdos and Lyu liang, whose digital
industrialization levels are low, with scores of 0.007.
In the dimension of "industrial digitalization", the top
three cities are Taiyuan and Hohhot Zhengzhou,
which have high industrial digitalization levels with
scores of 0.258, 0.240 and 0.234 respectively. While
the last three cities are Tianshui, Haidong and
Lüliang, which have low industrial digitalization
levels with scores of 0.034, 0.032 and 0.030
respectively.
Figure 2: Measurement of the Development Level of Urban Secondary Indexes in the Yellow River Basin from 2020 to 2021.
BDEDM 2022 - The International Conference on Big Data Economy and Digital Management
436
3.1.3 Measurement of Urban Development
Indicator in Yellow River Basin
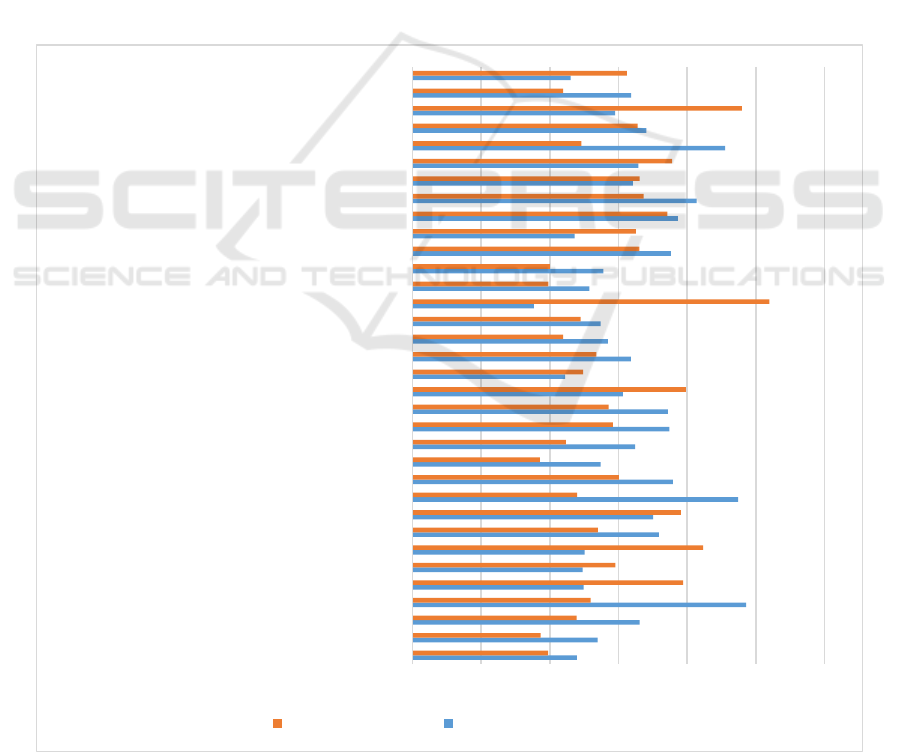
From Figure 3, we can intuitively understand the
overall scores of cities in the Yellow River Basin on
the development level of the tertiary indicators of
digital economy. First of all, in the dimension of
"digital infrastructure", the development level of
digital information base of cities in the Yellow River
Basin is higher than the national average. However,
the data infrastructure lags behind the national
average, especially in the construction of urban big
data platform and open data platform, which is
obviously different from the national average,
seriously restricting the overall digital transformation
and upgrading of cities in the Yellow River Basin.
Second, in the dimension of "digital government and
digital society", cities in the Yellow River Basin as a
whole are higher than the national average in digital
policy planning, digital construction of government
services and digital construction of government
governance. However, the digitalization of poverty
alleviation, business environment and ecological
environmental protection lags behind the national
average development level, especially the
digitalization of ecological environmental protection
is far from the national average level, which restricts
the "green benefits" of digital economy development
in the Yellow River Basin. At the same time, it is
difficult to form a new pattern of overall digital urban
development in the Yellow River Basin. Finally, in
the dimension of "digital plus industry", cities in the
Yellow River Basin lag behind the national average
in financial digitalization, manufacturing
digitalization, transportation and logistics
digitalization, as well as medical and health
digitalization, which is not only detrimental to the
industrial integration of cities in the Yellow River
Basin, but also restricts the transformation and
upgrading of industrial digitalization of cities in the
Yellow River Basin.
Figure 3: Score of tertiary indexes of data infrastructure.
0 0,005 0,01 0,015 0,02 0,025 0,03
F11 Fixed-line broadband application permeability
F13 Urban Cloud Platform
F21 Urban Big Data Platform
F23 Open Data Platform
S12 Digital policy projects in the field of livelihood
S14 Number of digitization projects in the…
S22 Healthcare Digitalization
S24 Human Services Digitalization
S26 Doing Business Digitalization
S31 Public Security Governance Digitalization
S33 Eco-friendly Digitalization
S35 Emergency Management Digitalization
I11 digital industrialization drives industry
I21 Agriculture Digitization
I23 Manufacturing Digitization
I25 Life Service Digitalization
I27 Science, education, culture and sports digital
National average the Yellow River Basin
Research on the Index System of Cities’ Digital Economy Development Level in the Yellow River Basin
437
3.2 Comprehensive Level of Digital
Economy Development
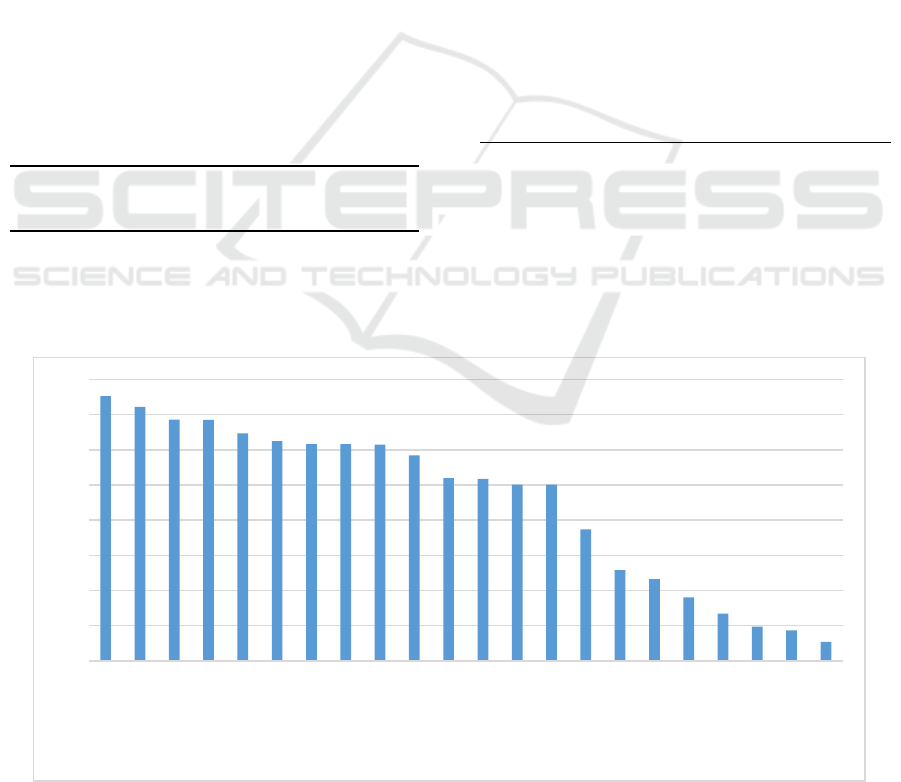
The TOPSIS empirical measurement results of digital
economy development level of 22 cities in the Yellow
River Basin from 2020 to 2021 are shown in Table 2
and Fig.4. It can be found that the comprehensive
scores of digital economy development of cities in the
Yellow River Basin during the investigation period
are distributed between 0.0535 and 0.7531. The city
with the lowest score is Haidong (0.0535), and the
city with the highest score is Yantai (0.7531). The
mean score (M) of the comprehensive level of digital
economy development in 22 cities in the Yellow
River Basin is 0.4547, and the standard deviation
(SD) is 0.2275, indicating that the comprehensive
level of digital economy development in cities in the
Yellow River Basin is generally good from 2020 to
2021. According to the relationship between mean
score (M) and standard deviation (SD), 22 cities can
be divided into three types: star level (score >
M+0.5SD), mediocre level (M-0.5SD < score <
M+0.5SD) and backward level (score < M-0.5SD).
Table 2: evaluation calculation results based on TOPSIS.
City
Optimal
solution
𝑑
Worst
solution
𝑑
Relative
Proximity
𝐶
Yantai 0.0441 0.1346 0.7531
Jinan 0.0516 0.1342 0.7222
Zhengzhou 0.0618 0.1349 0.6859
Hohhot 0.0573 0.1245 0.6849
Xi'an 0.0599 0.1099 0.6472
Lanzhou 0.0740 0.1234 0.6250
Taiyuan 0.0776 0.1248 0.6165
Kaifeng 0.0763 0.1223 0.6159
Luoyang 0.0748 0.1194 0.6149
Yinchuan 0.0842 0.1184 0.5845
Dongying 0.0977 0.1056 0.5195
Yulin 0.1004 0.1078 0.5177
Xining 0.1007 0.1012 0.5014
Baotou 0.1039 0.1044 0.5012
Ordos 0.1291 0.0771 0.3737
Linfen 0.1423 0.0494 0.2576
Yan'an 0.1457 0.0441 0.2323
Shizuishan 0.1515 0.0332 0.1799
Tianshui 0.1490 0.0230 0.1338
Jinchang 0.1524 0.0164 0.0970
Lüliang 0.1558 0.0147 0.0862
Haidong 0.1546 0.0087 0.0535
Yantai 0.0441 0.1346 0.7531
Jinan 0.0516 0.1342 0.7222
Zhengzhou 0.0618 0.1349 0.6859
Hohhot 0.0573 0.1245 0.6849
Xi'an 0.0599 0.1099 0.6472
Lanzhou 0.0740 0.1234 0.6250
Taiyuan 0.0776 0.1248 0.6165
Kaifeng 0.0763 0.1223 0.6159
The overall scores of digital economy
development in star-level cities are higher than
0.5684, including 10 cities, Yantai, Jinan,
Zhengzhou, Hohhot, Xi’an, Lanzhou, Taiyuan,
Kaifeng, Luoyang and Yinchuan. The overall scores
of digital economy development are 0.7531, 0.7222,
0.6859, 0.6849, 0.6472 and 0.6250 respectively.
The overall scores of digital economy development in
Figure 4: Overall scores of urban digital economy development of the Yellow River Basin from 2020 to 2021.
0
0,1
0,2
0,3
0,4
0,5
0,6
0,7
0,8
Yantai
Jinan
Zhengzhou
Hohhot
Xi'an
Lanzhou
Taiyuan
Kaifeng
Luoyang
Yinchuan
Dongying
Yulin
Xining
Baotou
Erdos
Linfen
Yan'an
Shizuishan
Tianshui
Jinchang
Lüliang
Haidong
BDEDM 2022 - The International Conference on Big Data Economy and Digital Management
438

mediocre-level cities range from 0.3410 to 0.5684,
including Dongying, Yulin, Xining, Baotou and
Erdos, and their overall scores of digital economy
development are 0.5195, 0.5177, 0.5014, 0.5012 and
0.3737 respectively, accounting for 23% of the total
number of cities investigated. The overall scores of
digital economy development in backward-level cities
are lower than 0.3410, including Linfen, Yan’an,
Shizuishan, Tianshui, Jinchang, Lüliang and Haidong.
The overall scores of digital economy development
are 0.2576, 0.2323, 0.1799, 0.1338, 0.0970, 0.0862
and 0.0535 in respectively, accounting for 32% of the
total number of cities investigated.
4 CONCLUSIONS AND
SUGGESTIONS
By constructing the indicator measurement system of
digital economy development, the entropy-TOPSIS
method is used to measure the overall development
of digital economy and the level of each subsystem in
22 cities in the Yellow River Basin from 2020 to
2021. Through data analysis, this paper mainly draws
the following conclusions:
In terms of secondary indicators, Jinan, Taiyuan
and Kaifeng are the cities with better development in
digital information infrastructure, while Linfen,
Haidong and Lyu liang are the cities with poorer
development. The cities with better development in
data infrastructure are Taiyuan, Zhengzhou and
Jinan, while the cities with poorer development are
Lüliang, Shizuishan and Erdos. The cities with better
development in digital policy planning are Jinan,
Yantai and Dongying, while the cities with poorer
development are Lyu liang, Linyi and Shizuishan.
The cities with better digital construction of
government services are Yantai, Baotou and Kaifeng,
while the cities with poorer development are
Haidong, Jinchang and Tianshui. The cities with
better development in the digital construction of
government governance are Yantai, Yulin and
Hohhot, while the cities with poorer development are
Lyu liang, Haidong and Shizuishan. The cities with
better development in digital industrialization
construction are Zhengzhou, Yinchuan and Yantai,
while the cities with poorer development are Yan’an,
Erdos and Luliang. Taiyuan, Hohhot and Zhengzhou
are the cities with better development in industrial
digitalization construction, while Tianshui, Haidong
and Lyu liang are the cities with poorer development.
The overall scores of cities in the Yellow River
Basin are higher than the national average in digital
information base (0.066), digital policy planning
(0.078), digital government services (0.110), and
digital industry (0.135), with cities above the national
average accounting for 68.18%, 68.18%, 63.64% and
50% of the total number of cities investigated
respectively, while they are lower than the national
average in data foundation (0.037), digital
government governance (0.082) and digital
industrialization (0.031), with 68.18%, 45.45%, and
50% of the total number of cities investigated being
below the national average respectively. It shows that
the growth rate of urban digital economy
development of Yellow River Basin is generally
good, but the development is uneven. By evaluating
the overall level of digital economy development by
entropy-TOPSIS method, 22 cities are classified into
10 star-level cities, 5 mediocre-level cities and 7
backward-level cities, accounting for 45%, 23% and
32% of the total number of cities investigated
respectively.
In conclusion, to achieve the goal of realizing the
overall digital transformation of cities in the Yellow
River Basin and improving the overall level of digital
economy development through technology
empowerment, it is necessary to clarify the top-level
design and transformation stage planning around the
development law of digital transformation.
Specifically, it is essential to build a digital industrial
system and a digital economic development pattern,
effectively improve the security level of digital social
governance, promote the integrated development of
urban digital government services with multiple
parties, and vigorously draw on the experience of
advanced cities in promoting digital construction, so
as to comprehensively promote the high-quality
development of cities in the Yellow River Basin.
FUND PROJECTS
① Project supported by Inner Mongolia Natural
Science Foundation: Digital Social Governance
Index System Measurement and Path Improvement
of Hohhot, Baotou, Erdos and Wulanchabu Based on
Innovation Environment Optimization (Grant No.:
2021BS0700); ② Key Project supported by Inner
Mongolia Philosophy and Social Science Planning
Project Base: Innovation Environment Optimization,
Technology Empowerment and the Path of Digital
Transformation of Social Governance of Hohhot,
Baotou, Ordos and Wulanchabu (Grant No.:
2020ZJD016).
Research on the Index System of Cities’ Digital Economy Development Level in the Yellow River Basin
439

ABOUT THE AUTHOR
Jie Ren, Inner Mongolia University of Science &
Technology, Lecturer, Ph.D. in Public Security. Her
research interest is science and technology innovation
and digital governance; Yifan Lv, Research Assistant
of Inner Mongolia University of Science &
Technology. His research interest is digital
governance.
REFERENCES
Chen F L, Tian G Y. Diving Force and Path of High-quality
Development of Manufacturing Industry in the Yellow
River Basin [J]. Yellow River, 2021, 43(09):20-24.
Liao J K, Du Q. Collaborative Governance of the Yellow
River Basin: Realistic Requirements, Realization Path
and Legislative Guarantee [J]. China Population
Resources and Environment, 2021,31(10):39-46.
Wang J. Study on the Application of New Generation
Information Technology to Promote Ecological
Protection and High-quality Development of the
Yellow River Basin [J]. Yellow River, 2021,43(03):6-
10.
Wang Z L, Shen G Q. Continue to Write a New Chapter in
the Yellow River Governance in the New Era [J].
Journal of Northwest University for Nationalities
(Philosophy and Social Sciences), 2020(05):117-125.
Yin P, Liu S G, Chen Cai. Urbanization efficiency
measurement and obstacle factor diagnosis of coastal
urban agglomerations in China [J]. East China
Economic Management, 2017,31(07):68-74.
Zhou Q X, He A P. Digital economy empowers high-
quality development of the Yellow River Basin [J]. On
Economic Problems, 2020(11):8-17.
BDEDM 2022 - The International Conference on Big Data Economy and Digital Management
440
