
Comparative Study on the Economic Environment of Oil and Gas
Resource Countries based on Entropy Weight-TOPSIS Method
Mingyan Ding
Beijing Jiaotong University, Beijing, China
Keywords: Economic Environment, Entropy Weight-Topsis Method, Research and Prediction, Oil and Gas Resources
Cooperation Countries.
Abstract: This paper evaluates the economic environment of oil and gas resource cooperation countries of China through
data evaluation. This paper selects 9 evaluation indicator variables, constructs the evaluation system, and uses
the entropy weight and TOPSIS method to calculate the economic environment of these countries. According
to the assessment results, population, per capita GDP and total GDP have the greatest impact on the economic
environment. India, Qatar, UAE, Indonesia and Russia have the best economic environment and have good
investment prospects for Chinese companies; Uzbekistan, Iran and Azerbaijan have relatively backward
economic environment and high investment risk, so a risk response system should be established before
business corporation.
1 INTRODUCTION
Since the "one belt, one road" initiative was proposed,
China's cooperation with oil and gas resources
countries along the route has become increasingly
close. However, most countries along the line belong
to developing countries, and there are great
differences in soft environment such as economic
development, political situation, legal environment
and social environment. These factors may be
potential investment risks. Economic environment is
one of the most important components of soft
environment. At present, the backward economic
development of some countries increases the risk of
Chinese enterprises investing abroad. In order to
promote cooperation with countries rich in oil and gas
resources and reduce investment risks, China must
study and predict the economic environment of
countries along the line. By understanding the
economic development of various countries,
enterprises choose appropriate investment
cooperation countries.
Economic environment is a non-material
condition and an important benchmark to measure the
investment environment of a country or region.
Investment in various countries, regions or industries
is increasingly inseparable from economic soft
environment evaluation. The development of big data
economy provides scholars from all walks of life with
a new method to study the economic environment.
Since the one belt and road initiative, many scholars
have evaluated and analyzed the economic
environment of different countries based on different
data methods to guide China’s enterprises to invest
overseas.
Most domestic scholars generally start with the
hard environment and soft environment when
studying the investment environment of China’s oil
and gas resources cooperation countries. There is
little literature devoted to the economic
environmental conditions of countries along the line.
Moreover, the index system and research methods
constructed by domestic scholars are not exactly the
same. Therefore, combined with relevant data, this
paper studies the economic environment of China’s
oil and gas resources cooperation countries,
constructs an evaluation system and makes
mathematical analysis, so as to deeply understand and
predict the economic environment of countries along
the line.
The investment environment can reflect a
country’s ability to attract investment. The theory of
"investment environment" appeared only around
1970. With the development of mathematical model
and information technology, foreign scholars began
to carry out quantitative research, and the research
results are more objective. Globerman (2002) studies
Ding, M.
Comparative Study on the Economic Environment of Oil and Gas Resource Countries based on Entropy Weight-TOPSIS Method.
DOI: 10.5220/0011178800003440
In Proceedings of the International Conference on Big Data Economy and Digital Management (BDEDM 2022), pages 361-365
ISBN: 978-989-758-593-7
Copyright
c
2022 by SCITEPRESS – Science and Technology Publications, Lda. All rights reserved
361

the impact of national governance capacity on foreign
capital inflow and outflow, which is divided into
three aspects: economy, politics, system and legal
environment (Globerman, 2002) Raj (2016)
established a comprehensive evaluation system to
study supply chain management decisions, analyzed
and ranked multiple decision-making processes with
entropy weight method and TOPSIS ranking method,
and selected the optimal decision (Raj, 2016, Kumar,
2016, Sharma, 2016). Hussain Jamal (2020)
conducted a comprehensive assessment of the
investment risks and natural resources of countries
along the “Belt and Road” through entropy weight-
TOPSIS ranking, and provided the minimum risk
recommendations for Chinese enterprises to invest
abroad. The results showed that Singapore, Malaysia,
Nepal, Bhutan, Russia, Armenia and the UAE are the
most suitable for Chinese companies to invest in
(Jamal, 2020, Zhou, 2020., Guo, 2020, Anwar, 2020).
This paper aims to be based on the economic
environment of some oil and gas countries, so the
selected indicators are the economic and
environmental indicators of countries rich in oil and
gas resources. Many scholars have also studied the
economic environment assessment of oil and gas
countries, but there is no unified evaluation system.
Wang Yue (2016) studied the investment
environment of oil and gas countries from nine
aspects such as economic environment (Wang, 2016).
He Bo et al. (2013) studied the integration of
economic environment and political environment
(He, 2013, An, 2013, Fang, 2013, Zhao, 2013, Ding,
2013). Liu Erhu (2018) divided it into four aspects:
political environment, economic environment,
infrastructure conditions and production factors (Liu,
2018, Chen, 2018).
Some scholars construct the evaluation index
system and select the evaluation model for
quantitative analysis, and the results are more
scientific. Wang Xinmin et al. (2015) used Theil
index to quantitatively study the investment
environment of major oil and gas countries (Wang,
2015, Liu, 2015, Sun, 2015). Li Yu et al. (2016)
constructed the index system through the Delphi
method, evaluated the investment environment from
six aspects, and divided the countries along the line
into four strategic countries: priority investment area,
key investment area, potential investment area and
risk area (Li, 2016, Zheng, 2016, Jin, 2016, Wang,
2016, Li, 2016, Zhao, 2016, Huang, 2016, Dong,
2016). Wang Yue (2016) one of the 9 level one
indicators and 58 two one indicators, one belt, one
road, the main oil and gas cooperation countries, and
the distribution of investment indicators (Wang,
2016). Wang Yaoqing and others (one) compare the
advantages one of the "one belt, one road" main
product from the perspective of the global industrial
chain (Wang, 2017, Tun, 2017, Sun, 2017). Liu Erhu
and Chen Ying (2018) used entropy weight method
to measure the impact of economy on the investment
environment of the five Central Asian countries (Liu,
2018, Chen, 2018). Li Youshu et al. (2019) used
entropy weight method to evaluate investment in
some energy countries, and used SE-DEA model and
Malmquist index method to evaluate investment
performance (Li, 2019, Li, 2019, Luo, 2019).
In the domestic research literature, scholars
mostly build the investment environment evaluation
indicators system to quantitatively evaluate the
investment environment of various countries, so as to
put forward corresponding investment suggestions.
Although the research method of constructing the
evaluation system is more scientific than the simple
qualitative research. However, the comprehensive
evaluation system is easy to be incomplete and omit
indicators, resulting in inconsistent evaluation system
and inconsistent research results. Therefore, this
paper only evaluates and forecasts the economic
environment to ensure the comprehensiveness of the
indicators. In order to ensure the objectivity of data
and results, the most objective research method
entropy weight TOPSIS method is selected.
The structure of this paper is as follows, the
second part is the Materials and Methods, the third
part is the results and discussion, and the fourth part
is the conclusions.
2 MATERIALS AND METHODS
2.1 Materials
According to the richness of oil and gas resources and
the availability of data, this paper finally selects 18
countries as the research objects. According to the
country guidelines of the Ministry of Commerce,
Kazakhstan, Turkmenistan and Uzbekistan belong to
Central Asia; Iran, Saudi Arabia, Kuwait, Qatar,
UAE, Oman and Egypt belong to West Asia and
North Africa; Indonesia, Malaysia, Thailand and
Vietnam belong to Southeast Asian countries; There
are also India, Russia, Pakistan and Azerbaijan, a
total of 18 countries.
The data used in this paper are from the foreign
guide of the world bank, the Ministry of Commerce
of China and the Wall Street Journal. The economic
environment is an important aspect that constitutes
the soft environment. The quality of a country's
BDEDM 2022 - The International Conference on Big Data Economy and Digital Management
362
economic environment directly affects investor
confidence. Generally speaking, a country with a
better economic environment has a better
environment in terms of education, infrastructure,
roads, etc., and the investment risk is lower, and it is
more favored by investors. Therefore, this paper
constructs the following index system to evaluate the
economic environment of various countries.
Based on the evaluation system in the reference
literature of quantitative research, this paper screened
out 5 first-level indicators and 9 secondary indicators
of economic environment. Therefore, the economic
environment evaluation system of my country's oil
and gas resource cooperation countries is constructed.
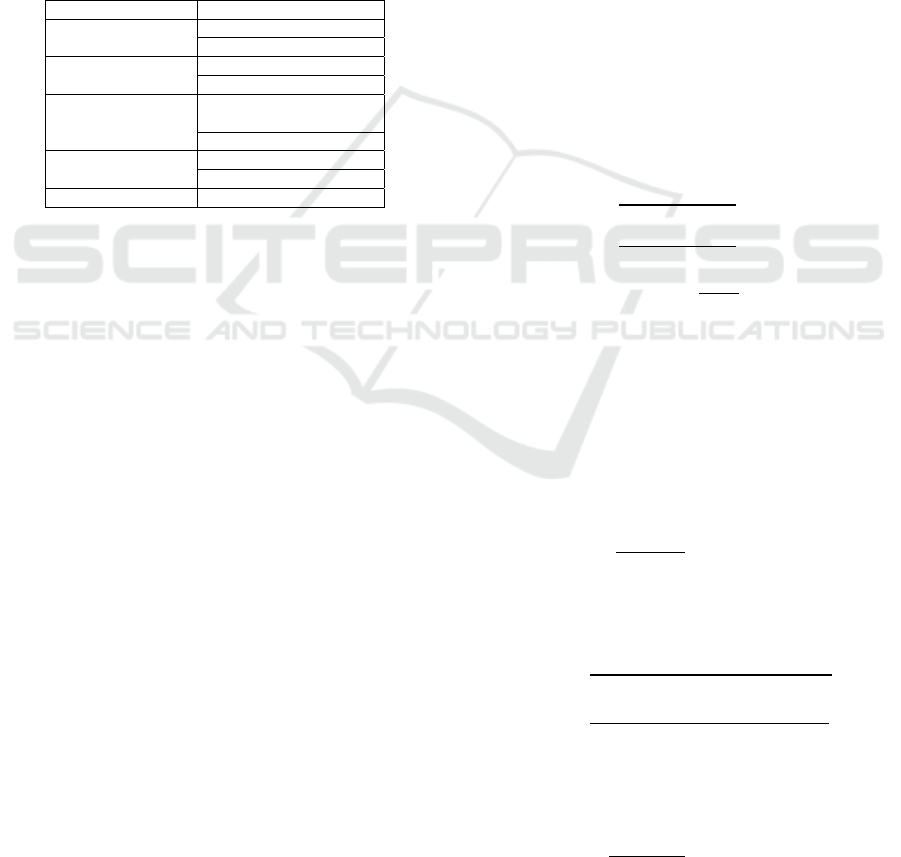
Table 1: Evaluation indicators.
Primary indicators Secondary indicators
Economic scale
Total GDP
population
Economic level
Per capita GDP
GDP growth rate
foreign trade
Proportion of total import
and export in GDP
Net FDI inflow
Economic stability
Inflation rate
unemployment rate
economic system Economic freedom
Explain the above evaluation system and
indicators: since the economic freedom index cannot
be measured by actual values, the reference to the
relevant literature here is replaced by the score of the
economic freedom of various countries in the report
published by the Wall Street Journal.
2.2 Entropy Weight – TOPSIS
2.2.1 The Meaning of Entropy Weight
Method and TOPSIS Method
Entropy was first introduced in thermodynamics to
measure the degree of disorder in microscopic matter
as it moves thermally. Later, Shannon proposed the
"information theory", which quantitatively analyzes
the problem with information entropy, so as to make
an objective evaluation. Because the entropy weight
method has the advantages of objectivity and strong
persuasion, the entropy weight method is now widely
used in the evaluation and analysis of economic,
social, engineering and other fields. In this paper, the
entropy weight method is also chosen because of its
objectivity. It is completely based on the analysis of
data to obtain results and is not easily affected by
subjective factors.
The entropy weight method determines the weight
of the indicator by measuring the disorder degree of
the data. That is to say, the more disordered the index,
the more information it provides, the smaller its
information entropy, and the greater its role in the
evaluation system, so the greater the weight is given.
TOPSIS is to sort the compared objects by
calculating the distance between the compared
objects and the positive and negative ideal solutions
when comparing multiple indicators or multiple
schemes. Combined with the entropy weight method,
on the one hand, the objective weight data calculated
by the entropy weight method can be used, and on the
other hand, TOPSIS can sort and compare multiple
objects.
2.2.2 Entropy Weight Method and TOPSIS
Sorting Calculation Process
We assume that there are m countries, and each
country has a total of n last-level evaluation
indicators. 𝑥
represents the j
th
indicator of the i
th
country. 𝑌
represents the j
th
indicator of the i
th
country. (i=1, 2……m;j=1, 2……n)
a) Standardize processing and calculate
information entropy
𝑋
=
(1)
𝑋
=
(2)
𝑌
=
∑
(3)
The information entropy is E, and the information
entropy of the j
th
index is E
j
; constant K=−1/ln𝑚,
calculate information entropy:
𝐸
=K
∑
𝑌
ln𝑌
(4)
If 𝑌
=0, then ln𝑌
The formula has no
meaning, so it is defined at this time𝑌
ln𝑌
=0.
b) Determine index weight
Let the weight be w and the weight of the j
th
indicator be𝑊
.
𝑊
=
∑
(
)
(5)
c) Calculate Euclidean distance
Let the positive distance be 𝑑
, the negative
distance is 𝑑
, the European distance of the i
th
country is 𝑑
or 𝑑
. calculation:
𝑑
=
∑
(Y ∗ 𝑊
−maxY∗ 𝑊
)
( 6 )
𝑑
=
∑
(Y ∗ 𝑊
−minY∗ 𝑊
)
(7)
d) Calculate TOPSIS proximity and sort
The calculated proximity is used as the score of
TOPSIS method in various countries.
𝑐
=
(
)
(8)
Comparative Study on the Economic Environment of Oil and Gas Resource Countries based on Entropy Weight-TOPSIS Method
363
According to the definitions of the entropy weight
method and the TOPSIS method, the proximity is
between 0 and 1, and the closer to 1, the better the soft
environment of the country. Therefore, in this paper,
the calculated Entropy Weight-TOPSIS proximity is
ranked according to the economic environment of
various countries.
3 RESULTS AND DISCUSSIONS
3.1 Weighting Results and Discussion
The weights of secondary indicators and tertiary
indicators are calculated by entropy weight method,
as shown in Table 2.
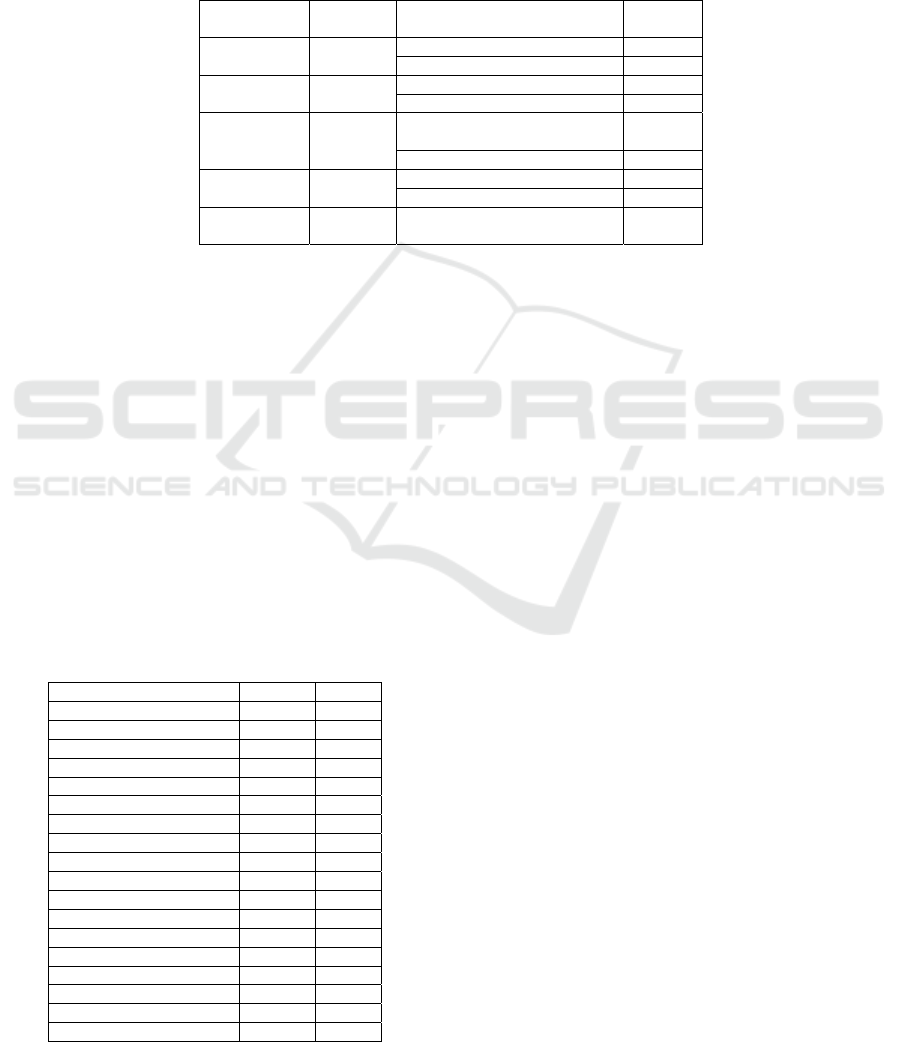
Table 2: Weight of evaluation indicators.
Primary
indicators
weight
Secondary
indicators
weight
Economic
scale
0.45
Total GDP 0.16
Population 0.29
Economic
level
0.25
GDP per capita 0.17
GDP growth rate 0.07
foreign trade 0.17
Proportion of total import and
export to GDP
0.08
Net FDI inflow 0.09
Economic
stability
0.07
Inflation rate 0.03
Unemployment rate 0.04
economic
system
0.05 Economic freedom 0.05
The weights of the three indicators of population,
GDP per capita and total GDP are relatively high,
indicating that these three indicators are the most
important in evaluating the economic environment
and have the greatest impact on the economic
environment. Countries with large populations may
have greater market potential and have a better
investment climate. Economic stability and economic
system indicators have less weight, indicating less
impact on the economic environment.
3.2 Evaluation Results and Discussion
Table3 calculates the TOPSIS proximity as scores
and sorts all countries according to the results.
Table 3: Economic environment ranking of countries.
country ranking score
India 1 0.6509
Qata
r
2 0.3407
The United Arab Emirates 3 0.2908
Indonesia 4 0.2665
Russia 5 0.2581
Vietnam 6 0.2557
Kuwai
t
7 0.2111
Malaysia 8 0.2063
Thailand 9 0.2017
Saudi Arabia 10 0.1928
Pakistan 11 0.1870
Turkmenistan 12 0.1542
Oman 13 0.1504
Egyp
t
14 0.1422
Kazakhstan 15 0.1341
Uzbekistan 16 0.1297
Iran 17 0.1159
Azerbaijan 18 0.1157
India scored the highest, indicating that India's
economic environment is the best, mainly due to the
country's large population and large economic
aggregate. The economic development of India is
similar to that of China. With large economic scale
and rapid development, India is one of the most
influential developing countries in the world.
Followed by Qatar, the United Arab Emirates,
Indonesia and Russia, these countries are favored by
investors because of their large economic aggregate
or high per capita GDP, stable economic policies and
stable markets. Qatar and the United Arab Emirates
have rich oil and gas resources and good economic
environment. Although the population is small, the
per capita GDP is relatively high. The economic
system is very flexible, the tax burden on enterprises
is minimal, and the restrictions on foreign investment
are small. When Chinese companies choose countries
to cooperate with, they can give priority to these
countries with higher scores. They have a good
economic environment.
Vietnam scored 6th, with a better economic
environment. Vietnam's economy is developing at the
fastest speed and has great potential for development.
Moreover, the Communist Party of Vietnam is in
power, and the government has high work efficiency
and continuous policies, which is conducive to
domestic political stability, economic development
and regulation.
The economies of Uzbekistan, Iran and
Azerbaijan are relatively backward. Uzbekistan is a
small country with insufficient market potential and
a small economy. Iran is affected by U.S. sanctions,
BDEDM 2022 - The International Conference on Big Data Economy and Digital Management
364

political instability, hampered oil exports and
stagnant economic development. Unemployment and
inflation are at high levels, people's living standards
are declining, and foreign capital has less
expectations. The disintegration of the Soviet Union
has had a huge impact on Azerbaijan, and
Azerbaijan's economy is constrained by the current
oil and gas downturn. The economic environment of
these countries is backward, and the risks of
economic cooperation are relatively high. Therefore,
investors should guard against economic risks in
international cooperation.
4 CONCLUSIONS
This paper conducts a comparative study on the
economic environment of 18 oil and gas resource
cooperation countries. Nine measurement indicators
are selected to construct an evaluation system, and
entropy weight method and TOPSIS ranking method
are used to evaluate the research objectives. The
results show that population and per capita GDP have
the highest weights and have the greatest impact on
the economic environment. The ranking results of
TOPSIS show that India, Qatar, and the United Arab
Emirates are the three countries with the best
economic environment. Although the economic
environment of these three countries ranks high, there
are still investment risks in each country. Before
cooperation, enterprises must do a good job of
investigation, consultation and planning, and fully
understand the political, legal system, social customs
and other conditions of the host country. Uzbekistan,
Iran, and Azerbaijan are the three countries with the
worst economic environment. Prioritizing
cooperation with countries with a better economic
environment can effectively expand the market and
avoid risks; cooperation with countries with unstable
economies may bring losses. However, these
countries have abundant energy resources and they
are potential resource cooperation countries.
Carrying out oil and gas cooperation with these
countries is conducive to ensuring the diversification
of sources of China's oil and gas resources. It is
necessary to be vigilant against risks in the economic
environment. Chinese companies should establish an
effective risk response system and not fight
unprepared battles.
There are still research limitations in this paper,
and the selected indicators are biased towards the
macroscopic aspect. In the future research, the
economic environment needs to be studied from the
microscopic level. The factors affecting the economy
are complex, and it is hard to quantify all the
influencing factors, so the established indicator
system is not perfect.
REFERENCES
Globerman, S. (2002) Global Foreign Direct Investment
Flows: The Role of Governance Infrastructure. World
Development, 30.
He, B., An, H.Z., Fang, W., Zhao, H.Y., Ding, Y.H. (2013)
Evaluation and optimization of global oil and gas
resources investment environment. Resources and
industry, 15: 114-118.
Jamal, H., Zhou, K., Guo, S.L., Anwar, K. (2020)
Investment risk and natural resource potential in “Belt
& Road Initiative” countries: A multi-criteria decision-
making approach. Science of The Total Environment.
Li, Y., Zheng, J., Jin, X.T., Wang, Z., Li, Z.H., Zhao, M.Y.,
Huang, Y.B., Dong, S.C. (2016) "One belt, one road"
investment environment comprehensive evaluation and
Countermeasures. Journal of the Chinese Academy of
Sciences, 31: 671-677.
Li, Y.S., Li, L., Luo, Y.L. (2019) China’s location choice
one belt, one road and other countries: Based on
investment environment and investment performance.
Economic issues, 7: 115-122.
Liu, E.H., Chen, Y. (2018) Comparative study on
investment environment of five Central Asian countries
under the background of Silk Road Economic Belt.
World geographic research, 27: 100-107.
Raj, A., Kumar, J., Sharma, H. (2016) Analysis of Rural E-
commerce Evaluation in Heilongjiang Province Based
on Entropy Weight Method. Indian Journal of Public
Health Research & Development, 1.
Wang, X.M., Liu, B.Q., Sun, J.F. (2015) Study on potential
evolution and differential change trend of international
oil and gas investment environment. World economic
research, 2: 105-114 + 129.
Wang, Y. (2016) Analysis and evaluation of one belt, one
road main oil and gas investment environment.
Industrial technology and economy, 35: 118-127.
Wang, Y.Q., Tun, F.H., Sun, Z.H. (2017) "One belt, one
road" oil and gas trade competitiveness measurement
and cooperation potential evaluation: A Perspective of
the whole industry chain. Journal of the Pacific, 25: 68-
83.
Comparative Study on the Economic Environment of Oil and Gas Resource Countries based on Entropy Weight-TOPSIS Method
365
