
Analysis on the Applicability of RNN, LSTM, and GRU Deep
Learning Algorithms for Stock Price Prediction
Tianya Xu
a
Business school, Central University of Finance and Economic, Beijing, 100000, China
Keywords: Stock Price Prediction, Deep Learning, Applicability, RNN, LSTM, GRU, Algorithms.
Abstract: There are many studies based on deep learning algorithms to predict stock prices. Although the prediction
results are good in the experimental environment, the accuracy drops dramatically in the actual stock market.
Most scholars want to solve the problem by enhancing the algorithmic model. But the author assesses the
applicability between algorithm and stock data as another reason for that problem, and hopes to find out
whether there is a matching problem between the algorithm and data by analyzing the prediction result of
different types of stock data based on the different algorithms. This paper performs stock price prediction
based on RNN, LSTM, and GRU algorithms on four stocks with different fluctuation types and determines
the applicability of the three algorithms by analyzing the regression evaluation index of prediction results.
The result shows that the fluctuation of stock price has a significant impact on the accuracy of the three
algorithms. The LSTM algorithm fits best for the fluctuation type that stock price showing large cyclical
fluctuations, whose correlation coefficient reaches at 0.8067, while the GRU algorithm fits best for the
fluctuation type that shows slump in stock price, whose correlation coefficient reaches at 0.8072.
1 INTRODUCTION
Due to the high return of the stock market, the stock
market has been attracting a lot of attention, involving
the deep learning field. Researchers hope to gain
more profits by studying the pattern of stocks and
making predictions about price movements. Stock
price prediction is a classical prediction problem
based on time-series data and very suitable to deep
learning algorithms. But it is difficult to extract
accurate features of the stock price for prediction,
because the behavior of the stock market is complex
and non-linear, and stock data has noise, numerous
dimensions, and significant uncertainties. Jiang
Weiwei collected and organized the existing stock
price prediction -related literature based on the deep
learning algorithm. It can be seen that the accuracy
dramatically decreases when it comes to the actual
market, although the prediction results are good in the
experimental environment (Jiang, 2021).
In response to this problem, most scholars worked
on optimizing algorithmic models, hoping to improve
the prediction results by exploring new algorithmic
a
https://orcid.org/0000-0001-9145-4929
models, such as the transformer model, which is
considered to have significant advantages in mining
extremely long-term dependencies from financial
time series. It is difficult for RNN-based methods to
learn dependencies in many steps (Ding, Wu, Sun,
Guo, Guo, 2020). The transformer model generally
outperforms traditional deep tilt models in predicting
stock prices, with accuracy 4.68% higher than short-
term memory (LSTM) (Zhang and Zhang 2020).
Some scholars improved the existing algorithm
model to improve the defective points, such as a
stacked LSTM model, which adds early-stopping,
rectified linear units (Relu) activation function,
overcome gradient explosion, gradient disappearance
(Zhang, LI, Chen, Chrysostomou, Yang, 2021). Other
scholars introduced special algorithms for pre-
processing to improve the accuracy of existing
models before importing them, such as EMD, which
can theoretically be applied to the decomposition of
any type of time-series signal, and decompose a
complex signal into a finite sum of eigenmode
functions (IMFs) and residual waves. The IMF
component contains the local eigen-signals of the
original signal at different time scales. The LSTM
model after introducing EMD preprocessing not only
Xu, T.
Analysis on the Applicability of RNN, LSTM, and GRU Deep Learning Algorithms for Stock Price Prediction.
DOI: 10.5220/0011175000003440
In Proceedings of the International Conference on Big Data Economy and Digital Management (BDEDM 2022), pages 301-305
ISBN: 978-989-758-593-7
Copyright
c
2022 by SCITEPRESS – Science and Technology Publications, Lda. All rights reserved
301
improves the prediction accuracy, but also reduces
the time delay (Jin, Yang, Liu 2020).
In this paper, the author considers the main factor
that affects the prediction accuracy of the actual stock
market is not the algorithm. However, due to the poor
adaptability of the algorithm to the fluctuation of
stock price, the prediction accuracy decreases.
According to the two-year stock data, four stocks
with different price fluctuations in the two-year
period are selected to explore the prediction accuracy
under RNN, LSTM and GRU (Shahi, Shrestha,
Neupane, Guo, 2020). These three main time series
deep learning algorithm models are widely used and
discussed at present. The author aims to find the
optimal algorithm corresponding to the stocks with
different fluctuation types by comparing the
regression evaluation indexes of the result, to analyze
the applicability of RNN, LSTM, and GRU deep
learning algorithms for stock price prediction. This
paper shows an adaptation problem between the
fluctuation situation of the stock price and the
algorithm. Besides, a new research direction is
proposed, which enables scholars in the field of stock
price prediction to focus on algorithmic research
breakthroughs and explore more into the issue of
matching data to algorithms. The author also suggests
that follow-up studies could categorize historical data
of the stock market and select the corresponding
existing optimal algorithm for stock price prediction,
contributing to higher accuracy in the actual stock
market in the future.
2 METHODOLOGY
2.1 Data Source and Pre-processing
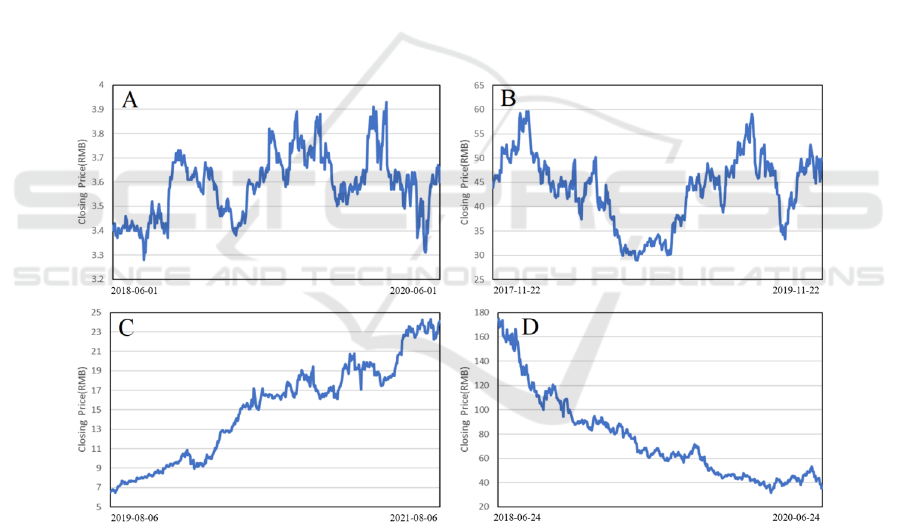
This paper takes 2 years as the time interval, and
selects 4 stocks with different price fluctuation
situations: 601288.SH (almost stable), 002049.SZ
(large fluctuation cycle), 002468.SZ (soar),
603605.SH (slump) (as shown in figure 1).
Figure 1: The price fluctuation situation of four stocks in two years (A-601288.SH, B-002049.SZ, C-002468.SZ, D-
603605.SH).
The stock trading data is retrieved through the
Tushare API (Pan, Li, Li 2020), containing the daily
opening price (Open), high price (High), low price
(Low), closing price (Close), and trading volume
(Volume). These five feature values are used as input
to predict the closing price of the 61st day with the
historical data of every 60 trading days to extract the
feature of the stock price fully.
Since both stock price data and trading volume
data are used as the input feature parameters, and the
values of both are vastly different, this paper
normalizes the data to eliminate the influence of the
magnitude between them to improve the model
accuracy and convergence speed. The processed data
are divided into training set and test set in order. Due
to the different number of trading days in different
time periods, the last 100 trading days data are used
BDEDM 2022 - The International Conference on Big Data Economy and Digital Management
302
as the test set to evaluate the short-term prediction
accuracy of the model.
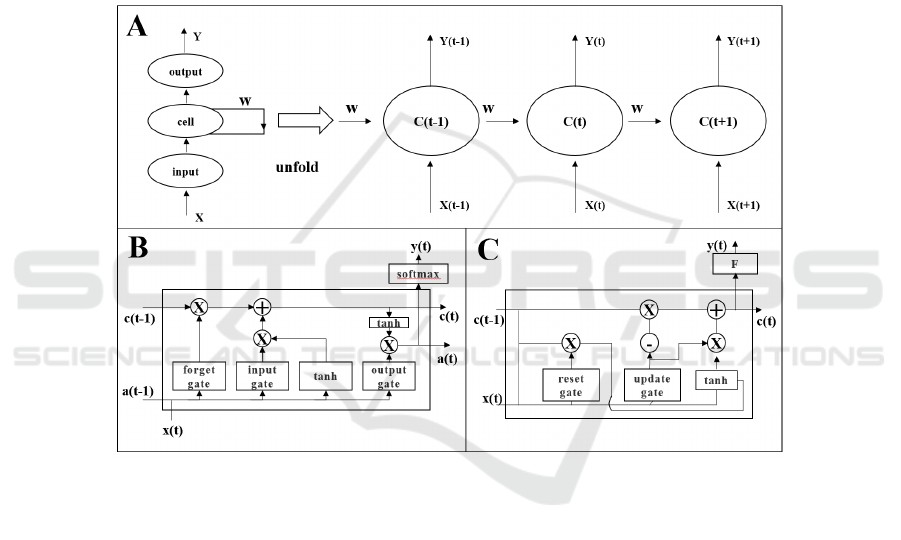
2.2 Model Construction
The author will use RNN, LSTM and GRU models
for experiments, and the structure of those models is
shown in figure 2 (Shahi, Shrestha, Neupane, Guo,
2020).
2.2.1 RNN Model
In the traditional RNN (recurrent neural network), all
W is the same W. When passing
through the same cell,
the input memory will be retained, plus another input
to be predicted, so the prediction includes all the
previous Memory plus this input. All RNNs have a
chain form of repeating neural network modules. In a
standard RNN, this repeated module has only a
simple structure, such as one tanh layer. When the
weight is greater than 1, the backpropagation of the
error will always enlarge the error and eventually
cause the gradient to explode, when the weight is less
than 1, the error will continue to shrink, leading to the
disappearance of the gradient, which in turn leads to
the slow update of the weight of the network. The
effect of long-term memory makes RNN too
forgetful.
Figure 2: The structure of the RNN, LSTM and GRU model (A-RNN, B-LSTM, C-GRU).
2.2.2 LSTM Model
LSTM is a special RNN model to solve the problem
of gradient disappearance and gradient explosion in
the back propagation process. By introducing a gate
mechanism, it solves the long memory problem in the
RNN model. LSTM has three gates to protect and
control the cell state: forget gate, update gate and
output gate. The cell state is similar to a conveyor
belt. Run directly on the entire chain, with only a few
linear interactions. It will be easy for the information
to circulate on it and stay the same.
2.2.3 GRU Model
GRU was proposed by Cho, et al. (Chung, Gulcehre,
Cho, Bengio, 2014), and its feature is to combine the
forget gate and the input gate into a single update
gate, introducing another reset gate. The final model
is simpler than the standard LSTM model, the
parameters are 1/3 less, it is not easy to overfit, and
the effect is similar to LSTM, and even surpasses
LSTM in some applications.
2.2.4 Parameter Setting
TensorFlow is currently the leading framework for
deep learning and neural network computing. It is
based on a low-level C++ backend, but is typically
controlled via Python. This paper will be based on
Google's TensorFlow2.3 framework for stock price
prediction in Keras API (Raschka, Mirjalili, 2017),
Python version 3.8, Keras version 1.0.8. In terms of
model parameter settings, the number of neurons in
Analysis on the Applicability of RNN, LSTM, and GRU Deep Learning Algorithms for Stock Price Prediction
303
the three models is uniformly set to 100, the batch
size to 64, the number of iterations (epoch) to 300, the
loss function (loss) set by mean square error (MSE),
the optimizer (optimizer) set by Adam at
0.0001(Kingma, Ba, 2014), and the time step t to 60.
2.3 Performance Index
In order to evaluate the prediction performance of the
algorithmic model on stock prices, four regression
evaluation metrics, mean square error (MSE), root
mean square error (RMSE), mean absolute error
(MAE), and R-squared (R2), are used in this paper to
quantify the model performance. The four metrics are
calculated as shown in equation (1)-(4).
𝑀𝑆𝐸 =
∑
(𝑦
−𝑦
)
(1)
𝑅𝑀𝑆𝐸 =
∑ (
𝑦
−𝑦
)
(2)
𝑀𝐴𝐸 =
∑ |
(𝑦
−𝑦
)
|
(3)
𝑅
=1−
∑
(𝑦
−𝑦
)
∑
(𝑦
−𝑦)
⁄
(4)
Where y
is the true value, y
is the predicted
value, y is the mean of the true value, and m is the
sample size. MSE, RMSE, and MAE are used to
measure the deviation between the true value and the
predicted value, with smaller values indicating that
the predicted value is closer to the true value, and R
is used to measure the degree of model fit, with closer
to 1 indicating that the model fits better.
3 RESULT
The prediction experiments were conducted based on
RNN, LSTM and GRU models for the four selected
stocks respectively, forming 12 experimental groups,
and the prediction experiments of each group would
be repeated 10 times due to the randomness of deep
learning algorithm (Scardapane, Wang, 2017).
Finally, a total of 120 experiments were conducted in
this paper, and the experimental results with smaller
MSE were selected in each group, 12 experimental
groups’ result as shown in table 1.
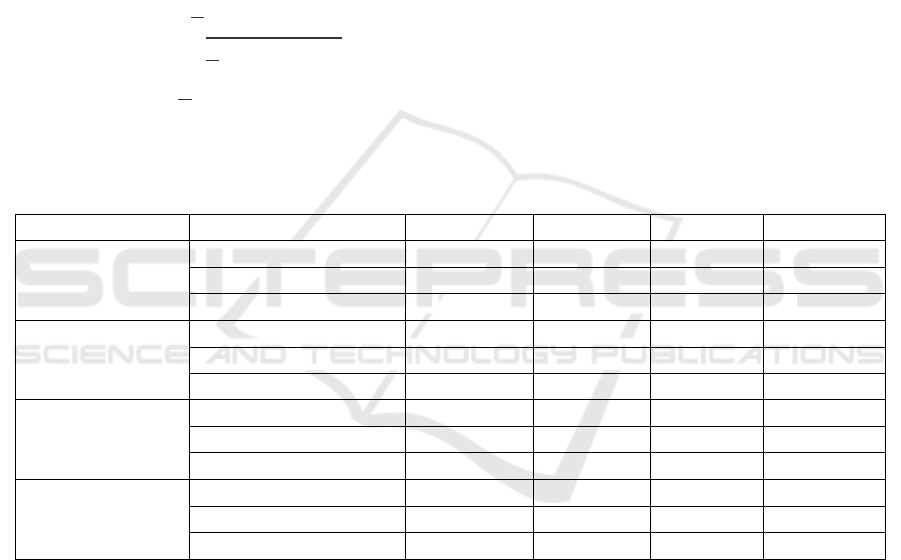
Table 1: Regression evaluation index of the result.
STOCK ALGORITHM MSE RMSE MAE R2
601288.SH Stable
RNN 0.0006 0.0247 0.0207 -0.5900
LSTM 0.0010 0.0313 0.0273 -4.8909
GRU 0.0005 0.0216 0.0183 -1.7951
002049.SZ
Large Fluctuation
RNN 2.9393 1.7144 1.2641 0.7503
LSTM 2.0368 1.4272 1.0878 0.8067
GRU 2.4346 1.5603 1.1402 0.7478
002468.SZ
Soar
RNN 0.0525 0.2292 0.1998 0.7150
LSTM 0.0344 0.1855 0.1424 0.7117
GRU 0.0268 0.1638 0.1319 0.8072
603605.SH
Slump
RNN 46.0314 6.7846 5.7093 0.6195
LSTM 56.1527 7.4935 6.2176 0.6137
GRU 46.8088 6.8417 5.5568 0.6699
4 DISCUSSION
For the fluctuation type that stock price’s fluctuation
is not significant, almost stable (601288.SH), R
is
negative, none of the three algorithms can fit
correctly. The main reason for this problem is that the
stock price fluctuates steadily around the mean,
resulting in a scattered distribution of features, with
numerous local optima, and the algorithms cannot
accurately capture the right features for fitting.
However, the minor fluctuation results in lower
values of MSE, making the prediction results of either
algorithm more accurate and with less error.
For the fluctuation type that stock price showing
large cyclical fluctuations (002049.SZ), and the trend
of soar (002468.SZ), the R
under all three
algorithms is large than 0.7, and the MSE, RMSE,
and MAE are all at low values. However, the best
prediction result is under the LSTM algorithm when
the stock price is in large cyclical fluctuations, while
the results of the GRU algorithm are better under the
trend of soaring. It can be speculated that the main
reason for the difference is that the GRU algorithm
BDEDM 2022 - The International Conference on Big Data Economy and Digital Management
304

logic has a selectivity for past information when
calculating the current state information, i.e., whether
the current information is generated by past
information while the LSTM algorithm selects the
same proportion of past and present information for
output. Under the soaring trend of stock price, the
GRU algorithm is more likely to strengthen the
weights of the features involved in the rising trend to
get better prediction results. While the weights of the
features just under a single-period wave are
strengthened in the cyclical fluctuations, this high
weight memory by GRU cause a decrease in the
accuracy in the multi-period fluctuations.
For the fluctuation type that show slump in stock
price (603605.SH), the R
of three algorithms are
all larger than 0.6, showing a good correlation.
However, the MSE value is as high as 45 and the
RMSE and Mae values are also large, which can
hardly be used as a short-term stock price forecast.
The main reason is that the stock price related data is
more complicated in the plunge market than in the
rise market. As in psychology, people are more risk
averse compared to profit taking, and the panic of the
plunge leads to too large initialized values of weights
and more outliers. Moreover, the amount of learning
data is not enough to adjust them, resulting in the
large final MSE value, although the correlation
coefficient is good.
5 CONCLUSIONS
For the four different fluctuation types of the stock
price in 2 years, this paper uses three different
algorithms, RNN, LSTM, and GRU, to perform stock
price prediction, and the prediction accuracy of each
algorithm differs significantly.
1) For the fluctuation type in which stock price is
almost stable, there is not much difference in
prediction accuracy between various algorithms.
2) LSTM algorithm is most suitable for the
fluctuation type with large periodic fluctuation of
stock price, while GRU algorithm is most suitable for
extracting eigenvalues and making the most accurate
prediction under the soaring trend.
3) The performance of the three algorithms is not
satisfactory for the fluctuation type that shows a
slump in stock price. The author plans to follow up
with some new optimization algorithms for
experimentation. In addition, due to the randomness
of the algorithm, 10 trials in each experimental group
may not be enough to find the best-fit point, which
can easily cause errors in the algorithm comparison.
The four types of fluctuation situations selected in
this paper do not represent all fluctuation situations in
the actual stock market. This paper only points out
that the fluctuation type of stock price significantly
impacts the accuracy of the prediction under a deep
learning algorithm. To improve the prediction
accuracy and optimize the algorithm model, choosing
the suitable algorithm fit for the particular fluctuation
situation in stock price is also the main point. Future
research will perform applicability analysis for
prediction under advanced algorithms based on more
complex fluctuation types of stock price.
REFERENCES
Chung, J., Gulcehre, C., Cho, K., & Bengio, Y. (2014).
Empirical evaluation of gated recurrent neural
networks on sequence modeling.
Ding, Q., Wu, S., Sun, H., Guo, J., & Guo, J. (2020).
Hierarchical Multi-Scale Gaussian Transformer for
Stock Movement Prediction. In IJCAI (pp. 4640-4646).
Jiang Weiwei. (2021). Applications of deep learning in
stock market prediction: Recent progress. Expert
Systems with Applications, 184
Jin, Z., Yang, Y. & Liu, Y. Stock closing price prediction
based on sentiment analysis and LSTM. Neural
Comput & Applic 32, 9713–9729 (2020).
https://doi.org/10.1007/s00521-019-04504-2
Kingma, D. P., & Ba, J. (2014). Adam: A method for
stochastic optimization. Computer Science.
Pan Wei and Li Jide and Li Xiaoqiang. (2020). Portfolio
Learning Based on Deep Learning. Future Internet,
12(11), pp. 202-202.
Raschka, S., & Mirjalili, V. (2017). Python Machine
Learning: Machine Learning and Deep Learning with
Python. Scikit-Learn, and TensorFlow. Second edition
ed.
S. Zhang and H. Zhang, "Prediction of Stock Closing Prices
Based on Attention Mechanism," 2020 16th Dahe
Fortune China Forum and Chinese High-educational
Management Annual Academic Conference
(DFHMC), 2020, pp. 244-248, doi:
10.1109/DFHMC52214.2020.00053.
Scardapane, S., & Wang, D. (2017). Randomness in neural
networks: an overview. Wiley Interdisciplinary
Reviews: Data Mining and Knowledge
Discovery, 7(2), e1200.
Shahi TB, Shrestha A, Neupane A, Guo W. Stock Price
Forecasting with Deep Learning: A Comparative
Study. Mathematics. 2020, 8(9):1441.
https://doi.org/10.3390/math8091441
Zhang, X., LI, C., Chen, K-L., Chrysostomou, D., & Yang,
H. (2021) Stock Prediction with Stacked-LSTM Neural
Networks. The 21st IEEE International Conference on
Software Quality, Reliability, and Security.
Analysis on the Applicability of RNN, LSTM, and GRU Deep Learning Algorithms for Stock Price Prediction
305
