
Exploring Feature Selection and Feature Transformation Techniques
to Improve Telephone-based Biomedical Speech Signal Processing
towards Parkinson’s Assessment
Athanasios Tsanas
1a
and Siddharth Arora
2b
1
Usher Institute, Edinburgh Medical School, University of Edinburgh, U.K.
2
Department of Mathematics, University of Oxford, U.K.
Keywords: Acoustic Analysis, Parkinson’s Disease, Speech Signal Processing, Sustained Vowels.
Abstract: Clinical decision support tools mining speech signals for Parkinson’s Disease (PD) applications typically rely
on relatively small numbers of participants, having collected data under highly controlled acoustic conditions.
We recently reported on the Parkinson’s Voice Initiative (PVI), a large international project leading to the
collection of 19,000+ sustained vowel phonations (control and PD groups) across seven countries, where
participants were self-selected and provided phonations over the standard telephone network. In this study,
we explored sustained vowels in a balanced subset of the US-speaking cohort in PVI comprising 3000
participants (1500 PD and 1500 controls). The aim was to investigate feature selection and feature
transformation techniques towards improving binary differentiation of controls and PD and obtaining new
insights in a lower dimensional space. We acoustically characterized each sustained vowel /a/ phonation using
307 dysphonia measures which had previously been successfully employed in speech-PD applications. We
explored five different feature selection and two manifold embedding techniques to project data into new
feature spaces which might be more predictive of the binary outcome, and presented those into a Random
Forest. We assessed the performance of the resulting models using internal 10-fold Cross-Validation (CV).
We report classification accuracy of 67% and provide tentative interpretation by comparing the different
feature subsets identified using different methods. Collectively, these findings provide new insights towards
developing parsimonious feature subsets to facilitate the development of a large-scale tool for PD screening
at minimal cost using telephone-based sustained vowels.
1 INTRODUCTION
Parkinson’s Disease (PD) is a progressive
neurodegenerative disorder straining national health
systems globally (Dorsey et al., 2013). Prevalence
rates have been constantly increasing over the last
years: there were approximately 2.5 million People
diagnosed with PD (PwP) in 1990, rising to 6.1
million PwP by 2016 (GBD, 2018). More recently, a
large global burden of disease study highlighted PD
as one of the top five leading causes of death from
neurological disorders in the US (GBD Neurological
Disorders Collaborators, 2021). Cardinal PD
symptoms include tremor, rigidity, bradykinesia, and
postural stability, within the broader remit of motor,
a
https://orcid.org/0000-0002-0994-8100
b
https://orcid.org/0000-0001-6499-6941
cognitive, and neuropsychiatric symptoms (Olanow,
Stern, Sethi 2009).
The use of speech signals to assess PD has been
very well described in the research literature (Titze,
2000; Tsanas 2012). It is revealing that 29% of PwP
consider vocal performance degradation as one of
their most debilitating symptoms (Hartelius and
Svensson, 1994). Recent studies have demonstrated
the enormous potential of capitalizing on speech
signals in neurodegenerative applications and PD in
particular. For example, research work has explored:
(1) differentiating PwP from age- and gender-
matched controls with almost 99% accuracy (Tsanas
et al., 2012); (2) accurately replicating the Unified
Parkinson’s Disease Rating Scale (UPDRS) (Tsanas
et al., 2010a; 2010b; 2010c; 2011; 2021), which is the
Tsanas, A. and Arora, S.
Exploring Feature Selection and Feature Transformation Techniques to Improve Telephone-based Biomedical Speech Signal Processing towards Parkinson’s Assessment.
DOI: 10.5220/0011029800003123
In Proceedings of the 15th International Joint Conference on Biomedical Engineering Systems and Technologies (BIOSTEC 2022) - Volume 4: BIOSIGNALS, pages 327-334
ISBN: 978-989-758-552-4; ISSN: 2184-4305
Copyright
c
2022 by SCITEPRESS – Science and Technology Publications, Lda. All rights reserved
327

standard clinical tool to provide an overall PD
symptom assessment; (3) automatically assessing
voice rehabilitation (Tsanas et al., 2014a); (4)
providing early biomarkers in PD with gene
mutations and other PD precursors (Arora et al.,
2018; Arora et al. 2021); (5) clustering PD
participants towards developing more personalized
monitoring and treatment approaches (Tsanas and
Arora, 2020; 2021); and (6) speech articulation
kinematic models to characterize PD dysarthria thus
providing tentative insights into the underlying
physiology (Gomez et al., 2019).
Typically, reseach into speech-PD has focused on
single-site findings and has been limited in terms of
study paticipants. A large multi-site trial, the
Parkinson’s Voice Initiative (PVI) (Arora, Baghai-
Ravary, Tsanas, 2019; Arora and Tsanas, 2021) is the
first of its kind study, inviting people to self-enrol and
donate their voices to facilitate large scale analysis of
PD. Overall, PVI collected more than 19,000
sustained vowel /a/ samples from people across seven
countries. Although the data collected in PVI is
clearly not of the same high quality as data collected
under carefully controlled acoustic conditions, the
large number of samples facilitates new explorations
in different directions.
The aim of this study was to explore different
feature selection and feature transformation
techniques towards facilitating the binary
differentiation of control participants and PD
participants in a subset of the PVI data, thus building
on our previous work with this dataset (Arora,
Baghai-Ravary and Tsanas 2019; Arora and Tsanas,
2021a). The ultimate goal is to develop a clinical
decision support tool to facilitate PD screening at
large at practically no cost.
2 DATA
The PVI study invited people call on a dedicated
region-specific phone number and contribute their
voices to facilitate clinical research into PD. Data
were collected across seven major geographical
locations (Argentina, Brazil, Canada, Mexico, Spain,
USA, and the UK) using servers by Aculab for the
needs of this project. People called a dedicated phone
number that was closest to their geographical location
and were not compensated in any way for
participating in the study. Participants followed aural
instructions in the native language for the region, and
were asked to provide basic demographic information
(age, gender), self-report whether they had received a
clinical PD diagnosis, and record two sustained vowel
/a/ phonations. The instruction was to sustain vowel
/a/ for as long and as steadily as possible, following
standard widely speech collection protocols (Titze,
2000). The speech recordings were sampled at 8 kHz
at 16 bits or resolution. In total, the PVI study
collected more than 19,000 phonations.
In this study we processed data from the single
largest collection site, Boston to ovecome differences
in voices from people coming from different
linguistic backgrounds, even when comparing UK-
English and US-English (Tsanas and Arora, 2021b).
Specifically, we processed data from 1078 PD
participants (age 62.7±12.0, 566 male) and 5453
controls (49.2±15.9, 2976 male). We do not have
detailed information regarding PD-symptom specific
aspects, for example whether participants self-
enrolled when they were “on” or “off” medication, or
clinically validated metrics such as UPDRS. For
further details on PVI including detailed
demographics we refer readers to our previous work
(Arora, Baghai-Ravary, Tsanas, 2019; Tsanas and
Arora, 2019; Arora and Tsanas 2021).
3 METHODS
3.1 Data Pre-Processing
We developed a speech recognition software which
automatically transcribed the participants’ responses
over the phone regarding age, gender, and self-
reported PD assessment. Randomly selected
recordings were aurally inspected for voice quality to
ensure the transcription was correct. Moreover, we
inspected recordings where the automated speech
recognition algorithm had less than 90% confidence
in the transcript output. For further details on
preprocessing and removing faulty phonations we
refer to (Arora, Baghai-Ravary, Tsanas, 2019).
3.2 Acoustic Characterization of
Sustained Vowel /a/ Phonations
We used the Voice Analysis Toolbox (freely
available from https://www.darth-group.com/
software and also from https://github.com/Thanasis
Tsanas/VoiceAnalysisToolbox) to acoustically
characterize each sustained vowel /a/ phonation. The
toolbox computes 307 dysphonia measures, which
have been developed specifically to characterize
sustained vowel /a/ phonations extensively validated
across diverse PD datasets (Tsanas et al., 2010a;
Tsanas et al., 2010b; Tsanas et al., 2011; Tsanas et al.,
SERPICO 2022 - Special Session on Diagnostic, Prognostic, and Phenotyping Models from Mined Administrative Healthcare Data
328

Table 1: Breakdown of the dysphonia measures used in the study.
Family of acoustic measures Brief description
N
umber o
f
measures
Jitter variants F0 perturbation 28
Shimmer variants Amplitude perturbation 21
Harmonics to Noise Ratio (HNR) and
Noise to Harmonics Ratio (NHR)
Signal to noise, and noise to signal ratios computed using
standard approaches relying on autocorrelation
4
Glottis Quotient (GQ)
Vocal fold cycle duration changes, quantified by focusing
on specific glottal opening and glottal closure periods,
quantified using DYPSA (Naylor et al., 2007)
3
Glottal to Noise Excitation (GNE)
Extent of noise in speech using energy and nonlinear energy
concepts
6
Vocal Fold Excitation Ratio (VFER)
Extent of noise in speech using energy, nonlinear energy,
and entropy concepts
9
Empirical Mode Decomposition
Excitation Ratio (EMD-ER)
Signal to noise ratios using EMD-based energy, nonlinear
energy, and entropy
6
Mel Frequency Cepstral Coefficients
(MFCC)
Amplitude and spectral fluctuations on the Mel scale
quantifying envelope and high frequency aspects
39
F0 related
Comparisons of F0 against age and gender matched
controls, including probabilistic variabilities
3
Wavelet-based coefficients
Amplitude, scale, and envelope fluctuations quantified
using wavelet coefficients, and processing with entropy,
Teager-Kaiser Energy, signal energy, and signal to noise
ratios
182
Pitch Period Entropy (PPE)
Variability of F0 expressing inefficiency of F0 stability
over and above the variability exhibited by healthy controls
1
Detrended Fluctuation Analysis (DFA) Stochastic self-similarity of turbulent noise 1
Recurrence Period Density Entropy
(RPDE)
Uncertainty in estimation of F0 1
Algorithmic expressions for the dysphonia measures summarized above are described in detail in (Tsanas, 2012; Tsanas, 2013). The
MATLAB source code for the computation of the dysphonia measures is freely available from https://www.darth-group.com/software and
also from https://github.com/ThanasisTsanas/VoiceAnalysisToolbox). F0 refers to fundamental frequency estimates, here computed using
SWIPE (Camacho and Harris, 2008).
2012; Tsanas, 2012; Tsanas et al., 2014a; Arora,
Baghai-Ravary, Tsanas, 2019; Tsanas et al., 2021),
and other applications, e.g. processing voice fillers
(Tsanas and Gomez-Vilda, 2013; San Segundo,
Tsanas, Gomez-Vilda, 2017). We have described in
detail previously the background, rationale, and
detailed algorithmic expressions for the computation
of the dysphonia measures (Tsanas, 2012; Tsanas,
2013). A concise summary of the extracted dysphonia
measures is summarized in Table 1 including the
number of dysphonia measures for each algorithmic
family and a brief description.
The fundamental frequency (F0) is a key speech
characteristic, and its estimation is a prerequisite for
the computation of many dysphonia measures, e.g.
for jitter, and Pitch Period Entropy (PPE). There are
many algorithms in the research literature for F0
estimation (Roark, 2006; Tsanas et al., 2014b); in this
study, we used the Sawtooth Waveform Inspired
Pitch Estimator (SWIPE) algorithm (Camacho and
Harris, 2008), which we had previously demonstrated
is the most accurate F0 estimation algorithm for
sustained vowel /a/ phonations (Tsanas et al., 2014b).
Applying the dysphonia measures to each
sustained vowel /a/ phonation gives rise to 307
features which are continuous random variables.
Therefore, we have a 11,942×304 data matrix that we
aim to process further to map onto the binary outcome
(0 was used to denote controls and 1 to denote PwP).
Exploring Feature Selection and Feature Transformation Techniques to Improve Telephone-based Biomedical Speech Signal Processing
towards Parkinson’s Assessment
329

3.3 Dimensionality Reduction
A high dimensional dataset may lead to statistical
learning performance degradation and obfuscates the
understanding of clear patterns in a dataset. This well-
known problem is often referred to as the curse of
dimensionality (Guyon et al. 2006; Hastie, Tibshirani,
Friedman, 2009). Following Occam’s razor, we would
prefer a predictive model which is as simple as
possible, i.e. with a low dimensionality. This approach
is typically referred to as dimensionality reduction, and
can be achieved either by feature transformation
(transforming the features to populate a new, lower
dimensional space), or by feature selection (choosing a
subset of features). Feature selection is often more
suitable in clinical settings to retain the interpretability
of the original features (Guyon et al., 2006; Tsanas,
Little, McSharry, 2013), although in some applications
linear feature transformation techniques may operate
well and lead also to interpretable embedded (derived)
features where the computed latent variables may be
interpretable (van der Maaten et al., 2008a; Tsanas et
al., 2017).
Here, we explored both feature selection and
feature transformation approaches. Specifically, we
applied Principal Component Analysis (PCA) and
Independent Component Analysis (ICA), two
commonly used feature transformation methods
which aim to project the original data onto a new
feature space, which might lead to better prediction
performance (see van der Maaten et al., 2008a for
details). Whereas in PCA the resulting components
are ranked in terms of explaining the variance in the
dataset, in ICA there is no direct ranking that we
could use to understand which components should be
selected first. Therefore, the transformed features that
were computed using ICA were fed into the feature
selection algorithms (described in the next paragraph)
to decide on the transformed features to be presented
into the statistical learner. For ICA we used the
fastICA implementation.
For feature selection, we used (1) GSO; (2)
LOGO (Sun et al., 2010), a feature weighting
algorithm which implicitly also provides an estimate
of the “importance” of each feature to obtain the
ranked features; (3) minimal Redundancy Maximal
Relevance (mRMR) (Peng et al., 2005); (4) L1-LSMI
(Jitkrittum et al., 2013), and (5) SPECCMI (. In all
cases we aimed to process the top-50 selected features
from each of the algorithms. We remark that we used
GSO in the original study (Arora, Baghai-Ravary and
Tsanas, 2019) so here wanted to experiment with
different feature selection algorithms to explore
whether they bring any performance improvement.
Feature were selected using 90% of the data and
finally applying a feature selection voting strategy as
described in previous studies (Tsanas, 2012; Tsanas
et al., 2014a). We aimed to use diverse feature
selection algorithms which have been used in
different applications both to assess how stable
findings across the different feature selection
algorithms are, and also to determine whether any of
these lead to better overall classifier performance (see
the following section).
3.4 Statistical Exploration and
Mapping
We explored the statistical associations in the dataset
using standard Spearman correlation coefficients,
considering a relationship statistically strong if the
magnitude of the correlation coefficient was at least
0.3, following standard recommendation in the
medical field (Tsanas et al., 2013). This was towards
exploring both the original features and also the
transformed features from PCA and ICA to determine
whether the transformation has led to substantial
improvement in terms of feature association with the
response.
Subsequently, we used a Random Forest (RF)
algorithm, which is known to be very robust and has
been described as ‘best off-the-shelf’ algorithm for
statistical learning (Hastie, Tibshirani, Friedman,
2009). We used the default parameters (500 trees, the
number of features over which to search for the
optimal split was the square root of the number of
features, and in the end used majority voting to
determine the RF output).
3.5 Model Validation
Given the dataset is highly unbalanced ( >80%
samples belong to the dominant class, control
participants) a setting which is known to be
particularly challenging for statistical learning
models (Hastie, Tibshirani, Friedman, 2009), we
wanted to focus on a balanced dataset to avoid class
dominance problems. Specifically, we randomly
selected 1500 samples from PwP and 1500 samples
from controls to create a balanced binary
classification dataset (n=3000 samples) which will be
used to select features (or transform features), and
train the RF. We used the selected feature subset
applying standard 10-fold Cross Validation (CV) to
empirically compare performance as a function of the
number of features presented into RF.
SERPICO 2022 - Special Session on Diagnostic, Prognostic, and Phenotyping Models from Mined Administrative Healthcare Data
330
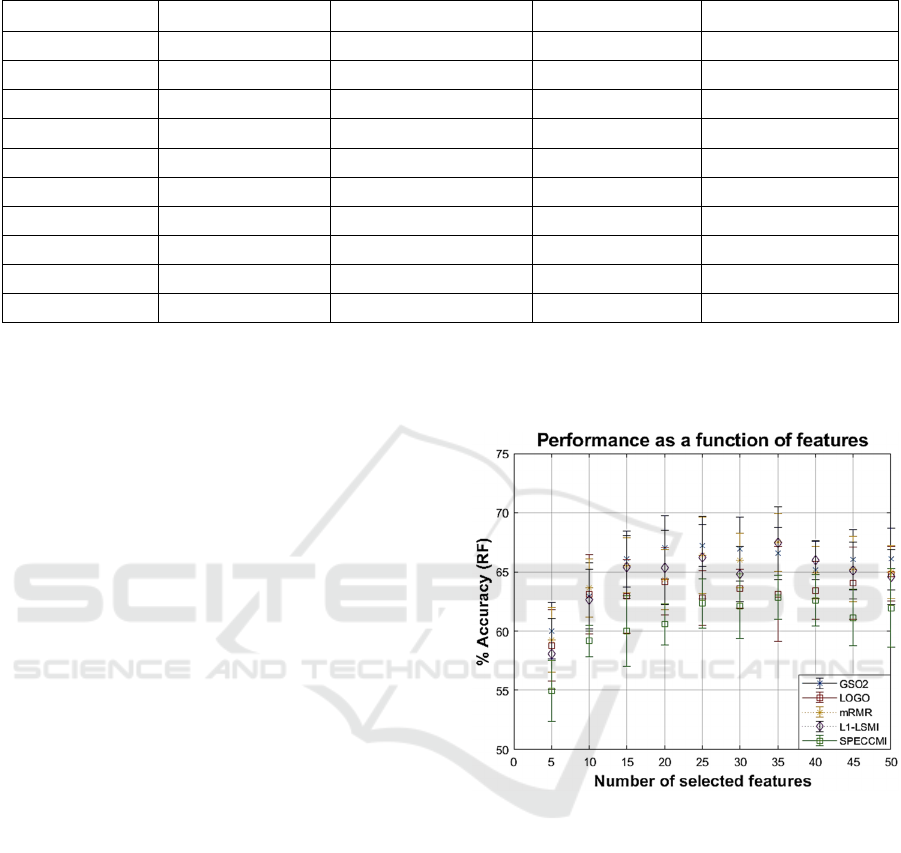
Table 2: Summary of selected features in descending order for each of the feature selection algorithms.
GSO LOGO mRMR L1-LSMI SPECCMI
Jitter->F0_TKEO_prc25 det_entropy_log_6_coef Jitter->F0_TKEO_prc95 DFA det_LT_TKEO_mean_7_coef
MFCC_4th coef MFCC_2nd coef 6th delta 6th delta det_LT_TKEO_std_7_coef
6th delta MFCC_4th coef Jitter->pitch_TKEO_prc5 det_entropy_log_6_coef det_LT_entropy_shannon_7_coef
MFCC_0th coef Jitter->F0_TKEO_prc95 VFER->SNR_SEO det_LT_entropy_log_3_coef Jitter->F0_TKEO_prc5
det_entropy_log_6_coef MFCC_0th coef VFER->std MFCC_2nd coef det_TKEO_mean_7_coef
app_TKEO_std_2_coef 6th delta DFA app_LT_entropy_log_3_coef app_entropy_log_5_coef
MFCC_9th coef app_LT_entropy_log_4_coef Jitter->pitch_PQ5_classical_Baken MFCC_5th coef app_LT_entropy_log_1_coef
IMF->NSR_TKEO app_LT_entropy_log_5_coef IMF->NSR_TKEO MFCC_4th coef det_LT_entropy_shannon_6_coef
Jitter->pitch_TKEO_prc25 MFCC_6th coef Jitter->F0_TKEO_prc5 app_LT_entropy_log_2_coef det_entropy_shannon_6_coef
MFCC_6th coef app_LT_entropy_log_3_coef MFCC_9th coef IMF->NSR_TKEO det_entropy_log_6_coef
For brevity we only present the top-10 selected features using the feature selection algorithms. For further explanation on these dysphonia
measures we refer to Tsanas (2012) and the associated toolbox freely available from https://www.darth-group.com/software and also from
https://github.com/ThanasisTsanas/VoiceAnalysisToolbox).
4 RESULTS
We started analysis by computing the correlation
coefficients of the original features. Overall, the
highest correlation coefficient was 0.14, which
already indicates this is a challenging binary
classification task. Next we computed the
transformed features using PCA and ICA and
computed the correlation coefficients: we found that
there was some minor improvement with a few more
variables exhibiting correlation coefficients with a
magnitude over 0.1, however again the highest
correlation coefficient we obtained was 0.16.
Then, we applied the feature selection algorithms
to determine the top-50 features for each algorithm.
Results are summarized in Table 2, where for brevity
we only included the top-10 features for the five feature
selection algorithms. We remark that the feature sets
obtained are quite different, although some of the
MFCCs appear to be consistently selected indicating
this is an algorithmic family that contributes to the
binary differentiation task. Similarly, many of the
wavelet features appear regularly across the feature
selection algorithms, which suggests this generic
approach of quantifying signal properties is also well-
suited to differentiating PwP from controls.
Next, we present in Figure 1 the out of sample
performance as a function of the number of features
presented into the RF for the feature selection
algorithms. This enables the exploration of different
combinations and also towards identifying a
parsimonious model where the inclusion of additional
features is not contributing to improving the model
Figure 1: Out of sample performance as a function of the
presented features into the RF, for each of the five feature
selection algorithms.
performance (or indeed leads to performance
degradation).
The results in Figure 1 suggest that we can
differentiate PwP from controls with 67.5% accuracy
using 35 features selected using either mRMR or L1-
LSMI. We remark that L1-LSMI generally performs
very well in this dataset, whereas SPECCMI clearly
underperforms by comparison.
When we tried using the transformed features into
the RF classifier the best performance obtained was
66.5%, so for this particular dataset it appears that
feature transformation has not provided any
additional benefits to improve performance.
Exploring Feature Selection and Feature Transformation Techniques to Improve Telephone-based Biomedical Speech Signal Processing
towards Parkinson’s Assessment
331

5 DISCUSSION
We investigated the potential of differentiating PwP
and controls using telephone-recorded speech
collected under acoustically non-controlled
conditions exploring different feature selection and
feature transformation methods. We found that the
most frequently used feature transformation methods,
PCA and ICA do not appear to provide any
improvement in the classification accuracy compared
to the investigated feature selection approaches.
Overall, we found that we can differentiate the two
groups with about 67% accuracy, which improves on
(Arora, Baghai-Ravary and Tsanas, 2019).
Compared to the earlier study (Arora, Baghai-
Ravary and Tsanas, 2019) which pooled together all
the available data in PVI, here we focused only on a
balanced subset of 3000 participants from the Boston
cohort in PVI. The underlying reason is that focusing
on participants coming from the same linguistic
background, even when only processing sustained
vowel /a/ phonations, would mitigate potential
differences. Moreover, by selecting a balanced subset
of the data we overcome the common challenging
setting where the dominant class may skew the
classifier’s outputs. This has indeed led to some
performance improvement (previously the best
performing model in (Arora, Baghai-Ravary and
Tsanas, 2019) led to 63.7% balanced accuracy,
whereas here we report 67% accuracy (which by
definition coincides with the balanced accuracy given
we have a balanced dataset).
We found that although the feature transformation
methods explored herein (PCA and ICA) led to some
transformed features that univariately were slightly
better correlated with the response compared to the
original features, when taken jointly they did not lead
to better classification outcomes. Therefore, we did
not pursue this further since feature transformation
methods also have the disadvantage that the resulting
models are less interpretable. It is possible that some
more convoluted feature transformation methods
(e.g. see van der Maaten et al., 2008a) might perform
better here, and this is an area that needs to be
explored in further work. Also, we did not explore
further data visualization approaches to explore
projected feature subsets, which may provide
tentative insights into the differences of samples
between classes (van der Maaten et al., 2008b).
Previous work that used the entire PVI dataset
(Arora, Baghai-Ravary and Tsanas, 2019) and GSO
to determine the best performing feature subset using
the same methodology as explored in this study led to
quite different features. This likely supports earlier
findings that even for sustained vowels there may be
subtle differences given the linguistic background of
participants. In turn, this has important implications
towards developing generalizable tools across
cohorts of participants coming from different
linguistic backgrounds.
We found that substantially different feature
subsets (using mRMR and L1-LSMI) lead to very
similar performance in the RF. This likely indicates
the presence of different Markov blankets in the
dataset, where quite different features lead to similar
out of sample performance. This is in accordance to
previous findings in this field with different speech-
PD datasets (e.g. see Tsanas 2012) and possibly
underlines the fact there may be different underlying
combinations of features which essentially can jointly
capture the key acoustic characteristics towards
differentiating PwP from controls.
We remark that although the reported
performance is comparably low to apply this tool in
clinical practice currently, it is possible that it could
be used as an early indicator, particularly given there
is practically no cost to deploy the use of sustained
vowels in practice and collect data through standard
telephone networks. It is likely that in combination
with additional signal modalities (e.g. walking) and
other tests that can be collected using smartphones
(e.g., see Tsanas et al., 2020; Woodward et al., in
press), we will be able to develop an affordable and
practical tool to change contemporary PD screening
and facilitate early diagnosis.
Collectively, this study’s findings are a step
towards developing a robust, effective and cost-
efficient tool to screen for PD at large.
ACKNOWLEDGEMENTS
We are grateful to Max Little who led the Parkinson’s
Voice Initiative where the data for this study was
collected, and to Ladan Baghai-Ravary for
developing the data collection process using the
Aculab servers. We would like to extend our thanks
to all participants in the PVI study. The study was
made possible through generous funding via an
EPSRC-NCSML award to AT and SA.
REFERENCES
Arora, S. Visanji, N.P., Mestre, T.A., Tsanas, A., Al
Dakheel, A., Connolly, B.S., Gasca-Salas, C., Kern,
D.S., Jain, J., Slow, E.J., Faust-Socher, A., Lang, A.E.
Little, M.A., Marras C. 2018. Investigating voice as a
SERPICO 2022 - Special Session on Diagnostic, Prognostic, and Phenotyping Models from Mined Administrative Healthcare Data
332

biomarker for leucine-rich repeat kinase 2-associated
Parkinson’s disease: a pilot study, Journal of
Parkinson’s Disease, Vol. 8(4), pp. 503-510
Arora, S., Baghai-Ravary, L., Tsanas A. 2019. Developing
a large scale population screening tool for the
assessment of Parkinson’s disease using telephone-
quality speech, Journal of Acoustical Society of
America, Vol. 145(5), 2871-2884
Arora, S., Tsanas A. 2021a. Assessing Parkinson’s Disease
at Scale using Telephone-recorded Speech: Insights
from the Parkinson’s Voice Initiative, Diagnostics, Vol.
11:1892
Arora, S., Lo, C., Hu, M., Tsanas A. 2021b. Smartphone
speech testing for symptom assessment in rapid eye
movement sleep behavior disorder and Parkinson’s
disease, IEEE Access, Vol. 9, pp. 44813-44824
Bishop, C.M. 2006. Pattern recognition and machine
learning, Springer
Camacho, A., Harris, J.G. 2008. A sawtooth waveform
inspired pitch estimator for speech and music, Journal
of the Acoustical Society of America, Vol. 124, 1638-
1652
Dorsey, E.R., George, B.P., Leff, B., Willis A.W. 2013. The
coming crisis: obtaining care for the growing burden of
neurodegenerative conditions, Neurology, Vol. 80,
1989-1996
Duda, R.O., Hart, P.E., Stork, D.G. 2001. Pattern
classification, Wiley-interscience, 2nd ed.
GBD 2016 Parkinson's Disease Collaborators 2018. Global,
regional, and national burden of Parkinson’s disease,
1990–2016: a systematic analysis for the Global Burden
of Disease Study 2016. The Lancet Neurology, Vol. 17,
pp. 939-953
GBD Neurological Disorders Collaborators 2021. Burden
of Neurological Disorders Across the US From 1990-
2017: A Global Burden of Disease Study. JAMA
Neurology, Vol. 78(2), pp. 165-176
Gomez-Vilda, P., Mykyska, J., Gomez, A., Palacios, D.,
Rodellar, V., Alvarez A. 2019. Characterization of
Parkinson’s disease dysarthria in terms of speech
articulation kinematics, Biomedical Signal Processing
and Control, Vol. 52, 312-320
Gorriz, J.M., Ramirez, J., Ortiz, A., et al. (2020). Artificial
intelligence within the interplay between natural and
artificial computation: advances in data science, trends
and applications, Neurocomputing, Vol. 410, pp. 237-
270
Guyon, I., Gunn, S., Nikravesh, M., Zadeh, L.A. (Eds.)
2006. Feature Extraction: Foundations and
Applications, Springer
Hartelius L., Svensson P. 1994. Speech and swallowing
symptoms associated with parkinson‘s disease and
multiple sclerosis: A survey, Folia Phoniatr. Logop.,
Vol. 46, pp. 9- 17
Hastie, T. Tibshirani, R. Friedman J. 2009. The elements of
statistical learning: data mining, inference, and
prediction, Springer, 2nd ed.
Horne, E., Tibble, H. Sheikh, A., Tsanas A. 2020.
Challenges of clustering multimodal clinical data: a
review of applications in asthma subtyping, JMIR
Medical Informatics, Vol. 8(5), e16452
Jitkrittum, W., Hachiya, H. and Sugiyama, M. (2013)
Feature selection via L1-penalized squared-loss mutual
information, IEICE Transactions on Information and
Systems, E96-D(7), pp. 1513–1524
Lewis, S.J.G., Foltynie, T., Blackwell, A.D., Robbins,
T.W., Owen, A.m., Barker R.A. 2005. Heterogeneity of
Parkinson’s disease in the early clinical stages using a
data driven approach, Journal of Neurology,
Neurosurgery and Psychiatry, Vol. 76, 343-348
Mu, J., Chaudhuri, K.R., Bielza, C., de Pedro-Cuesta, J.,
Larranaga, P., Martinez-Martin, P. 2017. Parkinson’s
disease subtypes identified from cluster analysis of
motor and non-motor symptoms, Frontiers in Aging
Neuroscience, 9:301
Naylor, P.A., Kounoudes, A., Gudnason J., Brookes, M.
(2007). Estimation of glottal closure instants in voiced
speech using the DYPSA algorithm, IEEE Transactions
on Audio, Speech, and Language Processing, Vol.
15(1), pp. 34-43
Olanow, C.W., Stern, M.B., Sethi,K. 2009. The scientific
and clinical basis forthe treatment of Parkinson disease,
Neurology, Vol. 72 (21 Suppl 4) s1-s136
Peng, H., Long., F., Ding, C. 2005. Feature Selection Based
on Mutual Information: Criteria of Max-Dependency,
Max-Relevance, and Min-Redundancy, IEEE
Transactions on pattern analysis and machine
intelligence, Vol. 27, pp. 1226-1238
Roark, R.M. 2006. Frequency and Voice: Perspectives in
the Time Domain, Journal of Voice, Vol. 20(3), pp.
325-354
Rueda, A., Krishnan, S., 2018. Clustering Parkinson’s and
age-related voice impairment signal features for
unsupervised learning, Advances in Data Science and
Adaptive Analysis, Vol. 10(2);1840007
San Segundo, E., Tsanas, A., Gomez-Vilda, P., 2017.
Euclidean distances as measures of speaker similarity
including identical twin pairs: a forensic investigation
using source and filter voice characteristics, Forensic
Science International, Vol. 270, pp.25-38
Sheaves, B., Porcheret, K., Tsanas, A., Espie, C., Foster, R.,
Freeman, D., Harrison, P.J., Wulff, K., Goodwin, G.M.
2016. Insomnia, nightmares, and chronotype as markers
of risk for severe mental illness: results from a student
population, Sleep, Vol. 39(1), pp. 173-181
Sun, Y., Todorovic, S., Goodison, S. 2010. Local-learning-
based feature selection for high-dimensional data
analysis, IEEE Transactions on Pattern Analysis and
Machine Intelligence, Vol. 32(9), pp. 1610-1626
Titze, I.R. 2000. Principles of Voice Production. National
Center for Voice and Speech, Iowa City, US, 2nd
printing
Triantafyllidis, A.K., Tsanas A. 2019. Applications of
machine learning in real-life digital health
interventions: review of the literature, Journal of
Medical Internet Research (JMIR), Vol. 21(4), e12286
Tsanas, A., Little, M.A., McSharry, P.E., Ramig, L.O.
2010a. New nonlinear markers and insights into speech
signal degradation for effective tracking of Parkinson’s
Exploring Feature Selection and Feature Transformation Techniques to Improve Telephone-based Biomedical Speech Signal Processing
towards Parkinson’s Assessment
333

disease symptom severity, International Symposium on
Nonlinear Theory and its Applications (NOLTA), pp.
457-460, Krakow, Poland, 5-8 September
Tsanas, A., Little, M.A., McSharry, P.E., Ramig, L.O.
2010b. Enhanced classical dysphonia measures and
sparse regression for telemonitoring of Parkinson's
disease progression, IEEE Signal Processing Society,
International Conference on Acoustics, Speech and
Signal Processing (ICASSP), pp. 594-597, Dallas,
Texas, US, 14-19 March 2010
Tsanas, A., Little, M.A., McSharry, P.E., Ramig, L.O.
2010c. Accurate telemonitoring of Parkinson’s disease
progression by non-invasive speech tests, IEEE
Transactions on Biomedical Engineering, Vol. 57, pp.
884-893
Tsanas, A., Little, M.A., McSharry, P.E., Ramig, L.O.
2011. Nonlinear speech analysis algorithms mapped to
a standard metric achieve clinically useful
quantification of average Parkinson’s disease symptom
severity, Journal of the Royal Society Interface, Vol. 8,
pp. 842-855
Tsanas, A., Little, M.A., McSharry, P.E., Spielman, J.,
Ramig, L.O. 2012. Novel speech signal processing
algorithms for high-accuracy classification of
Parkinson’s disease, IEEE Transactions on Biomedical
Engineering, Vol. 59, 1264-1271
Tsanas A. 2012. Accurate telemonitoring of Parkinson’s
disease symptom severity using nonlinear speech signal
processing and statistical machine learning, Ph.D.
thesis, Oxford Centre for Industrial and Applied
Mathematics, University of Oxford
Tsanas A. 2013. Acoustic analysis toolkit for biomedical
speech signal processing: concepts and algorithms, 8th
International Workshop on Models and Analysis of
Vocal Emissions for Biomedical Applications
(MAVEBA), pp. 37-40, Florence, Italy, 16-18
December
Tsanas, A., Gómez-Vilda P., 2013. Novel robust decision
support tool assisting early diagnosis of pathological
voices using acoustic analysis of sustained vowels,
Multidisciplinary Conference of Users of Voice, Speech
and Singing (JVHC 13), pp. 3-12, Las Palmas de Gran
Canaria, 27-28 June
Tsanas, A. Little, M.A., McSharry P.E. 2013. A
methodology for the analysis of medical data, in
Handbook of Systems and Complexity in Health, Eds.
J.P. Sturmberg, and C.M. Martin, Springer, pp. 113-125
(chapter 7)
Tsanas, A., Little, M.A., Fox, C., Ramig L.O. 2014a.
Objective automatic assessment of rehabilitative speech
treatment in Parkinson’s disease, IEEE Transactions on
Neural Systems and Rehabilitation Engineering, Vol.
22, 181-190
Tsanas, A., Zañartu, M., Little, M.A., Fox, C., Ramig, L.O.,
Clifford, G.D. 2014b. Robust fundamental frequency
estimation in sustained vowels: detailed algorithmic
comparisons and information fusion with adaptive
Kalman filtering, Journal of the Acoustical Society of
America, Vol. 135, 2885-2901
Tsanas, A., Saunders, K.E.A., Bilderbeck, A.C., Palmius,
N., Goodwin, G.M., De Vos, M. 2017. Clinical insight
into latent variables of psychiatric questionnaires for
mood symptom self-assessment, JMIR Mental Health,
Vol. 4, No. 2, pp. e15
Tsanas A. 2019. New insights into Parkinson’s disease
through statistical analysis of standard clinical scales
quantifying symptom severity, 41st IEEE Engineering
in Medicine in Biology Conference (EMBC), Berlin,
Germany, 23-27 July
Tsanas, A., Arora S. 2019. Biomedical speech signal
insights from a large scale cohort across seven
countries: the Parkinson’s voice initiative study,
Models and Analysis of Vocal Emissions for Biomedical
Applications, Florence, Italy, 17-19 December 2019
Tsanas, A., Arora S. 2020. Large-scale clustering of people
diagnosed with Parkinson’s disease using acoustic
analysis of sustained vowels: findings in the
Parkinson’s voice initiative study, 13th International
Joint Conference on Biomedical Systems and
Technology (BIOSTEC), pp. 369-376, Malta, 26-28
February 2020
Tsanas, A., Woodward, E., Ehlers, A. 2020. Objective
characterization of activity, sleep, and circadian rhythm
patterns using a wrist worn sensor: insights into post-
traumatic stress disorder, JMIR mHealth and uHealth,
Vol. 8(4), pp. e14306
Tsanas, A., Little, M.A., Ramig L.O. 2021. Remote
assessment of Parkinson’s disease symptom severity
using the simulated cellular mobile telephone network,
IEEE Access, Vol. 9, pp. 11024-11036
Tsanas, A., Arora S. 2021a. in the Parkinson’s voice
initiative study, 14th International Joint Conference on
Biomedical Systems and Technology (BIOSTEC), pp.
124-131, Vienna, Austria, 11-13 February 2021
Tsanas, A. Arora S. 2021b. Acoustic analysis of sustained
vowels in Parkinson’s disease: new insights into the
differences of UK- and US-English speaking
participants from the Parkinson’s voice initiative,
MAVEBA, Florence, Italy, 14-16 December
Woodward, K. Kanjo, E., Brown, D., et al. (2020). Beyond
mobile apps: a survey of technologies for mental well-
being, IEEE Transactions Affective Computing, (in
press)
van der Maaten, L.P.J., Postma, E.O., van den Herik, H.J.
2008a. Dimensionality reduction: a comparative
review, Technical Report, University of Tilburg
van der Maaten, L.J.P., Hinton, G.E. 2008b. Visualizing
high-dimensional data using t-SNE, Journal of
Machine Learning Research , Vol. 9, pp. 2579-2605
Vinh, X. N., Chan, J., Romano, S., Bailey, J. (2014)
Effective global approaches for mutual information
based feature selection, in Proceedings of the ACM
SIGKDD International Conference on Knowledge
Discovery and Data Mining, pp. 512–521. doi:
10.1145/2623330.2623611
SERPICO 2022 - Special Session on Diagnostic, Prognostic, and Phenotyping Models from Mined Administrative Healthcare Data
334
