
Adaptive Control of Cardio-respiratory Training in a Virtual Reality
Hiking Simulation: A Feasibility Study
Rodrigo Lima
1,3 a
, Muhammad Asif
1,3 b
, Honorato Sousa
2 c
and Sergi Berm
´
udez I Badia
1,3 d
1
Faculdade de Ci
ˆ
encias Exatas e da Engenharia, Universidade da Madeira, Funchal, Portugal
2
Faculdade de Ci
ˆ
encias do Desporto e Educac¸
˜
ao F
´
ısica, Universidade de Coimbra, Coimbra, Portugal
3
NOVA Laboratory for Computer Science and Informatics, Caparica, Portugal
Keywords:
Hiking Simulator, Virtual Reality, Cardiorespiratory Fitness, Biocybernetic Loops, Heart Rate, User Experience, Control,
Adaptation.
Abstract:
Adaptive Virtual Reality applications are a novel way to enhance and promote higher levels of physical activity and car-
diorespiratory fitness, leading to a healthier lifestyle and avoid cardiovascular diseases. In this study, we developed a system
using a virtual hiking simulator, the Levadas from Madeira Island, that aims to increase the compliance of recommendations
levels of exertion by implementing a closed-loop adaptation according to the heart rate. The system was tested with a sample
of twenty healthy young adults on a repeated measures design, comparing the adaptive VR, a non-adaptive VR version of
the software, and a non-VR version. Perceived exertion, presence, usability and intrinsic motivation were assessed. The
results from the study reveal that the adaptive control according to the heart rate promoted approximately 20% more time of
exertion in the recommended target heart rate zone, while perceiving lower levels of exertion by the participants, compared
to the non-adaptive condition.
1 INTRODUCTION
Physical inactivity has been recognized as the fourth
leading cause of death worldwide (Lee et al., 2012).
A sedentary lifestyle is considered a sole risk fac-
tor for cardiovascular diseases, which account for ap-
proximately 30% of global mortality. Thus promot-
ing an increase in physical activity in people of all
ages will help in reducing the risk of cardiovascular
diseases (Hoffmann et al., 2015). A novel way to in-
crease physical activity is to use exergames to exer-
cise and promote health and well-being (Mu
˜
noz et al.,
2018). Exergames are digital games that require the
usage of the whole-body to control a game, increas-
ing the physical activity level, potentially improving
the physical fitness components, such as endurance,
strength, balance and flexibility (Oh and Yang, 2010).
According to the American College of Sports and
Medicine (ACSM), exergaming can be described as
a healthy and beneficial form of exercising by en-
gaging and challenging the participants to play (Dean
et al., 1998). Several studies have shown that ex-
ergames can enhance enjoyment and intrinsic moti-
vation compared to traditional exercises and are effi-
a
https://orcid.org/0000-0002-4030-9526
b
https://orcid.org/0000-0002-9091-9381
c
https://orcid.org/0000-0002-7434-643X
d
https://orcid.org/0000-0003-4452-0414
cient to promote physical and mental health (Pluchino
et al., 2012; Rosenberg et al., 2010).
Although not strictly a computer game, the system
used in this paper is a Virtual Reality (VR) simula-
tion of a pleasant real-life experience (Ahmad, 2021).
In recent years, VR technologies have made much
progress and many VR systems have been introduced.
The usage of VR technology is trending because it
provides a high level of immersion - the extent to
which the VR system delivers sensations from the
real world to the virtual world (Bailenson et al., 2008;
Stasie
˜
nko and Sarzy
´
nska-Długosz, 2016). In particu-
lar, systems such as CAVE (Cave Automatic Virtual
Environment) have been reported to be effective to
immerse and engage participants during VR experi-
ences (Gonc¸alves et al., 2021).
VR-based applications are being used for athletic
training, fitness training, and high-intensity interval
training, as the full-body interaction and high im-
mersive experience are the main advantages of using
VR technology for cardiorespiratory training (Shep-
herd et al., 2018). Recent studies have established
that VR applications can increase enjoyment, motiva-
tion and engagement, contrary to traditional exercises,
such as cycling and running. Garcia et al. (Garcia
et al., 2016) investigated the feasibility and efficacy
of Kinect-based stepping exergame, and reported im-
provements of participants in stepping, standing bal-
Lima, R., Asif, M., Sousa, H. and Bermúdez i Badia, S.
Adaptive Control of Cardio-respiratory Training in a Virtual Reality Hiking Simulation: A Feasibility Study.
DOI: 10.5220/0011004400003123
In Proceedings of the 15th International Joint Conference on Biomedical Engineering Systems and Technologies (BIOSTEC 2022) - Volume 4: BIOSIGNALS, pages 91-99
ISBN: 978-989-758-552-4; ISSN: 2184-4305
Copyright
c
2022 by SCITEPRESS – Science and Technology Publications, Lda. All rights reserved
91

ance, gait speed, and mobility. Christos Ioannou et
al. (Ioannou et al., 2019), introduced the concept of
Virtual Performance Augmentation (VPA) of running
and jumping in-place. They reported that VPA can
induce moderate to high physical activity levels, in-
creasing intrinsic motivation and general physical ac-
tivity motivation, and perceived competence and flow.
Huang et al. assessed the effect of immersion on
the perceived exertion by using a stationary bicycle-
based training system (Huang et al., 2008). They
compared perceived exertion in PC-Desktop screen,
a projector, Head Mounted Displays (HMD), and a
non-VR system. A significantly lower perceived ex-
ertion was found in the HMD and projector condi-
tions when compared to non-VR. No significant dif-
ference was found between HMD and projector con-
ditions. The outcomes of this study were consistent
with (Mestre et al., 2011), who compared immersive
VR with virtual feedback and no 3D computer gener-
ated feedback setups. They reported lower perceived
exertion and higher excitement in the immersive VR
environment.
Although these VR applications have shown the
potential to improve the cardiorespiratory training,
training intensity is often lower than what is expected
to be the fitness recommendations (Dean et al., 1998).
Thus, to maintain the player’s training intensity, one
possibility is to monitor the user and adapt the VR ap-
plicationin response. This adaptation allows changing
the training load required to achieve the desired levels
of exertion (Hoffmann et al., 2015). Here, a closed-
loop control approach was implemented using the
biocybernetic-loop-engine (BLEngine) (Mu
˜
noz et al.,
2017) to monitor the heart rate (HR) and adapt a vir-
tual hike experience to control the intensity of the ex-
ercise performed by the participants. We aimed to ad-
dress the following research questions:
• RQ1: Can an adaptive system successfully manip-
ulate training intensity?
• RQ2: Can an adaptive system effectively keep
participants in the desired target HR zone?
• RQ3: How does an adaptive system compare to
its non-adaptive counterpart?
• RQ4: What is the impact of VR feedback on per-
ceived exertion levels and motivation?
2 METHODOLOGY AND
MATERIALS
2.1 Participants
The participants were recruited from a convenience
sample of volunteer subjects, all university students
and workers. Twenty-two healthy adults (12 females,
10 males) volunteered to participate in this study. Two
participants were excluded from the study: a male
participant due to a technical error and a female par-
ticipant decided to withdraw due to virtual reality
sickness. The sample considered for the analysis was
composed of the remaining 20 participants, with an
average age of 29 years old. The demographical in-
formation of the participants is described in Table 1.
Table 1: Sample statistics.
(n=20) Mean STD Min Max
Age 29,25 5,03 23,00 44,00
Height (cm) 168,95 9,06 159,00 191,00
Weight (kg) 64,35 14,16 47,00 102,00
BMI (kg/m
2
) 22,26 2,60 17,91 27,96
2.2 Experimental Setup
2.2.1 Hardware
The virtual environment was designed to work in a
CAVE with walls of 2.2 meters width and 2.8 me-
ters of height, using the KAVE software developed
by (Gonc¸alves and Badia, 2018). The display con-
sists of the front and lateral projections, as well as
a floor projection, thus it requires a computer with a
graphic card capable of displaying 4 screens simulta-
neously. A Kinect V2 (Microsoft, Redmond, USA)
body tracking sensor was used to track the full-body
of the participants (3D position of the 25 joints’ skele-
ton) (Gonc¸alves et al., 2021). A schematic version of
our CAVE setup is shown in Figure
A photoplethysmography (PPG) sensor was
used to measure the heart rate (HR) at rest during
the pre-assessment procedure (section 2.3.2) with
a wearable device, the Biosignalsplux (PLUX
- Wireless Biosignals, Lisboa). Finally the
HR at rest was computed with the Opensignals
software (PLUX-Wireless Biosignals, Lisboa)
(https://biosignalsplux.com/products/software/
opensignals.html).
To measure the HR of the participants during the
experiment, the HR chest band Polar H10 (Polar Elec-
tro Oy, Kempele, Finland) was placed on the par-
ticipants. The Polar H10 was paired with the Acti-
BIOSIGNALS 2022 - 15th International Conference on Bio-inspired Systems and Signal Processing
92

Figure 1: Schematic of our CAVE setup.
Graph’s WGT3X-BT accelerometer (Actigraph Cor-
poration, Pensacola, FL, USA) to measure physical
activity during the experiment. The metrics for phys-
ical activity were computed using the ActiLife6 soft-
ware (version 6.13.4, ActiGraph, Cary, NC, USA) to
process the accelerometer data.
2.2.2 Software
The environment simulated a Levada hiking track and
was developed by Ahmad et al (Ahmad, 2021). The
Levada track included computer-generated 3D ob-
jects, such as trees, mountains, tunnels and irriga-
tion canals, created with Unity3D Engine and Blender
software (Blender Foundation, Amsterdam, Nether-
lands) (Ahmad, 2021).
Then, an adaptation of the procedure in
(Gonc¸alves et al., 2016) was implemented in
the VR Levada environment, to determine a target
height at which the knee of the participant had to be
raised during stepping-in-place to progress in the VR
Levada hiking track. The initial height was calculated
by the Kinect, as the middle point between the hip
and the knee, so that it adjusts to people of different
height. The height of the hip and the knee were
set, respectively, as the boundaries of maximum and
minimum required heights during the adaptation.
2.3 Experimental Procedure
2.3.1 Pre-assessment
All participants performed a pre-assessment session
on a different day, previous to the experiment. In this
session, the HR at rest of each participant was mea-
sured to calculate their experimental target HR. The
participants also performed the 3-min YMCA Step
Test (Golding, 2000) to assess their physical fitness.
Figure 2: Example of our VR Levada hiking track. The
red dots represent the knees of the participant. The white
line represents the target height at which the knee had to be
raised.
2.3.2 HR at Rest
Participants were asked to sit and relax in a chair
placed in a quiet room for 5 minutes, without mov-
ing or speaking. Then the HR was computed using a
PPG sensor with the biosignalsplux wearable device.
The PPG sensor was placed on the index finger of the
left hand. The HR at rest of the participants was cal-
culated as the average HR of the 5 minutes using the
Opensignals software, as mentioned in section 2.2.1.
2.3.3 Target HR
The target HR for the experiment was calculated us-
ing the Karvonen formula (Karvonen and Vuorimaa,
1988). After computing the heart rate at rest, the max-
imum HR (HR
max
) was calculated using Equation 1.
Then the heart rate reserve (HRR), which is the differ-
ence between the maximum heart rate and the heart
rate at rest, was calculated using Equation 2. Finally,
the target HR was calculated using Equation 3, with a
target exercise intensity of moderate to vigorous (ap-
proximately 60% of the HRR), according to (Dean
et al., 1998).
HR
max
= 220 − Age (1)
HRR = HR
max
− HR
rest
(2)
TargetHR = (%intensity ∗ HRR) + HR
rest
(3)
2.3.4 3-min YMCA Step Test
The 3-min YMCA Step Test (Golding, 2000) was
used to assess the cardiorespiratory fitness of the par-
ticipants. To perform this test, a 30 cm step, a digi-
tal chronometer and metronome were used. First the
Adaptive Control of Cardio-respiratory Training in a Virtual Reality Hiking Simulation: A Feasibility Study
93

test procedure was explained to the participants by
demonstrating the cadence stepping. The metronome
was set to 96 beats per minute, with 4 clicks represent-
ing one step cycle: 1st beat - first foot up, 2nd beat -
second foot up, 3rd beat - first foot down, 4th beat -
second foot down. The duration of this test was 3 min-
utes. After completing the test, participants immedi-
ately sat down and the average HR for 1 min was as-
sessed using the same sensor as in section 2.3.2. The
classification of the cardiorespiratory fitness of our
participants was performed by comparing the scoring
of the 1-min post exercise average HR, with the age
adjusted standard ratings for this test. Our classifica-
tion is shown in Table 2.
Table 2: 3-min YMCA Step Test Classification.
Males
(n=9)
Females
(n=11)
Excellent 2 4
Good 1 0
Above Average 0 0
Average 2 1
Below Average 2 3
Poor 0 3
Very Poor 2 0
2.3.5 Protocol
This study is divided into two components: the study
of the adaptive control of HR and the study of the user
experience in the virtual environment. Participants
were provided with informed consent previously to
the pre-assessment session (Section 2.3.1).
After the pre-assessment session, a within-
subjects experimental design was used, in which par-
ticipants performed the three following conditions, on
consecutive days with an approximate time interval
of 24 hours: Adaptive VR Levada experiment (Ex-
perimental condition for VR adaptive control of HR
and user experience), Non-Adaptive VR Levada ex-
periment (Control condition for adaptive control of
HR) and Adaptive Non-VR experiment (Control con-
dition for the user experience).
For each experiment participants were asked to
wear the Polar HR chest band and the ActiGraph ac-
celerometer placed on the hip. The experiment con-
sisted of stepping in the same place at the pace of 125
beats per minute set by a metronome, with 2 clicks
representing one step cycle, as the participants were
stopped in the same place and had to raise their knees
up to a target height, to progress in the virtual hiking
track.
Each experiment had a total duration of 10 min: a
2-min warm-up to drive the participants to the target
HR zone, a 7-min training in the target HR zone, and
a 1-min cool-down. This timeline is shown in Figure
3.
At the end of each experiment, participants an-
swered a sickness/dizziness questionnaire, classified
the perceived exertion using the Rated Perceived Ex-
ertion Scale (RPE scale) (Borg, 1998), and for the test
and control conditions of the user experience, partic-
ipants answered the Witmer-Singer Presence Ques-
tionnaire (WSPQ) (McCall et al., 2004), the Slater-
Usoh-Steed Questionnaire (Slater et al., 1995) and the
Intrinsic Motivation Inventory (IMI) (Sheehan et al.,
2017; Mcauley et al., 1989).
0 1 2 3 4 5 6 7 8 9 10 min
Warm-up period
Training in target HR zone
Cool-down period
Figure 3: Timeline of each experiment.
2.4 Adaptive Control of HR
The main goal of the adaptive control of HR was to
drive participants to reach the target heart rate zone,
moderate to vigorous intensity (57% - 63%), as men-
tioned in section 2.3.3, and keep them inside that zone
during the whole training phase.
The cardiorespiratory fitness adaptation based on
the HR was performed using an updated version of
the Biocybernetic Loop Engine (BLEngine) (Mu
˜
noz
et al., 2017). The BLEngine received the real-time
HR data from the Polar H10 chest band using UDP
communication.
Then a proportional-integral-derivative controller
(PID controller) was implemented to adapt the height
to which the participants had to raise their knees while
stepping in place. Then, target height was adapted
every 5 seconds, according to the instantaneous HR
(HR
5sec
). For the warm-up phase, a linear regression
was calculated to drive the participant’s HR, between
the initial HR of the participant and the target HR, to
gradually increase the intensity of the exercise, so that
after 2 minutes of exercise, the participant reached the
intended HR zone.
The PID controller followed equation 4, with
K
p
= 0.03 is the proportional constant and K
d
= 5
is the derivative constant. The PID parameters were
tuned by performing several pilot tests prior to this
study, until the desired performance of the controller
was achieved.
These HR adaptive rules implemented on the
BLEngine software, are shown in Figure 4.
BIOSIGNALS 2022 - 15th International Conference on Bio-inspired Systems and Signal Processing
94

PID = K
p
∗
HR
target
− HR
5sec
+
K
d
∗
Error
current
− Error
previous
∆t
(4)
Figure 4: Adaptive HR rules used on the BLEngine soft-
ware.
2.5 Instruments
2.5.1 Physical Exertion Metrics
The data acquisition for the physiological signals was
performed with a custom-made log file implemented
on the BLEngine, to record all the HR related sig-
nals, and then all the HR metrics were computed us-
ing Python. For the accelerometer signals, the ActiL-
ife6 software provided all the required metrics.
Concerning the HR related metrics, the following
metrics were computed: Average HR, Percentage of
Time in Target HR Zone, considering 100% as being
the 10 min condition, and the root mean square error
(RMSE) between the HR and the target HR.
In terms of the accelerometer metrics, the METS,
vector magnitude, MVPA, and Percentage in Seden-
tary and Light exercise, were computed using the Ac-
tilife6 software.
Finally, a digital version of the OMNI Rated Per-
ceived Exertion (RPE) scale (Borg, 1998) was used to
assess the perception of exertion from the participants
after both conditions, in a 0 to 10 scale (0 - Extremely
Easy, 10 - Extremely Hard).
2.5.2 User Experience
To assess the user experience, the sickness and dizzi-
ness experienced by the participants during the VR
experience, a short brief questionnaire was answered
with a 5-point Likert Scale (1-none, 5-A lot). Also,
the Witmer-Singer’s Presence Questionnaire (WSPQ)
was used to assess the sense of presence. It includes
24 items addressing Involvement, Immersion, Visual
Fidelity, Interface Quality, and Sound, rated on a 7-
point Likert scale. Consistent with other studies,
items 20-22 related to sound were excluded. Items
23-24 related to haptics were not applicable for this
study (McCall et al., 2004).
The Intrinsic Motivation Inventory (IMI) was
used to assess intrinsic motivation. It is a multi-
dimensional measurement questionnaire, which is
comprised of seven sub-scales and used for several
studies including exercising and sports. The question-
naire contains the following sub-scales on a 7-point
Likert scale: Interest/Enjoyment, which is considered
to be the main self-report measure for this question-
naire (7 items), and Pressure/Tension, which is con-
sidered to be a negative predictor of intrinsic motiva-
tion (5 items) (Sheehan et al., 2017; Mcauley et al.,
1989).
The System Usability Scale (SUS), created by
(Brooke, 1995), was implemented to assess the ap-
plication’s usability. SUS comprises ten items and
allows a quick evaluation of the usability of a wide
variety of products and services, including hardware
and software.
2.6 Statistical Analysis
For the physiological signals statistical analysis, the
Kolmogorov-Smirnov normality test was used to as-
sess the normality of the data. Since the data was not
normally distributed, non-parametric statistical tests
were used. The Wilcoxon matched-pair signed ranks
test was used to compare conditions.
Regarding the statistical analysis for the question-
naires, all the data from the questionnaires are of or-
dinal nature (Likert Scale), thus non-parametric tests
were used to assess the significance of the results. The
Wilcoxon matched-pair signed ranks test was also
performed for the questionnaires. All the statistical
analysis was performed in SPSS Statistics version 26.
3 RESULTS
3.1 Adaptive Control of HR
Training in a specific heart rate zone has benefits and
helps improve cadiorespiratory performance, accord-
ing to the ACSM guidelines (Dean et al., 1998). To
measure the accuracy of the algorithm implemented
to drive and maintain the participants in the target
heart zone, the metrics related to the HR mentioned
in section 2.5.1 were analyzed.
When performing the statistical comparison,
we found no significant difference in the average
HR, between the Non-Adaptive VR (Mdn=142.02,
Range=70.82) and the Adaptive VR condition
(Mdn=138.90, Range=48.12).
Adaptive Control of Cardio-respiratory Training in a Virtual Reality Hiking Simulation: A Feasibility Study
95
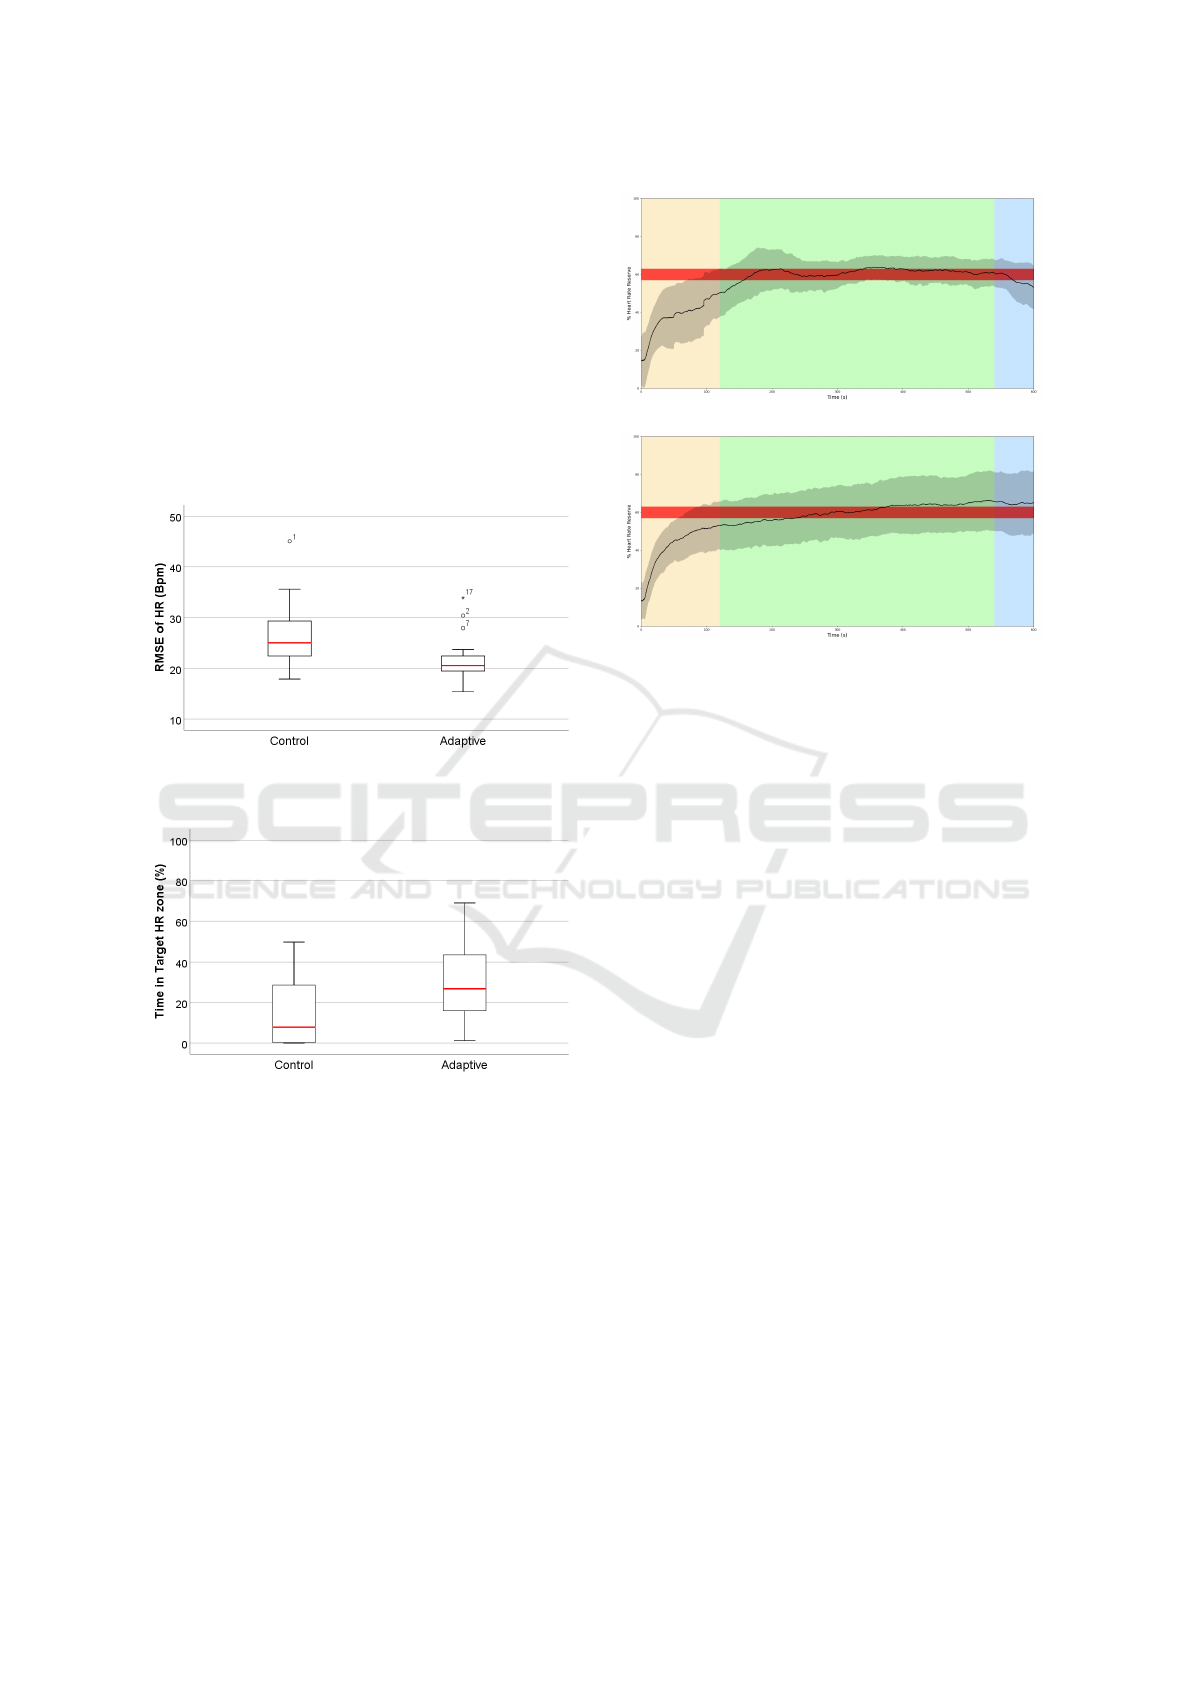
In terms of the difference between the HR
and the target HR, the RMSE revealed lower val-
ues in the Adaptive VR condition (Mdn=20.57,
Range=18.46) compared to the Non-Adaptive VR con-
dition (Mdn=25.08, Range=27.14). This result was
significantly different, T=173,p-value<0.05,r=0.57
(Figure 5).
Finally, the Adaptive VR condition had sig-
nificantly higher percentage of time (T=32.00,p-
value<0.01, r=0.61) in the target HR zone
(Mdn=26.83, Range=67.83) compared to
the Non-Adaptive VR condition (Mdn=7.83,
Range=49.67)(Figure 6).
Figure 5: Boxplot of the RMSE for the Non-Adaptive VR
Levada and Adaptive VR Levada conditions.
Figure 6: Boxplot of the Time in target HR zone in per-
centage for the Non-Adaptive VR Levada and Adaptive VR
Levada conditions.
Figure 7 depicts the time evolution and relation-
ship between participants’ HR and their target HR
over the 10 minutes of the experiment. HR data in
Figure 7a (black line), shows that the Adaptive VR
Levada condition spends more time inside the target
HR zone (red band) compared to the Non-Adaptive
VR Levada. Also, the variability of the data (black
shadow) seems smaller than that of the control.
(a) Adaptive VR Levada.
(b) Non-Adaptive VR Levada
Figure 7: Average HR of all participants throughout the
whole experiment, for the Adaptive and Non-Adaptive VR
conditions. Black line - Average HR, Black Shadow - Av-
erage Standard Deviation, Red Band - Target HR zone, Yel-
low Band - Warm-up Phase, Green Band - Training Phase,
Blue Band - Cool-down Phase.
3.2 Physical Exertion
Concerning the accelerometer metrics mentioned
in section 2.5.1 it is possible to verify that in
the Adaptive VR Levada condition the METS val-
ues were lower (Mdn=1.02, Range=1.59) than the
Non-Adaptive VR Levada condition (Mdn=1.05,
Range=2.33). In terms of the Percentage of
time in Sedentary and Light exercise, in the
Non-Adaptive VR Levada condition the participants
spent more time in Sedentary exercise (Mdn=34.17,
Range=85.83) compared to the Adaptive VR Lev-
ada (Mdn=29.00, Range=95.50). Consequently,
the time spent in Light exercise was higher for
the Adaptive VR Levada condition (Mdn=70.50,
Range=95.00) than in the Non-Adaptive VR Lev-
ada (Mdn=59.67, Range=84.33). For the MVPA,
the Non-Adaptive VR Levada condition values were
higher (Mdn=0.05, Range=4.27) than the Adaptive
VR Levada values (Mdn=0, Range=4.92). Finally,
the magnitude vector values for the Adaptive VR
Levada were higher (Mdn=27168.5, Range=36849.8)
than the Non-Adaptive VR Levada condition values
(Mdn=20891.1, Range=33329.1). Despite these re-
sults, no significant difference was found for all the
metrics computed, between the Non-Adaptive VR
Levada and Adaptive VR Levada conditions.
BIOSIGNALS 2022 - 15th International Conference on Bio-inspired Systems and Signal Processing
96
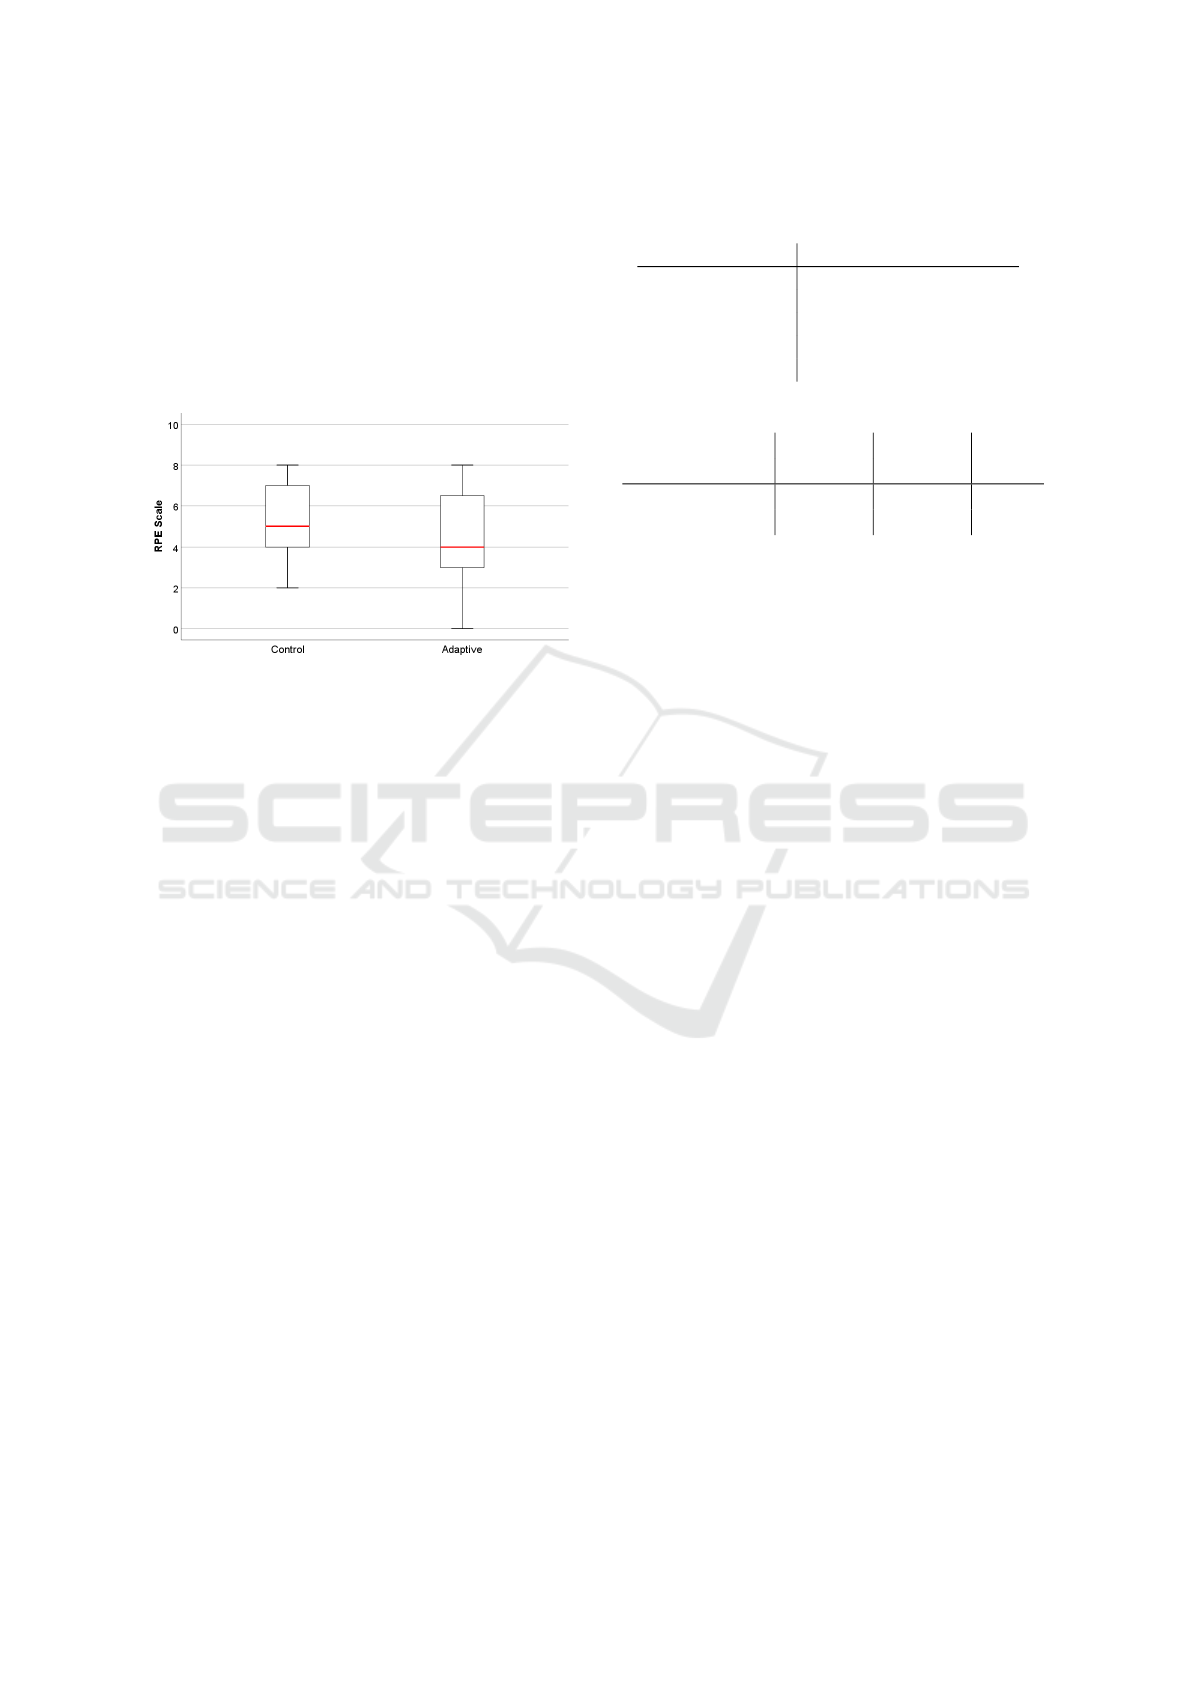
The results for the perceived exertion (RPE
Scale) reported by the participants, revealed that the
Adaptive VR Levada condition showed lower val-
ues of perceived exertion (Mdn=4.00, Range=8.00)
compared to the Non-Adaptive VR Levada condi-
tion (Mdn=5.00, Range=6.00) (Fig.8). No signifi-
cant difference was found between the Non-Adaptive
VR Levada and Adaptive VR Levada conditions (p-
value=0.089).
Figure 8: Boxplot of the Rated Perceived Exertion (RPE)
Scale for the Non-Adaptive VR Levada and Adaptive VR
Levada conditions.
3.3 User Experience
Participants reported a higher level of dizziness
(Mdn=2.00, Range=3.00) on the Adaptive VR Levada
condition compared to the Adaptive Non-VR condi-
tion (Mdn=1.00, Range=3.00). For the sickness ques-
tion, the result reported were the same on both con-
ditions (Mdn=1.00, Range=2.00). No significant dif-
ference was found between the Adaptive Non-VR and
Adaptive VR Levada condition, regarding the sickness
and dizziness short 5-point questionnaire.
Presence was measured with the WSPQ. The to-
tal mean score for the sum of all sub-scales was
M=93.1(16.1), which indicates a presence level of
70%, similar to the result reported by (Ahmad, 2021),
and higher than the result reported by (Gonc¸alves
et al., 2021) (Table 3). The mean rating score of in-
volvement suggested that the user was engaged with
the experiment while the immersion score shows that
user perceived the environment realistically. The vi-
sual fidelity and interface quality scores represented
the clarity, perception depth and user-friendly appli-
cation. The mean rating score of the sound also indi-
cated the realistic sound coming from the application
environment.
Regarding the results obtained between the Adap-
tive Non-VR and the Adaptive VR Levada conditions
for the IMI questionnaire (Table 4), no significant dif-
ferences were found for either Pressure/Tension or In-
terest/Enjoyment.
Table 3: Mean Rating Score for each sub-scale of the
WSPQ. The scale ranges from 1 to 7 in a Likert Scale.
Sub-Scale Mean Rating Score (SD)
Involvement 4.78 (0.95)
Immersion 5.23 (0.79)
Visual Fidelity 4.3 (1.6)
Interface Quality 5.3 (1.1)
Sound 4.7 (1.5)
Table 4: Intrisic Motivation Inventory Results.
Sub-Scale
VR Non-VR
p-value
Mean (SD) Mean (SD)
Interest/Enjoyment 4.62 (1.37) 4.42 (1.19) 0.37
Pressure/Tension 2.65 (0.99) 2.71 (1.26) 0.87
The usability of the application was assessed with
the SUS (M=78.1 (3.2)). In this test, a score of 68 is
the threshold that indicates that user satisfaction level
is above average (Brooke, 1995). Hence, our results
showed the excellent usability of the simulation appli-
cation in terms of comfort and ease of use, and were
similar to the result reported by (Ahmad, 2021).
4 DISCUSSION
Most studies related to exercising with adaptive con-
trol of HR are based on cycle ergometers or ex-
ergames (Mu
˜
noz et al., 2018; Hoffmann et al., 2015;
Kiryu et al., 2001). This study assessed the feasi-
bility of performing an adaptive control of cardio-
respiratory training based on the participant’s HR
while performing a stepping activity in a virtual Re-
ality hiking simulation. The results obtained from
our study showed that the algorithm implemented was
able to drive the participants to reach the target heart
zone within, approximately, the first 2-3 minutes of
the exercise, answering the first question (RQ1) re-
garding the manipulation of the training intensity us-
ing an adaptive system.
Regarding RQ2 and RQ3, the participants in the
Adaptive VR Levada exerted more than 20% of the
total duration of the experiment (10-min), in the tar-
get heart rate zone, compared to the Non-Adaptive VR
Levada condition, while having an median RMSE of
20 beats per minute between the heart rate and the tar-
get heart rate.
Both of these results agree with the results ob-
tained by (Mu
˜
noz et al., 2018), in which the time that
the participants exerted in the target HR zone was
40% higher in the adaptive condition with a RMSE
of 15 beats per minute, considering the entire experi-
ment of 20 minutes.
Adaptive Control of Cardio-respiratory Training in a Virtual Reality Hiking Simulation: A Feasibility Study
97

Regarding the RPE scale, although no significant
difference was found between the Non-Adaptive VR
Levada and Adaptive VR Levada conditions, partic-
ipants reported lower values of perceived exertion in
the Adaptive VR Levada condition. This indicates that
even though participants were training in the target
HR zone for more time, their perception of effort was
smaller, addressing the impact of VR feedback on per-
ceived exertion levels (RQ4). This could suggest that
lower levels of fatigue may come from training in a
more controlled HR regime. These results are also in
agreement with the results obtained by (Mu
˜
noz et al.,
2018).
In terms of sense of presence, most of the pa-
pers in the literature report treadmills or cycling ergo-
meters, which makes it difficult to compare with our
study. In our experiment, the impact of VR on physi-
cal exertion and intrinsic motivation during the virtual
hiking simulation was investigated in a stepping-in-
place based application. From the results obtained, it
is possible to observe that this simulation of a virtual
hiking activity generated a high sense of presence, ap-
proximately 70%, with the sub-scale Immersion hav-
ing the highest mean rating score of M = 5.23 com-
pared to the other sub-scales. Regarding the intrin-
sic motivation, participants reported a higher value
for intrinsic motivation in the Adaptive VR of ap-
proximately 66% compared to 63% in the Adaptive
Non-VR Levada for the sub-scale Interest/Enjoyment,
and a lower value of Pressure/Tension of 38% for
Adaptive VR Levada and 39% for the Adaptive Non-
VR Levada. Even though no significant effect was
found for intrinsic motivation, the results found for
the Interest/Enjoyment are in agreement with other
studies. Buchner et al. (Buchner and Zumbach,
2018) also reported higher values for the sub-scale
Interest/Enjoyment in augmented reality than a non-
Augmented Reality application.
Finally, regarding the levels of dizziness and sick-
ness while using the VR system, despite having a par-
ticipant that was dropped from the study due to sick-
ness problems, the median value reported for the sick-
ness was of 1, and for the dizziness was of 2, in a
5-point scale, thus our system is not prone to induce
virtual sickness or dizziness to the participants.
5 LIMITATIONS
Although the main goal for this study was achieved
with success, there are some limitations implicit with
this study. The effect of VR is specific for the de-
sign of our VR Levada experiment and for our par-
ticular CAVE, so we do not have information on what
can happen on other VR delivery technologies or sim-
ulations, or the effect of adding gamification to the
task. This study targeted a training intensity of 60%
with a mandatory pace of stepping of 125 beats per
minute set by a metronome. In order to generalize the
application of this system to other situations, higher
or lower training intensities, with a different pace set
by the metronome should be tested. Also, the single
variable adapted during the entire study was the tar-
get height at which the participants had to raise their
knees. A variable could be added to adjust the pace
set by the metronome to combine the adaptation with
the target height. Finally, the acquisition of HR was
performed on a consumer-grade device, the Polar H10
chest band.
6 CONCLUSION
This study aimed to create a stepping-based VR ap-
plication simulating a hiking track, the Levadas, that
could adapt to the physiological signals of the partic-
ipant to provide adequate levels of exercise intensity.
Our data indicates that the adaptation rules created on
the closed-loop, according to the participant’s HR, us-
ing BLEngine, could drive the participant to the de-
sired target heart rate zone. Thus, successfully ad-
justing the intensity of training within the target heart
rate zone of optimal effectiveness. This adaptation in-
creased the time in which the participants were in the
target heart rate zone by 20% compared to the Non-
Adaptive VR Levada condition. In addition, partici-
pants perceived lower levels of exertion in the adap-
tive condition. In conclusion, we highlight the po-
tential of personalized and adaptive VR applications
to improve cardiorespiratory fitness, engagement and
motivation of the participants.
ACKNOWLEDGEMENTS
This work was co-financed by ”Madeira 14-20” under
the project MITIExcell - Excel
ˆ
encia internacional de
IDT&I nas TIC (M1420-01-0145-FEDER-000002)
and supported by the NOVA Laboratory of Computer
Science and Informatics (UID/CEC/04516/2020) and
by the ARDITI - Ag
ˆ
encia Regional para o Desen-
volvimento da Investigac¸
˜
ao, Tecnologia e Inovac¸
˜
ao.
REFERENCES
Ahmad, M. A. (2021). Efficacy of augmented reality-based
virtual hiking in cardiorespiratory endurance : A pilot
BIOSIGNALS 2022 - 15th International Conference on Bio-inspired Systems and Signal Processing
98

study.
Bailenson, J., Patel, K., Nielsen, A., Bajscy, R., Jung, S. H.,
and Kurillo, G. (2008). The effect of interactivity on
learning physical actions in virtual reality. Media Psy-
chology, 11(3):354–376.
Borg, G. (1998). Borg’s Perceived Exertion And Pain
Scales.
Brooke, J. (1995). Sus: A quick and dirty usability scale.
Usability Eval. Ind., 189.
Buchner, J. and Zumbach, J. (2018). Promoting intrinsic
motivation with a mobile augmented reality learning
environment.
Dean, A., Sciences, H., Kingston, R. I., Island, R., Edith,
P. C., Heart, B. F., Henry, C., Hospital, F., Kingston,
R. I., Island, R., and Coordinator, P. (1998). Advanced
fitness assessment & exercise prescription, volume 35.
Garcia, J., Schoene, D., Lord, S., Delbaere, K., Valenzuela,
T., and Felix Navarro, K. (2016). A bespoke kinect
stepping exergame for improving physical and cogni-
tive function in older people: A pilot study. Games for
health journal, 5.
Golding (2000). YMCA Fitness Testing and Assessment
Manual. YMCA of the USA.
Gonc¸alves, A. and Badia, S. B. I. (2018). KAVE: Building
kinect based CAVE automatic virtual environments,
methods for surround-screen projection management,
motion parallax and full-body interaction support.
Proceedings of the ACM on Human-Computer Inter-
action, 2(EICS).
Gonc¸alves, A., Cameir
˜
ao, M., Berm
´
udez i Badia, S., and
Gouveia, E. (2016). Automating senior fitness testing
through gesture detection with depth sensors. pages 6
.–6 .
Gonc¸alves, A., Montoya, M. F., Llorens, R., and Berm
´
udez
i Badia, S. (2021). A virtual reality bus ride as an
ecologically valid assessment of balance: a feasibility
study. Virtual Reality, (0123456789).
Hoffmann, K., Sportwiss, D., Hardy, S., Wiemeyer, J., and
G
¨
obel, S. (2015). Personalized Adaptive Control of
Training Load in Cardio-Exergames - A Feasibility
Study. Games for Health Journal, 4(6):470–479.
Huang, S.-F., Tsai, P.-Y., Sung, W.-H., Lin, C.-Y., and
Chuang, T.-Y. (2008). The comparisons of heart
rate variability and perceived exertion during simu-
lated cycling with various viewing devices. Presence,
17:575–583.
Ioannou, C., Archard, P., O’Neill, E., and Lutteroth, C.
(2019). Virtual performance augmentation in an im-
mersive jump & run exergame. pages 1–15.
Karvonen, J. and Vuorimaa, T. (1988). Heart Rate and Exer-
cise Intensity During Sports Activities: Practical Ap-
plication. Sports Medicine: An International Journal
of Applied Medicine and Science in Sport and Exer-
cise, 5(5):303–311.
Kiryu, T., Sasaki, I., Shibai, K., and Tanaka, K. (2001).
Providing appropriate exercise levels for the elderly.
IEEE Engineering in Medicine and Biology Maga-
zine, 20(6):116–124.
Lee, I.-M., Shiroma, E. J., Lobelo, F., Puska, P., Blair, S. N.,
and Katzmarzyk, P. T. (2012). Effect of physical in-
activity on major non-communicable diseases world-
wide: an analysis of burden of disease and life ex-
pectancy. The Lancet, 380(9838):219–229.
Mcauley, E., Duncan, T., and Tammen, V. (1989). Psycho-
metric properties of the intrinsic motivation inventory
in a competitive sport setting: A confirmatory factor
analysis. Research quarterly for exercise and sport,
60:48–58.
McCall, R., O’Neil, S., and Carroll, F. (2004). Measur-
ing presence in virtual environments. Conference on
Human Factors in Computing Systems - Proceedings,
pages 783–784.
Mestre, D., Ewald, M., and Maiano, C. (2011). Virtual real-
ity and exercise: Behavioral and psychological effects
of visual feedback. Studies in health technology and
informatics, 167:122–7.
Mu
˜
noz, J. E., Cameir
˜
ao, M., Berm
´
udez i Badia, S., and Ru-
bio Gouveia, E. (2018). Closing the loop in exergam-
ing - Health benefits of biocybernetic adaptation in se-
nior adults. CHI PLAY 2018 - Proceedings of the 2018
Annual Symposium on Computer-Human Interaction
in Play, pages 329–339.
Mu
˜
noz, J. E., Gouveia, E. R., Cameir
˜
ao, M. S., and Ba-
dia, S. B. I. (2017). The biocybernetic loop engine:
An integrated tool for creating physiologically adap-
tive videogames. PhyCS 2017 - Proceedings of the
4th International Conference on Physiological Com-
puting Systems, (PhyCS):45–54.
Oh, Y. and Yang, S. (2010). Defining exergames & ex-
ergaming.
Pluchino, A., Lee, S. Y., Asfour, S., Roos, B., and Signo-
rile, J. (2012). Pilot study comparing changes in pos-
tural control after training using a video game balance
board program and 2 standard activity-based balance
intervention programs. Archives of physical medicine
and rehabilitation, 93:1138–46.
Rosenberg, D., Depp, C., Vahia, I., Reichstadt, J., Palmer,
B., Kerr, J., Norman, G., and Jeste, D. (2010). Ex-
ergames for subsyndromal depression in older adults:
A pilot study of a novel intervention. The Ameri-
can journal of geriatric psychiatry : official journal
of the American Association for Geriatric Psychiatry,
18:221–6.
Sheehan, R., Herring, M., and Campbell, M. (2017). Moti-
vation measures in sport: A critical review and biblio-
metric analysis. Frontiers in Psychology, 8.
Shepherd, J., Carter, L., Pepping, G.-J., and Potter, L. E.
(2018). Towards an operational framework for design-
ing training based sports virtual reality performance
simulators. Proceedings, 2:214.
Slater, M., Steed, A., and Usoh, M. (1995). The Vir-
tual Treadmill: A Naturalistic Metaphor for Naviga-
tion in Immersive Virtual Environments. (December
2013):135–148.
Stasie
˜
nko, A. and Sarzy
´
nska-Długosz, I. (2016). Virtual
Reality in Neurorehabilitation. Postepy Rehabilitacji,
30(4):67–75.
Adaptive Control of Cardio-respiratory Training in a Virtual Reality Hiking Simulation: A Feasibility Study
99
