
Visualization of Knowledge Distribution across Development Teams
using 2.5D Semantic Software Maps
Daniel Atzberger, Tim Cech, Adrian Jobst, Willy Scheibel
a
, Daniel Limberger
b
,
Matthias Trapp
c
and J
¨
urgen D
¨
ollner
Hasso Plattner Institute, Digital Engineering Faculty, University of Potsdam, Germany
adrian.jobst@student.hpi.uni-potsdam.de
Keywords:
Topic Modeling, Software Visualization, Source Code Mining.
Abstract:
In order to detect software risks at an early stage, various software visualization techniques have been de-
veloped for monitoring the structure, behaviour, or the underlying development process of software. One of
greatest risks for any IT organization consists in an inappropriate distribution of knowledge among its de-
velopers, as a projects’ success mainly depends on assigning tasks to developers with the required skills and
expertise. In this work, we address this problem by proposing a novel Visual Analytics framework for mining
and visualizing the expertise of developers based on their source code activities. Under the assumption that
a developer’s knowledge about code is represented directly through comments and the choice of identifier
names, we generate a 2D layout using Latent Dirichlet Allocation together with Multidimensional Scaling
on the commit history, thus displaying the semantic relatedness between developers. In order to capture a
developer’s expertise in a concept, we utilize Labeled LDA trained on a corpus of Open Source projects. By
mapping aspects related to skills onto the visual variables of 3D glyphs, we generate a 2.5D Visualization, we
call KnowhowMap. We exemplify this approach with an interactive prototype that enables users to analyze the
distribution of skills and expertise in an explorative way.
1 INTRODUCTION
Visual Analytics for Software Data. The complex-
ity of modern software development projects requires
careful coordination of all development activities,
which are usually managed using various interactive
tools with visualization capabilities. Therefore during
the entire development process, data from heteroge-
neous categories is generated and stored in respective
software repositories. For example, changes in the
source code made by the developers are represented
in a Version Control System (VCS), the progress of
development tasks is tracked within an issue tracking
system, defects are reported, assigned and managed
in a bug tracking system, and discussions on selected
topics are conducted in chat forums by the develop-
ers. These rich sources of data motivate the use of
machine learning techniques when mining software
repositories (Bird et al., 2015).
a
https://orcid.org/0000-0002-7885-9857
b
https://orcid.org/0000-0002-9111-4809
c
https://orcid.org/0000-0003-3861-5759
Complementary to the analysis of software data
using machine learning techniques, Software Visu-
alization techniques can be applied to communicate
various aspects of the structure or behaviour of a soft-
ware system using graphical representations. Often,
the analysis and visualization go hand in hand, there-
fore being an example for the broader field of Visual
Analytics (Keim et al., 2008).
Examples for Software Visualizations support-
ing program comprehension tasks or risk monitor-
ing include treemaps based on the folder structure
of source code projects, where additional quantita-
tive data about a software’s quality or complexity
is mapped to visual variables (Bohnet and D
¨
ollner,
2011; Limberger et al., 2019; Scheibel et al., 2020),
circular bundle views for displaying dependencies be-
tween source code files (Tr
¨
umper et al., 2012), trace
visualization techniques (Tr
¨
umper et al., 2010) or
software landscapes displaying the semantic structure
that is captured from investigating the use of natu-
ral language in comments and identifier names us-
ing topic models (Kuhn et al., 2008; Atzberger et al.,
2021a; Atzberger et al., 2021b).
210
Atzberger, D., Cech, T., Jobst, A., Scheibel, W., Limberger, D., Trapp, M. and Döllner, J.
Visualization of Knowledge Distribution across Development Teams using 2.5D Semantic Software Maps.
DOI: 10.5220/0010991100003124
In Proceedings of the 17th International Joint Conference on Computer Vision, Imaging and Computer Graphics Theory and Applications (VISIGRAPP 2022) - Volume 3: IVAPP, pages
210-217
ISBN: 978-989-758-555-5; ISSN: 2184-4321
Copyright
c
2022 by SCITEPRESS – Science and Technology Publications, Lda. All rights reserved
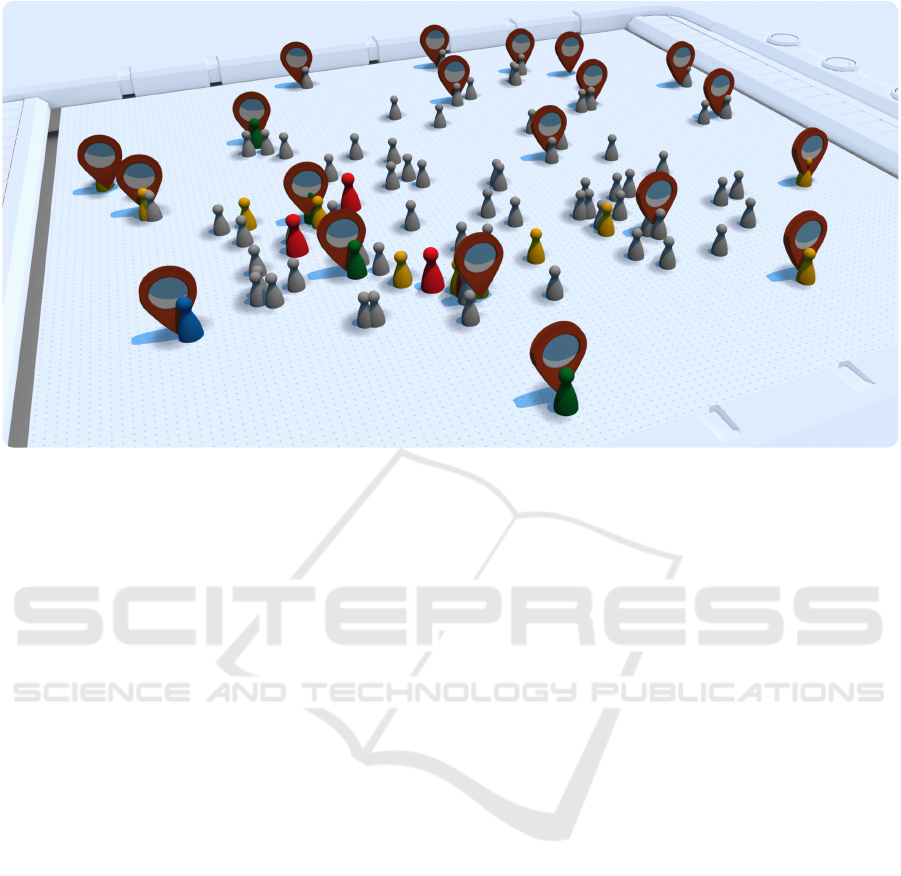
Figure 1: KnowhowMap for the Bitcoin Core project(github.com/bitcoin/bitcoin) based on 2000 commits. Each developer
is displayed as a pawn figure, whose height displays its expertise level in the concept Cryptocurrency. The pointers display
latent source code topics.
Problem Statement. According to Som-
merville (Sommerville, 2016) “The people working
in a software organization are its greatest assets”,
therefore it is of fundamental importance for any
IT organization to keep track of the distribution of
knowledge across its developer staff. The existing
approaches of analyzing knowledge of developers all
focus on specific aspects and do thus not allow a user,
e.g., a project manager, to investigate the distribution
of knowledge in an explorative way. An interactive
visualization technique should address the following
aspects:
1. Similarity between developers, given as a nu-
merical value between 0 and 1, which is the basis
for all questions on the distribution of skills.
2. Visualization of categorical attributes, as prop-
erties, such as the location or the team member-
ship are of discrete nature.
3. Visualization of numerical attributes, as the
level of skills in a concept or technology can be
measured on a numerical scale.
Approach and Contributions. In this work, we
propose a concept for mining and visualizing the dis-
tribution of knowledge across software organizations
on the basis of their activities stored in the VCS. By
applying Latent Dirichlet Allocation (LDA), a prob-
abilistic topic model, on the commit histories of de-
velopers, we can compare developers on a seman-
tic level. A subsequent application of dimension re-
duction techniques generates a 2D layout for present-
ing the “similarity” between the developers. Using
a novel concept-location approach based on Labeled
LDA (LLDA), we assign an expert level to each de-
veloper with respect to general concepts, e.g., Ma-
chine Learning or Blockchain. The so-generated data
is then mapped onto the visual variables of 3D glyphs,
that leads a visualization, we call KnowhowMap. An
example for a KnowhowMap for the Bitcoin project is
shown in Fig. 1. To summarize, we make the follow-
ing contributions
1. We present an approach for mining the expertise
of developers in general concepts using LLDA.
2. We present a 2.5D visualization technique, whose
layout reflects the semantic relatedness between
developers and whose glyphs can be used to dis-
play various data related to developer data.
The remainder of this work is structured as follows:
Sec. 2 describes preliminaries on data sets and con-
cept. Sec. 3 reviews related work with respect to min-
ing developer expertise and visualizing the semantic
structure of source code. Our approach for applying
LDA and its variant LLDA for mining expertise is de-
scribed in Sec. 4. Sec. 5 presents our visualization
approach. Sec. 6 concludes this paper and outlines
directions for future work.
Visualization of Knowledge Distribution across Development Teams using 2.5D Semantic Software Maps
211
2 BACKGROUND
Application Context. During the entire software
development process, a project managers task is to lo-
cate expertise in the set of all developers involved in a
project in order to assign tasks to the person with the
respective skills. Furthermore, it is of major interest
for any IT organization to monitor the distribution of
its staff as a whole, as an imbalanced concentration
of knowledge can lead to significant risks (Cosentino
et al., 2015). In large, often globally distributed,
teams it is practically impossible to manually keep
track of every developers’ skill set. But even in small
development teams, which are often characterized by
an agile and thus dynamic team composition, this is a
non-trivial endeavor.
Data Set & Data Acquisition. We focus our anal-
ysis on the source code activities of developers, as a
large part of a developer’s knowledge about code is
encoded in it in the form of comments or the choice
of identifier names. Thus, mining the commit history
of a developer, stored in the VCS, should enable us to
draw conclusions about his field of expertise.
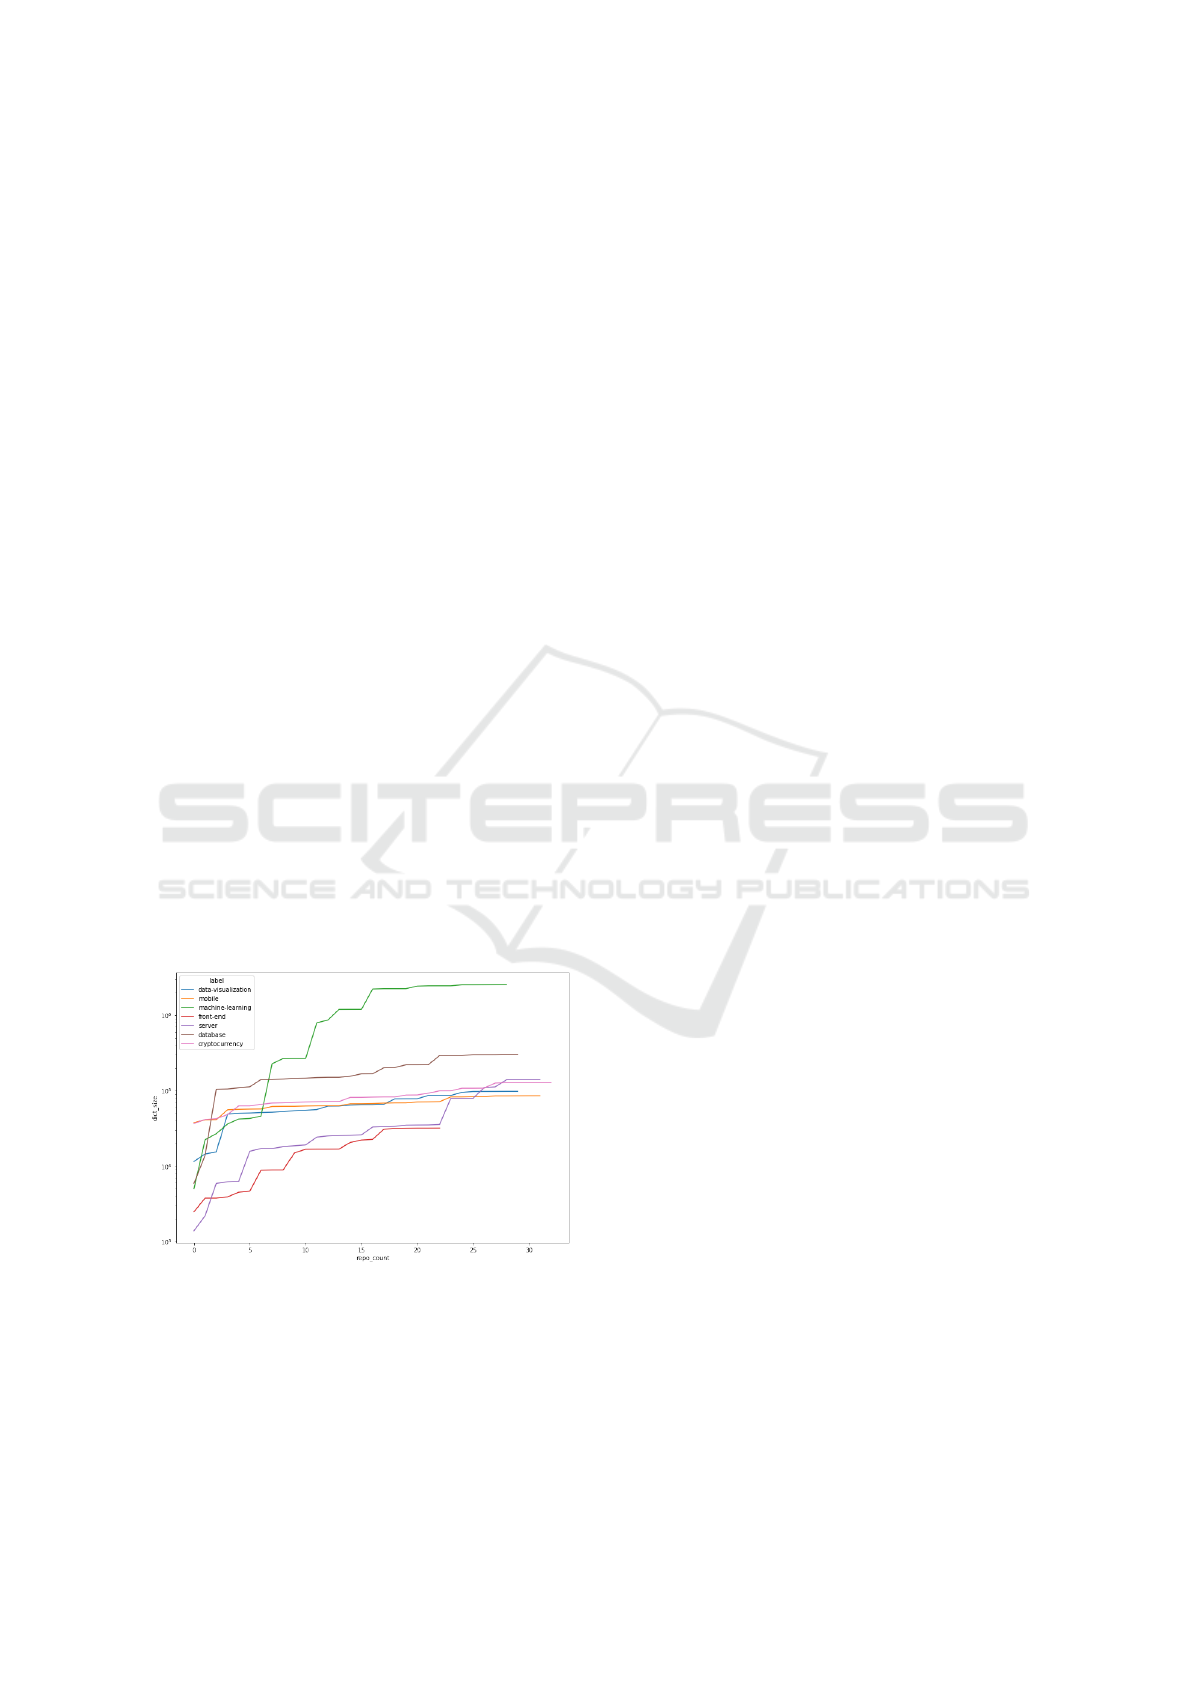
Fig. 2 shows the size of the vocabulary for a set
of projects from GitHub that are associated with the
same general concept. The graphs show that only a
few representative projects are required until the size
of vocabulary stagnates. This shows that projects,
with the same underlying concept, share a relatively
small vocabulary. Therefore, the similarity between
two developers that are active in the same field, is
probably captured in their vocabularies.
Figure 2: Size of the vocabulary for number of GitHub
projects that are tagged with the same concept. Each curve
flattens after a few projects are added to the set of projects,
e.g., for the concept “machine learning” 16 projects are re-
quired, and for the concept “database” only 2 projects are
required.
Use Cases & Requirements. Our interactive visu-
alization technique addresses two main use cases.
UC-1: The proposed visualization should be able to
support a project managers daily work in locating
experts for general concepts among the develop-
ers. It should facilitate the detection of developers
that are active in a general concept, and it should
also be able to relate developers to each other, i.e.,
if a developer leaves a project.
UC-2: On a broader perspective our visualization
should be able to monitor the distribution of
knowledge across an entire IT organization in or-
der to detect risks at an early stage.
3 RELATED WORK
Our work mainly extends ideas presented by Lin-
stead et al. , who were the first to mine developer
expertise using probabilistic topic models (Linstead
et al., 2007; Linstead et al., 2009). In particular,
a developer’s expertise in topics was determined us-
ing the Author-Topic Model (ATM), a variant of
LDA (Rosen-Zvi et al., 2004), on source code files. In
combination with Multidimensional Scaling (MDS),
the similarity between the developers can be visual-
ized as a two-dimensional scatter plot.
Saxena and Padanekar proposed an algorithm for
mining and visualizing a developer’s expertise in ab-
stracts concepts (Saxena and Pedanekar, 2017). By
annotating a developers import statements with tags
from Q&A-forums, e.g., Stack Overflow, each devel-
oper was assigned a level-of-expertise in the concept.
Based on the underlying hierarchy of concepts, each
developer was visualized using a treemap.
Greene and Fisher developed CVExplorer, an ap-
proach for mining and visualizing technical skills for
GitHub users (Greene and Fischer, 2016). Their ap-
proach extracts the commit messages, the changed
files, and the Readme files for each repository a user
has contributed to. By comparing the commit mes-
sages and the Readme files with a white list of skills,
and extracting the programming language from the
modified files, each developer is assigned a skill level.
The skills for each developer are displayed as an in-
teractive tag cloud.
Kourtzanidis et al. trained the Microsoft Lan-
guage Understanding Intelligent Service (LUIS) to
identify expertise in two front-end frameworks and
three .Net technologies (Kourtzanidis et al., 2020).
The authors developed a tool, named RepoSkillMiner,
which visually communicates a developer’s profile
using basic two-dimensional charts.
IVAPP 2022 - 13th International Conference on Information Visualization Theory and Applications
212

Other approaches for mining aspects of developer
expertise include familiarity with source code (Fritz
et al., 2014), libraries (Teyton et al., 2013), or abstract
concepts (Teyton et al., 2014).
Skupin was the first to apply dimension reduction
techniques for the task of displaying semantic relat-
edness between natural language documents (Skupin,
2004). Applying Self-Organizing Maps on the Bag-
of-Words (BOW) of abstracts from publications re-
sults in a two-dimensional layout that was enriched
using cartographic methods.
Kuhn et al. presented a similar method for the
software visualization domain, to capture the “seman-
tic” similarity between source code files, i.e., files that
implement a common semantic should be placed near
each other (Kuhn et al., 2008; Kuhn et al., 2010).
Their layout is determined using Latent Semantic In-
dexing (LSI), a non-probabilistic topic model (Deer-
wester et al., 1990), together with MDS on the natural
language used in the source code files.
Atzberger et al. presented Software Forest, a 2.5D
visualization, whose layout originates from LDA and
MDS applied on the comments and identifier names
found in source code files (Atzberger et al., 2021a).
By placing 3D glyphs, e.g., trees, on the plane nu-
merical attributes associated to a source code file can
be displayed. Their layout approach was later ap-
plied to the 3D case, leading to a visualization of de-
velopment activities in source code using a Galaxy
metaphor (Atzberger et al., 2021b).
4 MINING DEVELOPER
EXPERTISE FROM SOURCE
CODE ACTIVITIES
As discussed in Sec. 2, the vocabulary used in the
commits is a strong indicator for a developer’s fields
of expertise. This motivates the use of techniques
from the Natural Language Processing (NLP) domain
for mining developer expertise. One of the most
widely used class of algorithms for mining software
repositories are topic models (Chen et al., 2016). In
this section, we detail our approach on how we apply
LDA, a probabilistic topic model introduced by Blei
et al. (Blei et al., 2003), and its variant LLDA, pro-
posed by Ramage et al. (Ramage et al., 2009), for
modelling a developer’s expertise based on his source
code activities.
Data Preprocessing. For each developer, we ex-
tract his commit history from the VCS and store the
entire set of added and deleted files in a single doc-
ument. Before applying the respective topic model,
the vocabulary is required to be preprocessed to re-
move words that carry no meaning and to decrease
the size of vocabulary. We adopt the preprocessing
steps proposed by Atzberger et al. (Atzberger et al.,
2021a),i.e., (1) we remove non-text symbols, e.g.,
commas or semicolons, (2) we split words at delim-
iters and according to the Camel Case convention, (3)
we remove stop words of the English language and
keywords of the programming language, and (4) we
lemmatize the vocabulary.
After the preprocessing is performed, we store each
document in the BOW format, thus neglecting the
order of the single words and just storing their fre-
quency. From now on, when we refer to the com-
mit history of developers, we always mean the pre-
processed BOWs.
Latent Dirichlet Allocation for Mining Devel-
oper Similarity. Given a set of documents C =
{d
1
, . . . , d
m
}, the so-called corpus, the goal of a
probabilistic topic model is to extract latent topics
ϕ
1
, . . . , ϕ
K
in the corpus by examining patterns of co-
occurring words. The number of topics K is a hy-
perparameter of the model and needs to be set by the
user initially. The extracted topics are given as dis-
tributions over the vocabulary V , which contains the
terms from the corpus C . In most cases, the underly-
ing “concept” of a topic can be derived from its most
probable words (Markovtsev and Kant, 2017). More-
over, topic models learn representations θ
1
, . . . , θ
m
of
the documents as distributions over the topics. The
distributions θ
1
, . . . , θ
m
are therefore descriptions of
the semantic structure of the document.
The core assumption of LDA is that the corpus
underlies a generative process, which is given by
1. For each document d in the corpus C choose a
distribution over topics θ ∼ Dirichlet(α)
2. For each word w in d
(a) Choose a topic z ∼ Multinomial(θ)
(b) Choose the word w according to the probability
p(w|z, β)
By associating each developer with its respective
commit history, the application of LDA extracts the
hidden concepts, as well as describes each developer
as a distribution over topics, i.e., each developer is
described as a high-dimensional vector of dimension
K.
Locating Concept Expertise using Labeled LDA.
Direct application of LDA does not provide labels
for the extracted topics. Especially when applied on
Visualization of Knowledge Distribution across Development Teams using 2.5D Semantic Software Maps
213
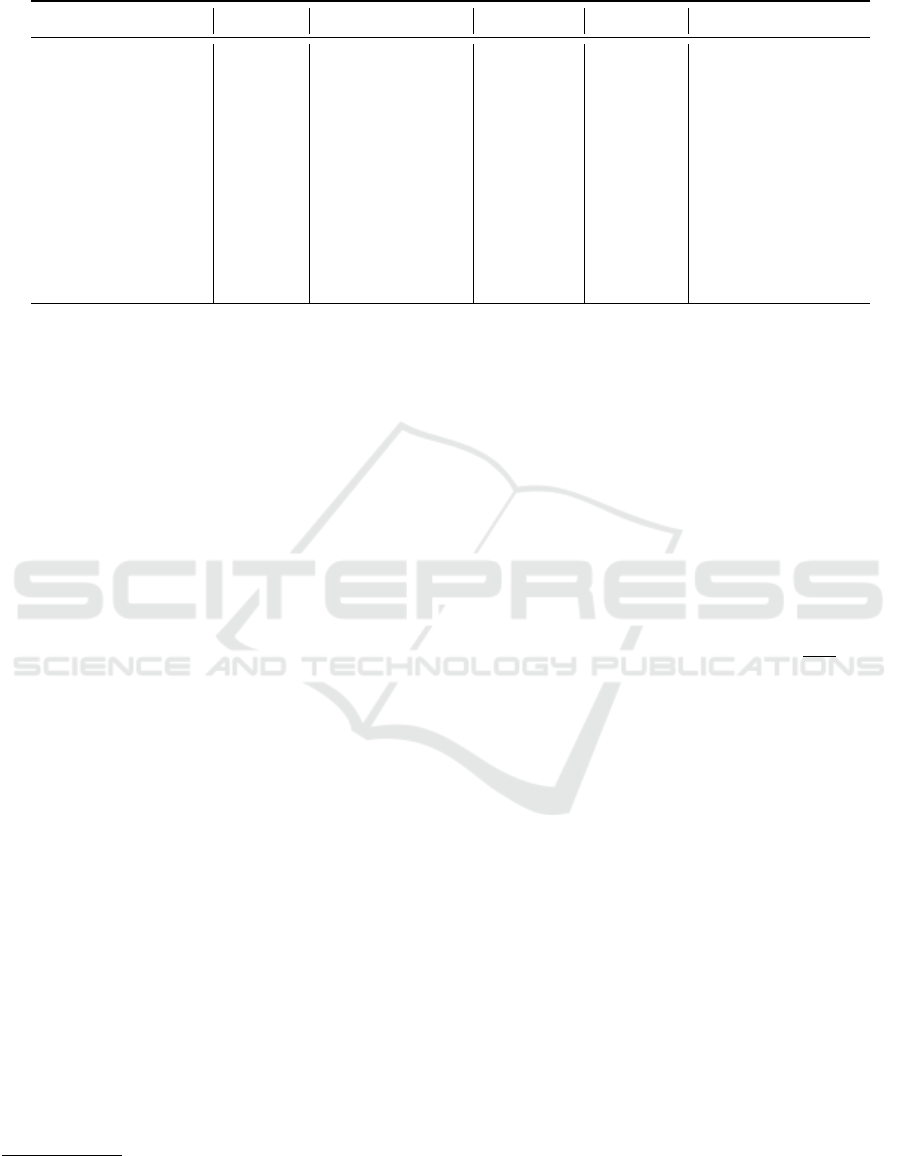
Table 1: Most relevant terms (λ = 0.6) for six exemplary concepts.
Machine Learning Mobile Cryptocurrency Database Server Data Visualization
th android fe err span chart
tensor view order db request prop
self name symbol table server series
cuda com crypto test test axis
input get binance key header pixi
model param price name http gl
license conv trade value rct datum
output activity wallet opt body react
layer fpga exchange sql response point
size wishlist block error message style
source code files from a single project, the interpre-
tation of topics requires an in-depth knowledge about
a project (Linstead et al., 2009). Pure LDA is there-
fore not applicable for locating expertise among de-
velopers in general concepts, e.g., Machine Learning,
Mobile, Front-End, or Cryptocurrency.
LLDA, a variant of LDA proposed by Ramage
et al. can be used to extract labeled topics (Ramage
et al., 2009). Assuming that each document d
1
, . . . , d
m
in the training corpus is provided with tags as meta in-
formation, each topic is associated with exactly one
tag. Vice versa a document can only have a non-
zero value in a topic, when it is provided with the
corresponding tag. The idea behind our approach
is to generate a corpus of labeled software projects,
that serve as representatives for the general concepts.
GitHub Topics
1
provide a tagging system for projects
hosted on GitHub. Using the GitHub API it is pos-
sible to select all projects that are tagged as exam-
ples for a general concept. To extract the “real” soft-
ware projects, we neglect all projects that are addi-
tionally equipped with tags from a white list that con-
tains words like, awesome-list, tutorial, or interview.
To ensure, that the project is actively maintained, we
further filter all projects with less than 20 open or
closed issues. The remaining projects are sorted ac-
cording their stars
2
in decreasing order. For exam-
ple the first four elements of the list of projects for
the concept machine-learning, are tensorflow/tensor-
flow, keras-team/keras, pytorch/pytorch, and scikit-
learn/scikit-learn. To reduce the training time, we re-
duce the size of the corpus utilizing the second obser-
vation discussed in Sec. 2, i.e., the size of the vocabu-
lary for a concept flattens after a few projects. We stop
adding documents to a concept, when the vocabulary
increases less than 1 % within the last five projects.
1
https://github.blog/2017-01-31-introducing-topics/
2
https://docs.github.com/en/get-started/exploring-
projects-on-github/saving-repositories-with-stars
After selecting the projects for our training cor-
pus, we join each source code file of a project to a
single document, undertake the preprocessing steps
described in Sec. 4 and store them as a BOW. The
application of LLDA then leads to a description of
concepts of interest as distributions over the vocabu-
lary. However, not always the most probable words
are the best indicators for a concept, e.g., words that
would occur in all projects very frequently would be
assigned a high probability in all topics. In order to in-
crease the interpretability of each topic, we compute
the relevance values for each term w in each topic k
according to the formula
r(w, k|λ) = λ · log(ϕ
w,k
) + (1 − λ)log
ϕ
w,k
p
w
!
, (1)
where ϕ
w,k
means the probability of the word w in
topic k and p
w
is the marginal probability of the word
w in the corpus (Sievert and Shirley, 2014). Tab. 1
shows the most relevant terms, according to a balanc-
ing factor of λ = 0.6 for the concepts Machine Learn-
ing, Mobile, Cryptocurrency, Database, and Server,
and Data Visualization. The frequency of the 50 most
relevant terms for each concept are counted in the
commit history of each developer. Based on the fre-
quency, we assign a discrete skill level between one
and five to each developer, according to his 20 %-
quantile, i.e., a developer who belongs to the 20 %
of developers who most often use the relevant words
is associated with skill level five.
5 VISUALIZATION APPROACH
Our visualization comprise two main parts: (1) the
computation of the layout, displaying semantic relat-
edness between developers, and (2) the mapping of
data to the geometric representations for each devel-
oper. The resulting visualization can be categorized as
IVAPP 2022 - 13th International Conference on Information Visualization Theory and Applications
214
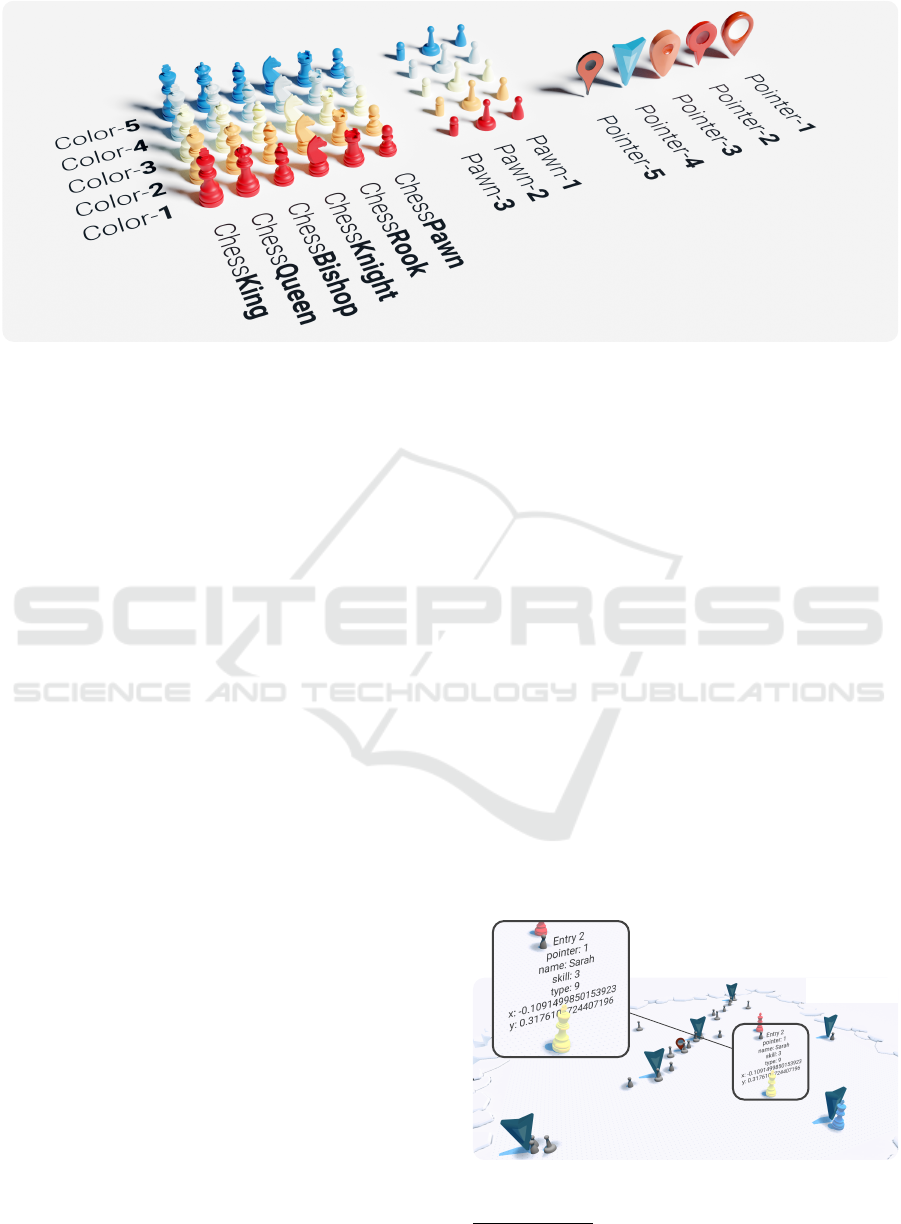
Figure 3: Exemplary atlas of 3D glyphs for representing developers and topics. This atlas uses a diverging 5-color scale for
the chess figures and the boardgame pawns. The pointers can be used as landmarks, e.g., for pinpointing the locations of
topics.
A
3
⊕ R
2
, i.e., three-dimensional graphical primitives
on a two-dimensional reference space (D
¨
ubel et al.,
2014). By adding interaction techniques, e.g., Zoom,
Rotation, and Picking, the user is enabled to explore
the map as part of the knowledge mining process.
Layout Technique. The objective of our layout
computation, is to map the similarity of two develop-
ers by Euclidean distance on a two-dimensional ref-
erence plane. Although the developers can be com-
pared with each other on the basis of their topic dis-
tributions using the Jensen-Shannon distance, the as-
sumption is implicitly made here that all topics are or-
thogonal to each other, even though topics are them-
selves distributions over the vocabulary. The lay-
out approach by Atzberger et al. circumvents this
problem. In detail, given the latent topics ϕ
1
, . . . , ϕ
K
from the corpus of commit histories, their dissimi-
larities can be measured using the Jensen-Shannon
divergence and stored in a square matrix Λ. MDS
applied on the dissimilarity-matrix Λ results in K
points
¯
ϕ
1
, . . . ,
¯
ϕ
K
∈ R
2
, such that the Euclidean dis-
tance between two points
¯
ϕ
i
and
¯
ϕ
j
represents the
entry Λ
i j
in the dissimilarity matrix (Cox and Cox,
2008). The position for a developer, described as dis-
tribution θ =
θ
(1)
, . . . , θ
(K)
over the topics, is ag-
gregated as a convex linear combination
¯
θ =
K
∑
i=1
θ
(i)
¯
ϕ
i
. (2)
Visual Mapping. Our map-related representation
shows two types of objects, topics and developers. We
decided to use modelled 3D glyphs from SketchFab
3
for their representation, as shown in Fig. 3. Our sys-
tem allows the user to manually choose a visual map-
ping supporting his task.
Topics are presented as pointers, reminding on ge-
ographical landmarks. Their purpose is to locate ex-
perts in abstracts topics hidden in the source code,
support navigating through the set of developers and
help creating a mental map. The only visual variable
is given by the size and might be accessed for map-
ping the weight of the topic for the corpus.
Developers are depicted either using pawns or
Chess figures. Using a diverging color scheme of five
colors, qualitative data can be mapped onto the visual
attribute color (Ware, 2019). Furthermore, the type
of figure, e.g., Chess:King or Chess:Knight, can also
be used for displaying qualitative information about
a developer, e.g., his rank within the software devel-
oping. Another visual attribute is the height of each
individual figure, which can be used for quantitative
data attributes. When we visualize the skill level of a
(a) Blue Print
(a) Blue Print
Figure 4: KnowhowMap showing a tooltip for a developer
to display its position and other attributes.
3
https://sketchfab.com/
Visualization of Knowledge Distribution across Development Teams using 2.5D Semantic Software Maps
215

developer, we always make use of the height of each
individual glyph.
Implementation Aspects. Our data processing
pipeline is written in the programming language
Python. We use the lemmatizer provided by the li-
brary Spacy
4
. We further use the nltk package
5
for
accessing the stopwords of the English language. For
training an LDA model, we use Gensim
6
. The train-
ing corpus, consisting of GitHub projects, required
for training an LLDA model is created using the
GitHub V3 Rest API. We use the LLDA implementa-
tion provided by the Python library Tomotopy
7
, which
implements the algorithm according to the original
paper of Ramage et al. (Ramage et al., 2009).
With respect to the visualization prototype, the
glyphs are 3D models obtained from SketchFab, that
are further processed using Blender. Each model is
associated with a description file (in JSON-format),
that specifies the attributes of each object. Our ren-
dering component is based on a WebGL-based point-
plotter written in TypeScript (Wagner et al., 2020) that
is able to process large data sets. Further, the pro-
totype supports various interaction techniques, e.g.,
Zoom, Rotation, and Picking single glyphs. Via
hoovering over a glyph, the user can access additional
information via a tooltip as shown in Fig. 4. Using the
open-source project webgl-operate
8
, our 2.5D visual-
ization is able to support labeling.
6 CONCLUSIONS
Mining developer expertise is of great interest for in-
dustrial software projects, as developers are the most
important resource for any IT organization. Existing
approaches focus on mining selected aspects of de-
veloper expertise, but do not enable the user, e.g., a
project manager, to explore the distribution of skills
and knowledge in an interactive way.
To address this problem, we propose a Visual An-
alytics framework for mining and visualizing devel-
oper expertise. Each developer is modelled by ap-
plying LDA on the commit history of all developers,
thus leading to a mathematical formalization. We fur-
ther train an LLDA model on a dynamically gener-
ated corpus of GitHub projects to locate expertise in
general concepts among developers. The 2D layout
4
https://spacy.io/api/lemmatizer
5
https://www.nltk.org/
6
https://radimrehurek.com/gensim/
7
https://bab2min.github.io/tomotopy/v0.12.2/en/
8
https://github.com/cginternals/webgl-operate
of our visualization is derived from LDA and MDS
and reflects the semantic similarity between develop-
ers and latent topics. We choose 3D glyphs as graphi-
cal representation of developers and topics. It is up to
the user to choose a mapping between the data related
to developer expertise and the visual variables of the
glyphs, e.g., color, size and shape.
However, our visualization allows different map-
pings and it is unclear which mapping is best-suited
for each individual task. There, the most important
question, that needs to be addressed in future work,
is the study of the effectiveness of our approach. We
plan to conduct a user study, by interviewing project
managers of software projects from industry. We are
optimistic that real-world feedback could help to im-
prove our visualization technique.
ACKNOWLEDGEMENTS
We want to thank the anonymous reviewers for
their valuable comments and suggestions to improve
this article. This work is part of the “Software-
DNA” project, which is funded by the European Re-
gional Development Fund (ERDF or EFRE in Ger-
man) and the State of Brandenburg (ILB). This work
is part of the KMU project “KnowhowAnalyzer”
(F
¨
orderkennzeichen 01IS20088B), which is funded
by the German Ministry for Education and Research
(Bundesministerium f
¨
ur Bildung und Forschung).
REFERENCES
Atzberger, D., Cech, T., de la Haye, M., S
¨
ochting, M.,
Scheibel, W., Limberger, D., and D
¨
ollner, J. (2021a).
Software forest: A visualization of semantic similar-
ities in source code using a tree metaphor. In Pro-
ceedings of the 16th International Joint Conference
on Computer Vision, Imaging and Computer Graphics
Theory and Applications – Volume 3 IVAPP, IVAPP
’21, pages 112–122. INSTICC, SciTePress.
Atzberger, D., Scheibel, W., Limberger, D., and D
¨
ollner, J.
(2021b). Software galaxies: Displaying coding activ-
ities using a galaxy metaphor. In Proceedings of the
14th International Symposium on Visual Information
Communication and Interaction, VINCI ’21. ACM.
Bird, C., Menzies, T., and Zimmermann, T. (2015). The art
and science of analyzing software data. Elsevier.
Blei, D. M., Ng, A. Y., and Jordan, M. I. (2003). Latent
dirichlet allocation. Journal of Machine Learning Re-
search, 3:993–1022.
Bohnet, J. and D
¨
ollner (2011). Monitoring code quality and
development activity by software maps. In Proc. 2nd
Workshop on Managing Technical Debt, MTD ’11,
pages 9–16. ACM.
IVAPP 2022 - 13th International Conference on Information Visualization Theory and Applications
216

Chen, T.-H., Thomas, S. W., and Hassan, A. E. (2016). A
survey on the use of topic models when mining soft-
ware repositories. Empirical Software Engineering,
21(5):1843–1919.
Cosentino, V., Izquierdo, J. L. C., and Cabot, J. (2015). As-
sessing the bus factor of git repositories. In 2015 IEEE
22nd International Conference on Software Analysis,
Evolution, and Reengineering (SANER), pages 499–
503.
Cox, M. A. and Cox, T. F. (2008). Multidimensional scal-
ing. In Handbook of Data Visualization, pages 315–
347. Springer.
Deerwester, S., Dumais, S. T., Furnas, G. W., Landauer,
T. K., and Harshman, R. (1990). Indexing by latent
semantic analysis. Journal of the American Society
for Information Science, 41(6):391–407.
D
¨
ubel, S., R
¨
ohlig, M., Schumann, H., and Trapp, M. (2014).
2d and 3d presentation of spatial data: A system-
atic review. In Proc. VIS International Workshop on
3DVis, 3DVis ’14, pages 11–18. IEEE.
Fritz, T., Murphy, G. C., Murphy-Hill, E., Ou, J., and Hill,
E. (2014). Degree-of-knowledge: Modeling a devel-
oper’s knowledge of code. ACM Trans. Softw. Eng.
Methodol., 23(2).
Greene, G. J. and Fischer, B. (2016). Cvexplorer: Identi-
fying candidate developers by mining and exploring
their open source contributions. In Proceedings of
the 31st IEEE/ACM International Conference on Au-
tomated Software Engineering, pages 804—-809.
Keim, D., Andrienko, G., Fekete, J.-D., G
¨
org, C., Kohlham-
mer, J., and Melanc¸on, G. (2008). Visual analytics:
Definition, process, and challenges. In Information
visualization, pages 154–175. Springer.
Kourtzanidis, S., Chatzigeorgiou, A., and Ampatzoglou,
A. (2020). Reposkillminer: Identifying software ex-
pertise from github repositories using natural lan-
guage processing. In 2020 35th IEEE/ACM Interna-
tional Conference on Automated Software Engineer-
ing (ASE), pages 1353–1357.
Kuhn, A., Erni, D., Loretan, P., and Nierstrasz, O. (2010).
Software cartography: Thematic software visualiza-
tion with consistent layout. Journal of Software
Maintenance and Evolution: Research and Practice,
22(3):191–210.
Kuhn, A., Loretan, P., and Nierstrasz, O. (2008). Consis-
tent layout for thematic software maps. In Proc. 15th
Working Conference on Reverse Engineering, WCRE
’08, pages 209–218. IEEE.
Limberger, D., Scheibel, W., D
¨
ollner, J., and Trapp, M.
(2019). Advanced visual metaphors and techniques
for software maps. In Proc. 12th International Sym-
posium on Visual Information Communication and In-
teraction, VINCI ’19, pages 11:1–11:8. ACM.
Linstead, E., Bajracharya, S., Ngo, T., Rigor, P., Lopes, C.,
and Baldi, P. (2009). Sourcerer: mining and searching
internet-scale software repositories. Data Mining and
Knowledge Discovery, 18(2):300–336.
Linstead, E., Rigor, P., Bajracharya, S., Lopes, C., and
Baldi, P. (2007). Mining eclipse developer contri-
butions via author-topic models. In Proc. 4th Inter-
national Workshop on Mining Software Repositories,
MSR ’07, pages 30:1–4.
Markovtsev, V. and Kant, E. (2017). Topic modeling of pub-
lic repositories at scale using names in source code.
arXiv CoRR cs.PL.
Ramage, D., Hall, D., Nallapati, R., and Manning, C. D.
(2009). Labeled lda: A supervised topic model for
credit attribution in multi-labeled corpora. In Proceed-
ings of the 2009 conference on empirical methods in
natural language processing, pages 248–256.
Rosen-Zvi, M., Griffiths, T., Steyvers, M., and Smyth, P.
(2004). The author-topic model for authors and doc-
uments. In Proceedings of the 20th Conference on
Uncertainty in Artificial Intelligence, UAI ’04, pages
487–494. AUAI Press.
Saxena, R. and Pedanekar, N. (2017). I know what
you coded last summer: Mining candidate expertise
from github repositories. In Companion of the 2017
ACM Conference on Computer Supported Coopera-
tive Work and Social Computing, pages 299–302.
Scheibel, W., Trapp, M., Limberger, D., and D
¨
ollner, J.
(2020). A taxonomy of treemap visualization tech-
niques. In Proc. 15th International Joint Conference
on Computer Vision, Imaging and Computer Graphics
Theory and Applications – Volume 3: IVAPP, IVAPP
’20, pages 273–280. INSTICC, SciTePress.
Sievert, C. and Shirley, K. (2014). Ldavis: A method for
visualizing and interpreting topics. In Proc. Workshop
on Interactive Language Learning, Visualization, and
Interfaces, pages 63–70. ACL.
Skupin, A. (2004). The world of geography: Visualiz-
ing a knowledge domain with cartographic means.
Proceedings of the National Academy of Sciences,
101(suppl 1):5274–5278.
Sommerville, I. (2016). Software Engineering, volume 10th
Edition. Pearson Education.
Teyton, C., Falleri, J.-R., Morandat, F., and Blanc, X.
(2013). Find your library experts. In 2013 20th Work-
ing Conference on Reverse Engineering (WCRE),
pages 202–211.
Teyton, C., Palyart, M., Falleri, J.-R., Morandat, F., and
Blanc, X. (2014). Automatic extraction of developer
expertise. In Proceedings of the 18th International
Conference on Evaluation and Assessment in Software
Engineering, EASE ’14, pages 1–10. ACM.
Tr
¨
umper, J., Beck, M., and D
¨
ollner, J. (2012). A visual anal-
ysis approach to support perfective software mainte-
nance. In 2012 16th International Conference on In-
formation Visualisation, pages 308–315. IEEE.
Tr
¨
umper, J., Bohnet, J., and D
¨
ollner, J. (2010). Understand-
ing complex multithreaded software systems by using
trace visualization. In Proceedings of the 5th Interna-
tional Symposium on Software Visualization, SOFT-
VIS ’10, pages 133––142. Association for Computing
Machinery.
Wagner, L., Scheibel, W., Limberger, D., Trapp, M., and
D
¨
ollner, J. (2020). A framework for interactive ex-
ploration of clusters in massive data using 3d scatter
plots and webgl. In Proceedings of the 25th Inter-
national Conference on 3D Web Technology, Web3D
’20, pages 31:1–2. ACM.
Ware, C. (2019). Information visualization: perception for
design. Morgan Kaufmann.
Visualization of Knowledge Distribution across Development Teams using 2.5D Semantic Software Maps
217
