
Method for Assessing Blood Flow in Segments of the Eye using
Multichannel Rheoophthalmography
Elena N. Iomdina
1
, Nina Yu. Kushnarevich
1
, Tatiana Yu. Larina
1
, Petr V. Luzhnov
2
,
Anna A. Kiseleva
2
and Elena P. Tarutta
1
1
Helmholtz National Medical Research Centre of Eye Diseases, Russia
2
Bauman Moscow State Technical University, Russia
Keywords: Rheoophthalmography, Electrical Impedance Signal, Contour Analysis, Automatic Differentiation,
Diagnostic Algorithm.
Abstract: The paper presents the issue of studying changes and redistribution of the blood flow level in different
segments of the eye using the electrical impedance method - rheoophthalmography. There are described and
considered the quantitative values using this method for the posterior segment of the eye and the retrobulbar
segment of the eye. Based on the obtained data, an algorithm for differentiation of disease stage for research
groups with myopia is proposed. The principle of its operation is described. The prospects for increasing the
efficiency of the developed algorithm are considered.
1 INTRODUCTION
Any changes in the blood supply to any organ or
tissue of the human body entail changes in its
functioning. It is also true for the human eyes
(Schmetterer L., 2012). The blood supply to the eye
covers both the area of the ciliary body in the
anterior segment of the eye and the area of the sclera
in the posterior segment of the eye. Determination of
the blood supply level to the eye segments is of
interest for many problems of ophthalmic
diagnostics (Golzan S.M., Avolio A., et al., 2012;
Michelson G., Gründler A., et al., 1994). It is known
that in ocular pathologies, in particular myopia, the
level of blood flow in different segments of the eye
changes. In this regard, particular interest to the
ophthalmologist is a study on the changes and
redistribution of blood flow in the eye segments
(Kunin V.D., Svirina T.A., 2002). This is especially
true for a group of patients with low myopia, who
are indicated for further therapy and correction.
Electrical impedance diagnostics is one of the
non-invasive methods for assessing the state of
blood flow in different areas of the human body with
minimal impact on it (Cybulski G., 2011; Vasilyeva
R.M., 2017; Bodo M., 2010). This diagnostic
method makes it possible to form diagnostic
information about the pulse blood filling of the
investigated body area, as well as information about
the biomechanical properties of blood vessels and
the level of blood flow in them. The electrical
impedance method is based on recording the
changes in total resistance during probing tissues
with high-frequency and low-amplitude current.
Currently, there are several rheoophthalmographic
(ROG) techniques for examining the eye (Avetisov
E.S., Katsnel'son L.A., et al., 1967; Lazarenko V.I.,
Kornilovsky I.M., et al., 1999). The most atraumatic
of them is the technique of transpalpebral
rheoophthalmography (TP ROG), in which
electrodes are applied to the closed upper eyelid
(Luzhnov P.V., Shamaev D.M., et al., 2017;
Luzhnov P.V., Shamaev D.M., et al. 2018). The
study of the eye blood flow during the progression
of myopia was carried out, the possibility of using
this technique for the early diagnosis of blood
supply disorders in myopic children was shown
(Luzhnov P.V., Shamaev D.M., et al. 2017;
Sokolova I.V., Yarullin K.K., et al., 1977). A feature
of signal analysis of myopic patients concerns
mainly the anterior segment of the eye.
In the general case, to assess the eye blood flow
during diagnosis, it is possible to operate with three
integral values of the blood flow level (Kiseleva
A.A., Luzhnov P.V., et al., 2020): in the anterior
segment of the eye, in the posterior segment of the
eye, and also in the retrobulbar segment of the eye
212
Iomdina, E., Kushnarevich, N., Larina, T., Luzhnov, P., Kiseleva, A. and Tar utta, E.
Method for Assessing Blood Flow in Segments of the Eye using Multichannel Rheoophthalmography.
DOI: 10.5220/0010988700003123
In Proceedings of the 15th International Joint Conference on Biomedical Engineering Systems and Technologies (BIOSTEC 2022) - Volume 1: BIODEVICES, pages 212-216
ISBN: 978-989-758-552-4; ISSN: 2184-4305
Copyright
c
2022 by SCITEPRESS – Science and Technology Publications, Lda. All rights reserved
(as input value relative to the eye). It is necessary to
develop a diagnostic algorithm for such a differential
assessment of blood flow in different parts and take
into account changes in the level of blood flow in
each segment of the eye, and the ratio of these
changes between segments.
2 MATERIALS AND METHODS
The method of electrical impedance diagnostics
allows an integral assessment of the blood flow state
in the eye vessels. At the same time, most other
diagnostic methods are based on determining the
blood filling of the eye vessels differentially.
Electrical impedance diagnostics makes it possible
to quantify blood supply not in individual arteries,
but in the vascular system of the eye as a whole. The
TP ROG technique allows a quantitative assessment
of blood supply at a level corresponding to the
anterior segment of the eye. It is achieved due to the
positioning peculiarities of the TP ROG electrodes
system (Luzhnov P.V., Shamaev D.M., et al. 2017).
Multiple electrodes systems should be used to
diagnose blood flow in multiple parts of the eye. The
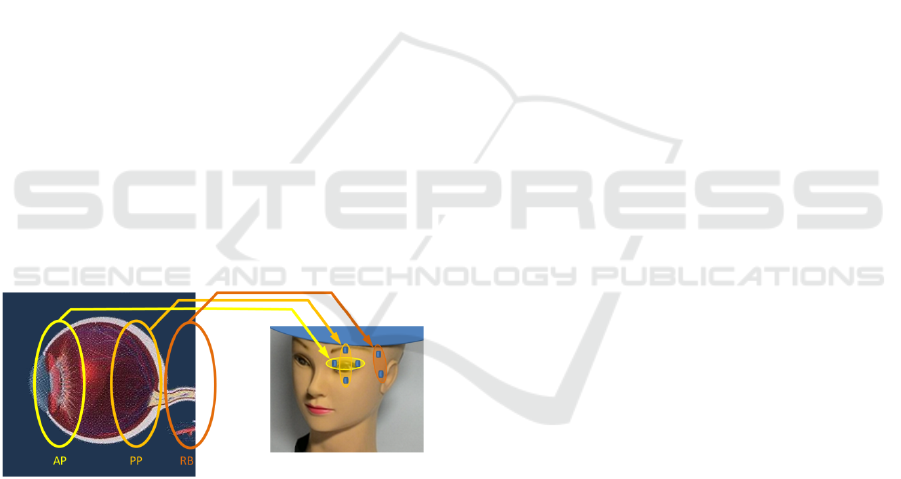
areas of study corresponding to the anterior,
posterior and retrobulbar regions are shown in Fig.1.
The corresponding positioning schemes for the ROG
measuring electrodes are shown in the figure on the
right.
Figure 1: The areas of study corresponding to the anterior
(AP), posterior (PP) and retrobulbar (RB) parts in the
multichannel rheoophthalmography technique.
To study the anterior segment of the eye, it is
advisable to use the TP ROG technique (Luzhnov
P.V., Shamaev D.M., et al. 2017), which proved itself
in the diagnosis of various stages of myopia in
children and adolescents (Luzhnov P.V., Shamaev
D.M., et al., 2015; Iomdina E.N., Luzhnov P.V., et al.,
2014). To study the posterior segment of the eye, the
method was previously used to determine blood flow
parameters in groups of patients with glaucoma. For
the study of the input blood flow, the method (Bodo
M., 2010; Sokolova I.V., Yarullin K.K., et al., 1977)
is known, which was used for the study of cerebral
circulation. In our work, the data on TP ROG
diagnostics were taken from (Luzhnov P.V., Shamaev
D.M., et al., 2015). ROG signals for the posterior and
retrobulbar segments were recorded in groups of
patients with various degrees of myopia.
To register the electrical impedance signals of
the ROG, a two-channel tetrapolar measurement
technique was used. For each channel, two pairs of
electrodes were used: two current and two
measuring. The axis of electrodes symmetry of the
posterior segment was located vertically (the first
channel). The measuring electrodes were located
along the edge of the orbit above and below the eye.
The distance between them was 4.5 cm. Measuring
electrodes of the second channel were located at the
temple. The distance between the measuring
electrodes was 2.5 cm. The second channel probing
area included the area of the ophthalmic and internal
carotid arteries. In the study we used standard self-
adhesive electrodes for functional diagnostics. The
distance between the electrodes was controlled by
measuring the distance between their centers, or the
attachment points of the lead cable. The frequency
of the probing current was 100 kHz, the amplitude
was 3 mA. Two-channel registration of the ROG
signals with a sampling rate of 200 Hz was carried
out. Then the ROG signals were filtered.
The primary analogue filtering was carried out
using a combined bandpass filter with cutoff
frequencies of 0.15 Hz and 100 Hz. It allowed
selecting the component of the ROG signal, which
reflected the process of pulse blood filling. Its
amplitude was determined by the rheographic index
(RI). The second component of the signal, called the
base impedance (BI), was formed by a low-pass
filter with a cutoff frequency of 0.15 Hz and
reflected the level of general blood filling in the
examined part of the eye.
Thus, the ROG signal was available for
calculations for each patient, from which the RI and
BI values could be determined. The average values
of RI and BI for the study group were also
calculated. Then it was possible to calculate the
relative changes in these parameters comparing the
study and the control groups. Based on these data, it
became possible to build an algorithm for
diagnosing and determining the blood supply
disorders specific for the stage of the myopic
process. This sequence implied the algorithm
development for assessing blood flow in one part of
the eye and the subsequent comparison of the data
obtained in different parts of the eye using the
signals analysis from multichannel ROG.
Method for Assessing Blood Flow in Segments of the Eye using Multichannel Rheoophthalmography
213

At the first step of the algorithm, one recorded
signal was processed. In our work, the duration of
the ROG signal was chosen to be 20 seconds.
During this period, with calm breathing, several
complete breathing cycles passed. It eliminated the
influence of breathing phases on the one signal
processing result. The computation started with a
contour analysis of the ROG signal. The contour
analysis used automatic detection of the onset of the
systole phase with a period of rapid blood filling. It
was used the threshold method used on the first
derivative of the signal. The second point of the
contour analysis was the systolic wave amplitude. It
was determined by the position of the signal local
extremum. The value of the RI amplitude was
determined by the difference in the levels of these
points. Then this stage of the algorithm was repeated
for all whole periods of cardiac cycles presented in
the analyzed signal record.
At the next step of the algorithm, the amplitude
of the ROG signal was determined as the arithmetic
mean of the amplitudes of all pulse waves included
in the 20-second recording period. The RI value
determined in this way corresponded to one value of
the BI, since the BI change in time during the
recording of the ROG signal was negligible. One
ROG signal was represented by the resulting RI-BI
score pair. For the second channel, the calculation
was done using the same step. As a result, there
were two pairs of RI-BI values for a two-channel
ROG recording in a single patient study. One pair
characterized the posterior segment of the eye, the
other pair characterized the retrobulbar segment of
the eye.
The obtained values were averaged for the entire
group of studies. The resulting averaged value made
it possible to assess the change of the indicators
value in comparison with a certain value (for
example, the norm). It also allowed comparing the
diagnostic results in different groups. To visualize
such comparison, the resulting parameters were
presented graphically on the RI-BI plane. This
presentation of the results made it possible to
analyze the obtained diagnostic data. In addition, on
the RI-BI plane, it became possible to build an
algorithm for differentiation by disease stages.
To test the developed algorithm on the basis of
the department of refraction pathology, binocular
vision and ophthalmoergonomics of Helmholtz
National Medical Research Center of Eye Diseases,
a study of the ROG signals of several groups of
patients with myopia was carried out. Simultaneous
registration of the ROG signals of the posterior and
retrobulbar parts of the eye was carried out using a
two-channel measuring transducer. During the
examination, the patient was in a horizontal position
at rest. In total, ROG signals were analyzed in 21
patients (42 eyes). When carrying out two-channel
registration, 4 groups of patients were formed:
conditionally healthy with normal vision (refraction
more than - 1.0 diopter), a group with low myopia
(from -1.0 to -3.0 diopters), a group with moderate
myopia (from -3.0 up to - 6.0 diopters) and a group
with high myopia (- 6.0 diopters and more). The first
group included 6 subjects (11 eyes) with an average
age of 23.7 years. The group with low myopia
consisted of 7 people (13 eyes) with an average age
of 14.0 years. The group with moderate myopia was
4 people (8 eyes) with an average age of 17.2 years.
The group with high myopia consisted of 5 people
(10 eyes) with an average age of 16.2 years. This
study was performed in accordance with the
Declaration of Helsinki and was approved by the
Local Committee of Biomedical Ethics of the
Helmholtz National Medical Research Center of Eye
Diseases. A written informed consent was obtained
from all participants.
3 RESULTS
The relative change in pulse blood filling in groups
with myopia was determined as the difference
between the mean value of the parameter in the
myopic group and in the group with normal
refraction (normal group), divided by the mean
value of the parameter for the normal group. In this
case, RI(PP) and BI(PP) determine the indicators for
the posterior segment, RI(RB) and BI(RB)
determine the indicators for the retrobulbar segment.
To use the developed algorithm, the norm group
was used as a control group. The magnitude of the
relative change was calculated as the difference
between the mean parameter in the group and the
mean parameter in the control group, normalized to
the mean parameter in the control group (in
percents). This value was determined for each
channel separately. The calculation results are
shown in Table 1.
Table 1: Relative change in parameters for two-channel
registration of ROG signals in percents.
Myopia
De
g
ree
RI(PP) BI(PP) RI(RB) BI(RB)
Low 4.1 22.4 5.0 29.5
Moderate -6.0 -23.6 -9.7 -2.9
High -2.6 10.0 -5.6 8.3
BIODEVICES 2022 - 15th International Conference on Biomedical Electronics and Devices
214
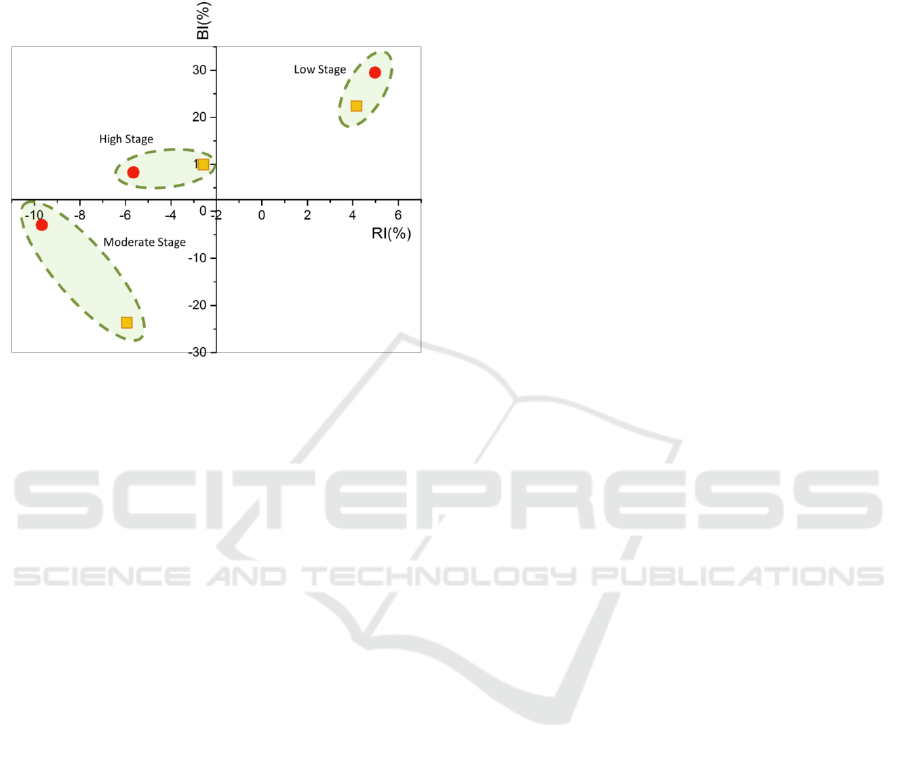
The result of the algorithm is presented
graphically in Fig.2. For each patient of the groups
with myopia, two values of diagnostic parameters
were obtained, presented by a pair of points on the
RI-BI plane.
Figure 2: The diagnostic parameters, presented by a pair of
points on the RI-BI plane for different stages of myopia.
Red markers on the graph (see Fig.2) show the
parameters of the retrobulbar segment of the eye,
orange markers show the parameters of the posterior
segment of the eye.
4 DISCUSSION
The obtained results indicate a simultaneous
increase in indicators in the temporal region and the
region of the posterior segment of the eye for a low
myopia. The points position on the graph with
moderate myopia indicates an increase in the BI
value against the background of a decrease in the
blood supply to the posterior segment. In high
myopia, it describes a decrease in the blood supply
to the posterior segment of the eye with a
simultaneous decrease in the total blood supply. This
result suggests that with a low degree of myopia, a
compensatory response from the vascular system is
observed, which manifests itself in a relative
increase in blood flow parameters.
In this work, the values of the control group were
selected as the basis for the calculation results of the
algorithm. However, the efficiency of the algorithm
can be improved if other values are used as the
origin of the RI-BI plane. It can be, for example,
parameters reflecting blood flow in the anterior
segment of the eye. The question of choosing the
origin of coordinates to achieve maximum efficiency
of the algorithm has not been fully resolved and
requires further research, including other diagnostic
methods, such as optical coherence tomography
(Iomdina E.N., Kiseleva A.A., et al., 2020) for the
posterior segment of the eye.
5 CONCLUSIONS
The use of the developed algorithm makes it
possible to present for analysis and present
graphically large data sets in multichannel ROG
studies. The use of the algorithm for groups of
patients with different myopia degrees showed the
fundamental possibility of automatic differentiation
according to the severity of the blood supply
disorders. Along with the possibility of early
diagnosis of these disorders, this will make it
possible to study blood flow disorders of the eye in
different segments with the possibility of
quantitative comparison of these disorders. With the
help of the developed algorithm, it becomes possible
to implement it within the framework of one
diagnostic technique for different ophthalmic
diseases.
ACKNOWLEDGEMENT
The authors declare that they have no conflict of
interest.
REFERENCES
Avetisov E.S., Katsnel'son L.A., Savitskaia N.F., 1967.
Rheocyclographic examinations in myopia.
VestnikOftal’mologii 80(3), pp.3–7.
Bodo M., 2010. Studies in Rheoencephalography. Journal
of Electrical Bioimpedance 1, pp.18–40.
Cybulski G., Ambulatory Impedance Cardiography. The
systems and their applications. Springer-Verlag, 2011.
Golzan S.M., Avolio A., Graham S.L., 2012.
Hemodynamic Interactions in the Eye: A Review.
Ophthalmologica 228, pp.214–221.
Iomdina E.N., Kiseleva A.A., Kotliar K.E., et al., 2020.
Quantification of Choroidal Blood Flow Using the
OCT-A System Based on Voxel Scan Processing.
2020 International Conference on Biomedical
Innovations and Applications (BIA), pp. 41-44, DOI:
10.1109/BIA50171.2020.9244511.
Iomdina E.N., Luzhnov P.V., Shamaev D.M., et al. 2014.
An evaluation of transpalpebral rheoophthalmography
as a new method of studying the blood supply to the
Method for Assessing Blood Flow in Segments of the Eye using Multichannel Rheoophthalmography
215

eye in myopia. Russian Ophthalmological Joutnal
2014(4), pp.20–24 (In Russ).
Kiseleva A.A., Luzhnov P.V., Shamaev D.M., 2020.
Verification of Mathematical Model for Bioimpedance
Diagnostics of the Blood Flow in Cerebral Vessels.
Advances in Intelligent Systems and Computing,
2020, vol 902, pp. 251-259. DOI: 10.1007/978-3-030-
12082-5_23.
Kunin V.D., Svirina T.A., 2002. Ocular blood flow
depending on the age and arterial hypertension in
healthy subjects. Glaucoma 1(1), pp.10-13.
Lazarenko V.I., Kornilovsky I.M., Il’enkov S.S., et al.,
1999. Our method of functional rheography of eye.
VestnikOftal’mologii 115(4), pp.33–37.
Luzhnov P.V., Shamaev D.M., Iomdina E.N., et al., 2017.
Using quantitative parameters of ocular blood filling
with transpalpebral rheoophthalmography. IFMBE
Proceedings, vol. 65, pp.37–40. DOI: 10.1007/978-
981-10-5122-7_10.
Luzhnov P.V., Shamaev D.M., Kiseleva A.A., et al., 2018.
Using Nonlinear Dynamics for Signal Analysis in
Transpalpebral Rheoophthalmography. Sovremennye
tehnologii v medicine 10(3), pp.160–167. DOI:
10.17691/stm2018.10.3.20.
Michelson G., Gründler A., Steinmeier R., et al., 1994.
Simultaneous measurement of ocular micro- and
macrocirculation, intraocular pressure, and systemic
functions. Ger J Ophthalmol 3(1): pp.48–53.
Schmetterer L., Kiel J.. Ocular Blood Flow. Springer,
2012.
Sokolova I.V., Yarullin K.K., Maksimenko I.M., et al.,
1977. Analysis of the structure of rheoencephalogram
as a pulse filling of blood. Journal of Nevropathol 77,
pp.1314–1321.
Vasilyeva R.M., 2017. Rheocardiography, an advanced
noninvasive circulatory system test in children and
adults: Progress and prospects. Human Physiology
43(2), pp.229–239. DOI: 10.1134/S0362119717020
165.
BIODEVICES 2022 - 15th International Conference on Biomedical Electronics and Devices
216
