
Mmsd: A Multi-modal Dataset for Real-time, Continuous Stress
Detection from Physiological Signals
Mouna Benchekroun
1,2 a
, Dan Istrate
1 b
, Vincent Zalc
1 c
and Dominique Lenne
2 d
1
Biomechanics and Bioengineering, UMR CNRS 7338, Universit
´
e de Technologie de Compi
`
egne, Compi
`
egne, France
2
Heudiasyc (Heuristics and Diagnosis of Complex Systems), Universit
´
e de Technologie de Compi
`
egne, Compi
`
egne, France
Keywords:
Multimodal Dataset, Emotion Recognition, Stress Detection, Physiological Data, Affective Computing.
Abstract:
Although chronic stress is proven to be very harmful to physical and mental well being, its diagnosis is
punctual and nontrivial, which calls for reliable, continuous and automated stress monitoring systems that
do not yet exist. Wireless biosensors offer opportunities to remotely detect and monitor mental stress levels,
enabling improved diagnosis and early treatment. There are different algorithms and methods for wearable
stress detection, however, only a few standard and publicly available datasets exist today.
In this paper, we introduce a multi-modal high-quality stress detection dataset with details of the experimental
protocol. The dataset includes physiological, behavioural and motion data from 74 subjects during a lab study.
Different modalities such as electrocardiograms (ECG), photoplethysmograms (PPG), electrodermal activity
(EDA), electromyograms (EMG) as well as three axis gyroscope and accelerometer data were recorded.
In addition, protocol validation was achieved using both subject’s self-reports and cortisol levels which is
considered as gold standard for stress detection.
1 INTRODUCTION
Stress can be defined as a complex reaction pattern
with psychological, cognitive and physiological com-
ponents. The stress response occurs whenever there
is a homeostatic imbalance caused by internal or ex-
ternal factors (Ursin and Eriksen, 2004).
While generally adaptive and safe in the short
term, the presence of stress over the long term can
be harmful to a person’s mental and physical health
(Yaribeygi et al., 2017). For example, chronic stimu-
lation of the cardiovascular system due to stress leads
to sustained increases in blood pressure and vascular
hypertrophy. Stress is also linked to immunosuppres-
sion by directly affecting a variety of hormones in-
volved in immune system function such as cytokines
profiles (Schneiderman et al., 2005),(Yaribeygi et al.,
2017).
The gold standard stress measurement modality
today is salivary cortisol levels. This measure remains
however punctual and delayed. It does not allow for
real-time stress monitoring.
a
https://orcid.org/0000-0001-5833-5776
b
https://orcid.org/0000-0001-5906-4947
c
https://orcid.org/0000-0001-5325-6649
d
https://orcid.org/0000-0002-6225-8854
Since the stress response has psychological de-
terminants as well, stress is among the psychologi-
cal concepts that can be measured through question-
naires. Several psychologists looked into the ques-
tion and developed questionnaires covering a wide
range of psychological symptoms caused by exposure
to chronic stress. State and Trait Anxiety Inventory
(STAI), for example, is the gold standard for measur-
ing preoperative anxiety (Dalal et al., 2015).
The same way as cortisol, questionnaires offer a
punctual measure. Furthermore, they are based on
subjective feedback which is not always reliable.
Given the gap in this area and the value of contin-
uous real-time stress monitoring, scientists have at-
tempted to quantify stress by measuring changes in
physiological parameters such as heart, skin and mus-
cle activity.
Thanks to biosensors that have developed a lot in
recent years, it is possible to collect various physio-
logical data during users daily life and automatically
extract information about their physiology.
Approved medical devices exist today such as
the ”AppleWatch” and the ”WithingDevices” watch
which assesses stress from the heart rate and Heart
Rate Variability (HRV). The Empatica bracelet and
the PIP device are based on skin conductance,
240
Benchekroun, M., Istrate, D., Zalc, V. and Lenne, D.
Mmsd: A Multi-modal Dataset for Real-time, Continuous Stress Detection from Physiological Signals.
DOI: 10.5220/0010985400003123
In Proceedings of the 15th International Joint Conference on Biomedical Engineering Systems and Technologies (BIOSTEC 2022) - Volume 5: HEALTHINF, pages 240-248
ISBN: 978-989-758-552-4; ISSN: 2184-4305
Copyright
c
2022 by SCITEPRESS – Science and Technology Publications, Lda. All rights reserved

whereas the SpireStones device monitors subject’s
breathing frequency to identify stress.
The main drawback common to these commercial de-
vices is the use of a single signal to detect stress,
which reduces their reliability since different psycho-
logical, or even physical states can have similar im-
pacts on the same signal.
Since stress is now recognized as a universal pre-
morbid factor, associated with several risk factors for
various chronic diseases, there is a need to improve
stress monitoring not only in clinical practice, but also
for prevention and early intervention, which is essen-
tial to avoid complications due to cardiovascular dis-
eases (Schneiderman et al., 2005). Affective comput-
ing as an emerging field could also benefit from a con-
tinuous real-time stress detection device to improve
human-computer interactions.
2 RELATED WORK
In recent years, many studies have been conducted
on stress detection from physiological parameters.
Besides signals such as electrocardiograms (ECG),
photoplethysmograms (PPG), electrodermal activity
(EDA) . . . , some scientist take interest in outward
characteristics like body posture and facial expres-
sions. In our study, the focus is put on physiologi-
cal signals as they are less sensitive to environmental
variations or noise.
Most of the studies published today are conducted
in laboratory environments using various stressors
such as public speaking, mental arithmetic and stroop
color word test (Adochiei et al., 2019). Others use
physical stressors as a cold pressor for example and
hand grip (Dickerson and Kemeny, 2004).
Although there is intensive research in the field of
stress monitoring from wearable devices, there is only
very little publicly available data.
One of the first datasets on continuous stress mon-
itoring was published by Healey et al (Healey and
Picard, 2005). The dataset includes ECG, trapezius
EMG, EDA and respiration from 24 subjects during
50min real-world driving. Protocol validation was
achieved by questionnaires and video coding for part
of the subjects. This is one of the rare studies that has
been carried out in an ambulatory environment
Koestra et al also published a dataset for emo-
tion analysis, including stress, using physiological
signals (Koelstra et al., 2011). Electroencephalo-
grams (EEG) as well as ECG, PPG, EDA, trapez-
ius EMG and respiration were recorded from 32 sub-
jects while they watched 40 videos each inducing a
different emotional reaction. Labeling was achieved
by subject’s self assessment after each trial (Koelstra
et al., 2011).
Another publicly available dataset is the
SW ELL − KW published by Koldijk.S et al (Koldijk
et al., 2014). The dataset was collected in an experi-
ment on 25 subjects in their work spaces while they
performed typical knowledge work under stressful
conditions such as time pressure and email inter-
ruptions. Various data including computer logging,
facial expression, body postures, ECG and skin
conductance were recorded in neutral and stressful
conditions. In this study, ground truth was obtained
through subjective rating thanks to various validated
questionnaires such as the Nasa Task Load Index
used to determine task load (Hart and Staveland,
1988) and Self-Assessment-Manikin Scale (SAM)
for emotion response (Bradley and Lang, 1994) and
other questionnaires.
More recently, Schmidt et al. published a multi-
modal dataset of physiological and motion data of 15
subjects during a lab study targeting three different af-
fective states: neutral, stress and amusement (Schmidt
et al., 2018). The recorded data include ECG, PPG,
EDA, trapezius EMG, respiration and three axis ac-
celeration. Subjective feedback was used once again
as ground truth through different established ques-
tionnaires such as the Positive and Negative Affect
Schedule (PANAS), a 6 item STAI, a (SAM) and a
Short Stress State Questionnaire (SSSQ).
One common disadvantage to all the studies cited
above is the small sample size generally below 30 par-
ticipants. Moreover, it is true that self-assessment is
important to have personal feedback from the subject,
but one has to keep in mind the bias of such subjective
assessment, especially when using hand-crafted ques-
tionnaires that haven’t been experimentally tested and
validated. Subjects may indeed have trouble identify-
ing their emotions.
For a more reliable validation, established psy-
chological questionnaires should be backed up by the
gold standard stress measurement which is cortisol
level.
A longitudinal study was carried out, few years
ago in our lab, that aimed to recognize stress dur-
ing users daily routine. Three sensors including an
actigraph, a punctual blood pressure manager and a
PolarH7 belt for heart activity were used to record 53
subjects during 14 days of their daily lives (Tlija et al.,
2019).
The end goal was to study the correlation between
emotional states including stress levels and prognosis
of cardiovascular disease, but it was too ambitious to
start with a long-term, ambulatory study for emotion
recognition for two reasons:
Mmsd: A Multi-modal Dataset for Real-time, Continuous Stress Detection from Physiological Signals
241

1. Study duration was too long for subjects to stay
committed all along and follow all the guidelines.
2. Signal segmentation could not be achieved
reliably because labeling was based only on
subjective journaling which was often not done
carefully by the subjects.
Given the difficulty of such longitudinal ambu-
latory user studies, we chose a more constrained
study carried out in a laboratory environment as a
starting point. The exact protocol is detailed in the
next section.
Paper Contribution
In this paper, we present a multi-modal dataset for
stress detection from physiological signals. Our
dataset bridges the gap between uni-modal devices
now available and potentially more reliable multi-
modal stress measurements based on physiological
signals.
To the best of our knowledge, it is one of the
largest datasets available on stress monitoring.
The experimental protocol is described with great
detail so that the potential user can have a global view
and a deep understanding of the data.
Physiological differences and constraints such as
cortisol fluctuation and subjects profile were taken
into consideration in the study design. The experi-
mental protocol is validated with gold-standard stress
measures which makes it suitable for stress detection
through artificial intelligence algorithms.
3 VARIATIONS IN STRESS
RESPONSES
When studying any physiological reaction of the hu-
man body, one has to be aware of the sources of vari-
ation affecting the response.
Stress is a highly personalized phenomenon that
varies between people depending on individual vul-
nerability and resilience, and between different types
of tasks (Fink, 2016). Parameters affecting the stress
response can be categorized as follows:
• Stressor’s type: Subject’s stress response depends
on the intensity/severity of the stressor, its con-
trollability as well as personal features that deter-
mine the cognitive reactions to each stressor type
(Schneiderman et al., 2005).
• Subject dependant variations: Each individual’s
response to stress is determined by a multitude
of genetic, personal and environmental factors.
Coping skills, personality, psychiatric history and
sociodemographic variables also have an impor-
tant impact on the stress perception and recovery
(Kendler et al., 2003).
• Activity dependant variations: Stress response
characteristics also vary with physical activity
(walking VS running, standing VS sitting . . . )
(Alamudun et al., 2012). Shumm et al. found
that EDA is sensitive to subject’s movement. They
concluded that the faster a person is walking the
more uniformly distributed the skin conductance
(Schumm et al., 2008).
Heart rate is also subject to posture-related
changes. A significant increase in heart rate as a
subject transitions from supine to sitting; from sit-
ting to standing, and from standing to walking has
been reported in a study carried out by (Van Stee-
nis and Tulen, 1997).
These variations should be taken into consider-
ation when designing a user study for stress detec-
tion. Efforts should be made to tackle these sources
as much as possible by controlling the stressors, the
environment and subject-related variations by estab-
lishing a subject profile.
It is true that the end goal is ambulatory stress de-
tection in user’s daily life, but this requires to test and
validate continuous stress detection methods in con-
strained environments, where these sources of varia-
tion are kept to a minimum, as a first step.
Another very important aspect in such studies is
the use of gold-standards for protocol validation.
4 DATA COLLECTION PROCESS
Once our experimental protocol was approved by The
INSEAD Institutional Review Board (IRB : 202077),
INSEAD Behavioural Lab team took charge of sub-
ject’s recruitment and management. Participants
(aged 18 and older) were invited by email to take an
online survey (the pre-selection questionnaire intro-
duced below) in order to verify their eligibility to the
study.
4.1 Eligibility Criteria Selection
Subjects had to be selected in accordance with ethical
criteria as well as the constraints related to the study
itself.
A pre-selection questionnaire was used as a
first step in volunteers selection process with four
objectives:
HEALTHINF 2022 - 15th International Conference on Health Informatics
242

1. Exclude Non Eligible Volunteers:
Subjects were selected in order to have a sta-
tistically representative sample of the french
population in terms of age and gender. Exclusion
criteria included volunteers suffering from: car-
diovascular diseases, chronic diseases (diabetes,
hypertension and mental disorders (depression,
dementia . . . ) since these conditions may have an
impact on the collected physiological data.
2. Build a Subject Profile:
The pre-selection questionnaire was also used
to collect general information about lifestyle
elements that would potentially affect the stress
response such as: the participant’s level of
physical activity, eating habits, sleeping habits,
meditation, . . .
These elements could be used in data interpreta-
tion.
3. Enunciate Guidelines:
Guidelines were given in the pre-selection
questionnaire to check volunteer’s acceptability
to wear the biosensors and their willingness to
respect some instructions. For example, selected
subjects were asked to abstain from alcohol,
caffeine/theine and tobacco, 12 hours, 4 hours
and 2 hours respectively before the experiment.
4. Measure Perceived Stress:
The questionnaire also includes a PSS4 (Per-
ceived Stress Scale) consisting of 4 questions.
This scale assesses the state of perceived stress
and measures the degree to which situations in
one’s life are appraised as stressful (Warttig et al.,
2013).
4.2 Participants
227 participants volunteered to take part of our study.
57 were rejected due to exclusion criteria and 74
healthy subjects were selected from the remaining
volunteers. Our objective was to form a representa-
tive sample of the French population in terms of age
and gender. Figure 1 summarizes the selection pro-
cess. The final sample includes 38 women aged 19 to
63 years old (mean age: 33 y.o ± 12.5) and 36 men
aged 21 to 79 years old (mean age: 35 y.o ± 13).
4.3 Sensors
For data collection, we used Shimmer Sensing
biosensors for all physiological data. Four sig-
nals were selected to study their correlation with
stress: electrocardiogram (ECG), photoplethysmo-
gram (PPG), electrodermal activity (EDA) and elec-
tromyogram (EMG). Sensors configuration is de-
picted in figure 2
ECG is recorded using four self-adhesive elec-
trodes for three leads included in Einthoven triangle.
Two electrodes were placed across the heart, below
the collar-bones, a third one below the chest, and the
grounding electrode in the middle chest.
Pulse is recorded thanks to a transmission Photo-
plethysmograph sensor (PPG) from the right earlobe.
Transmission PPG sensors detect light passed through
the tissue and are therefore commonly used on periph-
eral sites such as fingers and earlobes. We chose the
latter location since it is less sensitive to motion arte-
fact and tissue alterations caused by both voluntary
and involuntary movements as there is no muscle ac-
tivity.
Electrodermal activity is recorded with sticker
electrodes on the participant’s non dominant hand.
One electrode is placed on the palmar surface of the
index medial phalange and the other on the palmar
surface of the middle fingers’ distal phalange.
For trapezius muscle activity, positive and nega-
tive electrodes are placed in parallel with the muscle
fibres, near the centre of the right and left muscle,
2cm apart from each other. The reference electrode
is placed at the elbow as an electrically neutral point
of the body far from the muscle being measured.
ECG, pulse and EDA are recorded at 512Hz
whereas EMG is digitized at 1024Hz.
Recorded data was stored locally in sensors SD
card and transferred at the same time via Bluetooth
to a computer for further processing after the exper-
iment. Shimmer Sensing software (ConsensysPro)
was used to manage data and devices.
All the devices used in the study are equipped with
gyroscope sensors that can measure the orientation
and angular velocity of the device. Three axis gy-
roscope data is available for each of the sensors intro-
duced above.
Computer logging including response time and
task duration were also automatically saved to an SQL
database.
4.4 Experimental Protocol
The goal of this study is to elicit three different affec-
tive states (relaxation, stress and neutral) and identify
correlations between physiological signals and these
states.
To minimize the effect of the different sources of vari-
ation on the stress response, the study is carried out
under laboratory conditions, where the environment is
Mmsd: A Multi-modal Dataset for Real-time, Continuous Stress Detection from Physiological Signals
243
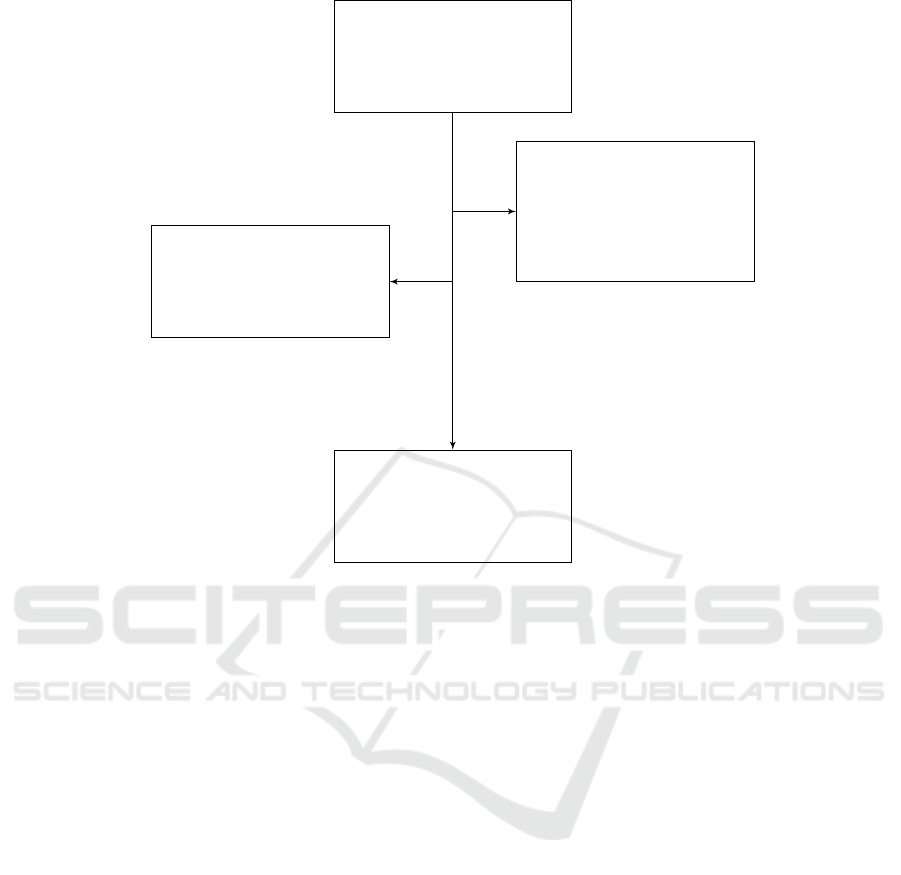
Number of volun-
teers interested in
the study N=227
Waiting list n = 96
Excluded n = 57
Heavy smoking: 9
Mental disorders: 10
Chronic diseases: 5
Medication/drugs: 13
Other diseases: 20
Selected subjects n = 74
Figure 1: Subject selection process.
controlled and movement is reduced. The experimen-
tal protocol is detailed below and depicted in figure
3:
1. Relaxation/Meditation: Subject is invited to
relax thanks to a 15min guided meditation session
instructed via an audio track. Subjects followed
the instructions with closed eyes, while sitting in
a comfortable position in a dark environment.
2. Stress: Subject performs various stressful tasks
such as the Stroop color word test, mental
arithmetic and other serious games previously
proven to induce mental stress (Dickerson and
Kemeny, 2004). A score as well as a red timer
are used to increase pressure. Subjects were not
aware that the main goal of this step is to induce
stress. Instead, they were told the tasks are used
to compute a QI score.
This phase lasted for around 20min.
3. Recovery: At the end of the protocol, data was
recorded for an additional 10min while subject
is asked to stay seated with a calm music back-
ground.
The purpose of this step is to evaluate how sub-
jects recover from a stressful stimuli.
The study lasts for about 80 minutes. All the trials
took place in the afternoon in order to avoid the wake-
up cortisol peak and because cortisol levels are stead-
ier in the afternoon (Dickerson and Kemeny, 2004).
4.5 Labeling and Protocol Validation
Since the main purpose of our study is to use machine
learning algorithms to classify each state, we needed
to validate our protocol beforehand in order to make
sure subject’s affective state matches the experimen-
tal protocol. Two different measures were used as
labels:
1. Cortisol Samples:
Saliva samples were collected after the first and
second phases (baseline and stress respectively) as
a gold standard measure of stress. We expect cor-
tisol levels to be higher in the second sample with
comparison to the first one. Since cortisol lev-
els vary throughout the day with the highest peak
reached few hours after waking up, as explained
earlier, all trials took place in the afternoon (after
2pm) to make sure the wake-up peak does not re-
verse the increase in cortisol levels from the first
to the second sample.
HEALTHINF 2022 - 15th International Conference on Health Informatics
244
(a) ECG sensor. (b) PPG sensor.
(c) EDA sensor.
(d) EMG sensor.
Figure 2: Sensors configuration.
2. STAI-S:
State-Trait Anxiety Inventory (STAI) question-
naire comprises separate self-report scales for
measuring two distinct anxiety concepts: trait
anxiety (STAI − T ) and state anxiety (STAI − S).
Each scale is made up of 20 questions.
The first one is to assess subjects’ anxiety as
a personality trait and is used, together with
the PSS4, explained in section 4.1, for data
interpretation.
The second one measures anxiety as an emotional
state linked to a particular situation. The STAI − S
is used as a subjective label after each phase to-
gether with cortisol levels to validate our protocol.
Since cortisol is considered to be a stress hor-
mone, we expect cortisol levels to be higher in the
second sample taken after the stress phase with com-
parison to the first one. STAI − S scores should also
be higher if the subject was indeed stressed in the sec-
ond phase.
The combination of both physiological and sub-
jective labels makes the validation process more reli-
able.
4.6 Dataset
Our dataset includes different types of parameters
summarized in table 1 from 74 subjects, 38 women
aged 19 to 63 years old (mean age: 33 y.o ± 12.5)
and 36 men aged 21 to 79 years old (mean age: 35
y.o ± 13). Each parameter can be used either for data
interpretation, classification or labeling depending on
the end purpose. Some examples are presented but
are not limited to table 1.
Mmsd: A Multi-modal Dataset for Real-time, Continuous Stress Detection from Physiological Signals
245
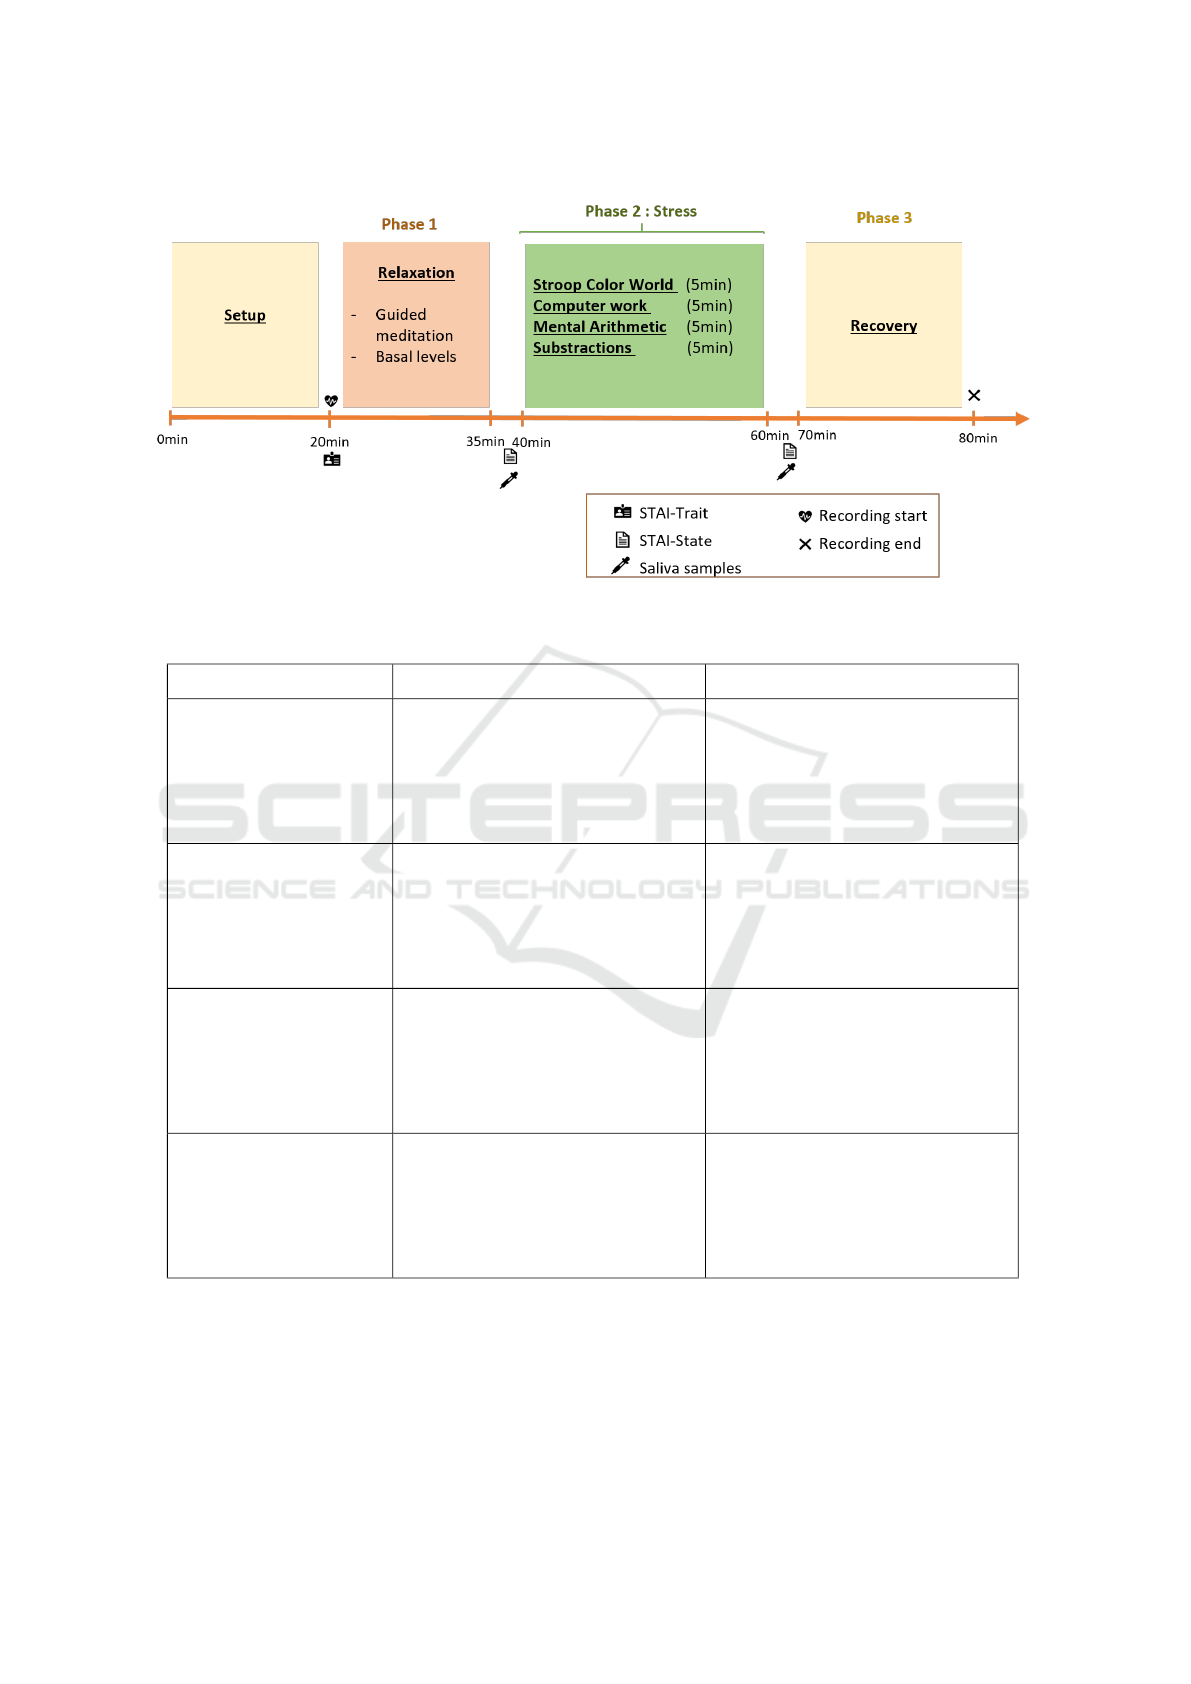
Figure 3: Study experimental protocol.
Table 1: Types and potential use of collected data.
Type Data Use
Profil Data
Sex,age . . .
Eating and sleeping habits
Exercising
Medidation
Interpretation
Subjective/Phsycological
PSS4 and STAI-T
STAI-S
Interpretation
Labeling
Behavioural
Responses Time
Successes and failures in trials
Task duration
Interpretation
and/or segmentation
Physiological
Electrocardiogram (ECG)
Photoplethysmogram (PPG)
Electrodermal Activity (EDA)
Electromyogram (EMG)
Three axis gyroscope data
Salivary Cortisol Levels
Data Analysis
Classification
Interpretation
Labeling
The dataset features physiological signals such as
ECG, PPG, EDA digitalised at 512Hz and EMG at
1000Hz, as well as motion data from 74 subjects for
a total duration of 40 minutes per subject, segmented
in three sessions as explained in section 4.4. The first
phase, Relaxation phase, is referred to as session 1,
session 2 is the Stress phase and session 3 is the Re-
covery.
HEALTHINF 2022 - 15th International Conference on Health Informatics
246

5 CONCLUSIONS
The experimental protocol presented in this paper
takes into consideration many of the sources of varia-
tion encountered in previous studies. Its main purpose
was to induce three states: relaxation, stress and neu-
tral/baseline.
The study was carried out in a constrained envi-
ronment and protocol validation was achieved using
both psychological self-reports and ground truth cor-
tisol levels which makes it reliable for machine learn-
ing algorithms. The dataset includes high-quality
physiological modalities commonly used in commer-
cial and medical devices for stress identification like
ECG, PPG, EDA, EMG and three axis gyroscope
data. Thanks to the high number of participant as
well as their diversity in terms of age and gender, it
is possible to draw reliable conclusions and statistical
generalisation.
The dataset will be made publicly available once
data cleaning and organisation are complete. It could
be used in many different ways to study the correla-
tion between various physiological signals with stress
and/or stress recovery in a uni-modal or multi-modal
approach. It could also be used to compare chest-
based ECG device to earlobe PPG in terms of signal
quality, prep-rocessing, and classification results. The
self-reports could be utilized to create personalised
models able to detect and predict a person’s specific
affective state.
ACKNOWLEDGEMENTS
Authors would like to thank Idex Sorbonne Univer-
sity for funding this experimental study as part of
french state support for ”Investissements d’Avenir’
program”. Also thanks to all the subjects and to IN-
SEAD lab for their expertise in participant recruit-
ment and management which made the process ex-
tremely easier.
ETHICS DECLARATIONS
All volunteers gave their informed written consent in
accordance with the Declaration of Helsinki and fol-
lowing approval from and in accordance with the IN-
SEAD Institutional Review Board (IRB : 202077).
REFERENCES
Adochiei, I., Adochiei, F., Cepisca, C., Seritan, G., Enache,
B., Argatu, F., and Ciucu, R. (2019). Complex em-
bedded system for stress quantification, 2019 (atee).
WOS: 000475904500049.
Alamudun, F., Choi, J., Gutierrez-Osuna, R., Khan, H., and
Ahmed, B. (2012). Removal of subject-dependent and
activity-dependent variation in physiological mea-
sures of stress. In 2012 6th International Conference
on Pervasive Computing Technologies for Healthcare
(PervasiveHealth) and Workshops, pages 115–122.
IEEE.
Bradley, M. M. and Lang, P. J. (1994). Measuring emotion:
the self-assessment manikin and the semantic differ-
ential. Journal of behavior therapy and experimental
psychiatry, 25(1):49–59.
Dalal, K. S., Chellam, S., and Toal, P. (2015). Anaesthesia
information booklet: Is it better than a pre-operative
visit? Indian journal of anaesthesia, 59(8):511.
Dickerson, S. S. and Kemeny, M. E. (2004). Acute stres-
sors and cortisol responses: a theoretical integration
and synthesis of laboratory research. Psychological
bulletin, 130(3):355.
Fink, G. (2016). Chapter 1—stress, definitions, mech-
anisms, and effects outlined: lessons from anxiety.
Stress: Concepts, Cognition, Emotion, and Behavior;
Fink, G., Ed, pages 3–11.
Hart, S. G. and Staveland, L. E. (1988). Development of
nasa-tlx (task load index): Results of empirical and
theoretical research. In Advances in psychology, vol-
ume 52, pages 139–183. Elsevier.
Healey, J. A. and Picard, R. W. (2005). Detecting stress dur-
ing real-world driving tasks using physiological sen-
sors. IEEE Transactions on intelligent transportation
systems, 6(2):156–166.
Kendler, K. S., Hettema, J. M., Butera, F., Gardner, C. O.,
and Prescott, C. A. (2003). Life event dimensions of
loss, humiliation, entrapment, and danger in the pre-
diction of onsets of major depression and generalized
anxiety. Archives of general psychiatry, 60(8):789–
796.
Koelstra, S., Muhl, C., Soleymani, M., Lee, J.-S., Yazdani,
A., Ebrahimi, T., Pun, T., Nijholt, A., and Patras, I.
(2011). Deap: A database for emotion analysis; using
physiological signals. IEEE transactions on affective
computing, 3(1):18–31.
Koldijk, S., Sappelli, M., Verberne, S., Neerincx, M. A., and
Kraaij, W. (2014). The swell knowledge work dataset
for stress and user modeling research. In Proceedings
of the 16th international conference on multimodal in-
teraction, pages 291–298.
Schmidt, P., Reiss, A., Duerichen, R., Marberger, C., and
Van Laerhoven, K. (2018). Introducing wesad, a
multimodal dataset for wearable stress and affect de-
tection. In Proceedings of the 20th ACM interna-
tional conference on multimodal interaction, pages
400–408.
Schneiderman, N., Ironson, G., and Siegel, S. D. (2005).
Stress and health: psychological, behavioral, and bi-
Mmsd: A Multi-modal Dataset for Real-time, Continuous Stress Detection from Physiological Signals
247

ological determinants. Annu. Rev. Clin. Psychol.,
1:607–628.
Schumm, J., B
¨
achlin, M., Setz, C., Arnrich, B., Roggen, D.,
and Tr
¨
oster, G. (2008). Effect of movements on the
electrodermal response after a startle event. Methods
of Information in Medicine, 47(03):186–191.
Tlija, A., Istrate, D., Gattoufi, S., and Bennani, A.-E.
(2019). Stress recognition using connected devices:
experimentation feedback. In Journ
´
ees d’Etude sur la
T
´
el
´
eSant
´
e.
Ursin, H. and Eriksen, H. R. (2004). The cognitive acti-
vation theory of stress. Psychoneuroendocrinology,
29(5):567–592.
Van Steenis, H. and Tulen, J. (1997). The effects of physical
activities on cardiovascular variability in ambulatory
situations [ecg/accelerometry analysis]. In Proceed-
ings of the 19th Annual International Conference of
the IEEE Engineering in Medicine and Biology Soci-
ety.’Magnificent Milestones and Emerging Opportuni-
ties in Medical Engineering’(Cat. No. 97CH36136),
volume 1, pages 105–108. IEEE.
Warttig, S. L., Forshaw, M. J., South, J., and White, A. K.
(2013). New, normative, english-sample data for the
short form perceived stress scale (pss-4). Journal of
health psychology, 18(12):1617–1628.
Yaribeygi, H., Panahi, Y., Sahraei, H., Johnston, T. P., and
Sahebkar, A. (2017). The impact of stress on body
function: A review. EXCLI journal, 16:1057.
HEALTHINF 2022 - 15th International Conference on Health Informatics
248
