
A Data Driven Investigation on the Relationship between Tests,
Confirmed Cases and Positive Rate: The Case of Greece
Nikolaos Papadakis
a
and Dimitrios Bakirtzis
Hellenic Mediterranean University, School of Applied Sciences, Department of Mechanical Engineering, Greece
Keywords:
COVID-19, Confirmed Sases, Positive Rate, RT-PCR, Greece.
Abstract:
While the pandemic of COVID-19 has proved a global challenge for humanity, it has also provided an un-
precedented opportunity to study infectious diseases because of the globally coordinated effort to collect daily
data and make it publicly available. As a result, it is possible to access data and try to improve on models and
approaches. It is probably, so far, the largest effort to conduct testing on population at a global scale for an
infectious disease. The aim of this project is to report on the relationship between the daily values of the test
samples, the confirmed cases and the positive rate for COVID-19 in Greece. A discussion on the volatility of
the reported metrics by media coverage is carried out, to highlight the potential pitfalls of using the confirmed
cases or positive rate in isolation. For the case of Greece, a dependence in the number of tests and confirmed
cases on the weekdays is identified. That dependence seemed to decrease with increasing number of tests.
A comparison takes place between Greece and Austria which is a country with a similar size and also data
regarding the RT-PCR tests and antigen tests are publicly available.
1 INTRODUCTION
During the COVID-19 pandemic, the media cov-
erage usually revolves around the daily number of
confirmed cases and the daily number of casualties.
Those quantities (the confirmed cases and deaths) are
used as indicators of the current state of the pandemic.
Usually there is no mention of the daily number of
tests. However, it is logical that there should be a
relationship between tests and confirmed cases. I.e.
more tests are more likely to produce more confirmed
cases. Therefore quoting in isolation the number of
confirmed cases can be misleading.
For example, 500 confirmed cases carry a totally
different interpretation and significance in the context
in case of 1000 or 1000000 performed tests. There-
fore, quoting the number of cases would be more
meaningful if the number of daily performed tests re-
mained constant or if they were somehow included in
the quantity that is reported.
Obviously, controlling the number of tests in a
meaningful manner is not possible in this context, so
the use of Positive Rate conveys useful information
from both confirmed cases and tests, because it is de-
fined as the ratio of confirmed case to the number of
tests. However, the positive rate can also be mislead-
a
https://orcid.org/0000-0001-5909-5559
ing when there is high fluctuation in the number of
tests.
Another common metric is the Rate of Transmis-
sion (R
t
or R
0
) which is depended mainly on the num-
ber of confirmed cases. However, the rate of transmis-
sion is not usually reported by media. This is prob-
ably R
t
values keep changing as new data become
available. Therefore, by the time, the R
t
values stop
changing (usually after a week or so depending on the
algorithm), there is little point in reporting them to the
public.
1.1 Description of Case of Greece
In the particular case of Greece, the media coverage
of the COVID-19 focuses on the number of confirmed
cases. As mentioned before, focusing only on that
quantity can be misleading as an indicator of the pan-
demic’s current state. In Greece, it is more evident
because there is a weekly variation in terms of daily
performed tests, which in turn affects the confirmed
cases.
Figure 1 presents the absolute number of per-
formed RT-PCR tests grouped per weekday for a pe-
riod of 62 weeks.
It can be seen that, while Tuesday to Saturday ap-
pear to have similar max values, Monday and Sun-
Papadakis, N. and Bakirtzis, D.
A Data Driven Investigation on the Relationship between Tests, Confirmed Cases and Positive Rate: The Case of Greece.
DOI: 10.5220/0010975300003123
In Proceedings of the 15th International Joint Conference on Biomedical Engineering Systems and Technologies (BIOSTEC 2022) - Volume 5: HEALTHINF, pages 777-784
ISBN: 978-989-758-552-4; ISSN: 2184-4305
Copyright
c
2022 by SCITEPRESS – Science and Technology Publications, Lda. All rights reserved
777

Figure 1: Absolute number of RT-PCR tests grouped per
weekday.
day have comparably lower max values. Also, the
100 percentile for Monday and Sunday is approxi-
mately equal or less than the median of the other
days). So, the reported number of tests in Greece is
usually greater at days following the working week-
days (Tuesday to Saturday), and falls on the days fol-
lowing weekend days (Sunday and Monday).
Figure 2 presents the absolute number of con-
firmed cases grouped per weekday. It can be seen
that Tuesday has the highest max value. Wednesday
to Saturday appear to have similar max values, while
Monday and Sunday appear to have similar max val-
ues which are lower than the rest.
Figure 2: Absolute number of confirmed cases grouped per
weekday.
Similarly to the pattern observed in tests, the ab-
solute number of confirmed cases is usually greater
in days following working weekdays, and falls during
the days following weekend days.
Figure 3 presents a representative part of the time
series for confirmed cases, RT-PCR tests and posi-
tive rate which corresponds to July of 2021. The red
shaded areas correspond to weekend, where the num-
ber of tests is smaller, and it can be seen that the pos-
itive rate increases significantly on Sundays.
1.2 Normalising Confirmed Cases and
Tests with Respect to Weekly
Average
When examining a quantity (e.g. the confirmed cases
or the number of tests) to determine the influence of
the weekdays, the absolute numbers contain two dif-
ferent sources of variability. I.e. any variation within
Figure 3: Detail of time series for confirmed cases, RT-PCR
tests and Positive rate, the red areas center around a Sunday.
the week (short term) and also the current state of the
pandemic which has a greater time scale (long term).
For example, if the confirmed cases are consid-
ered, then a value of 10 in a week when there are only
a few cases (e.g. 10) can have a totally different mean-
ing within the context of a week with a rash of cases
(e.g. 1000).
Therefore, in order to isolate the effect of the
weekday on the quantity, a normalisation is consid-
ered. Each daily value within a week is normalised
with respect to the week’s average. The aim of this
normalisation is to report the number of confirmed
cases relative to the week’s average. Reporting the
daily quantity as a percentage of the weeks average al-
lows a more meaningful intra-week comparison (i.e.
independently of the disease state). The duration of
the week is selected because it is considered as a time
unit.
The fact that the week can be considered a good
time unit can be evidenced by applying an Auto Cor-
relation Function (ACF) (Park, 2018), (Papoulis and
Pillai, 2002), (Box et al., 2015), (Percival, 1993), ,
or measure the Allan Variance (Allan, 1966),(Scharf
et al., 1995), (Percival and Mondal, 2012),(Lu et al.,
2013), (Malkin, 2012). In the ACF case, there is a
higher correlation value every 7th day (see Figure 4
top). The Allan variance shows that the minimum
standard deviation is when the samples are 6 days
apart (so every 7th day) — see Figure 4 bottom.
Figure 5 presents the tests per weekday nor-
malised with respect to the average tests for the cor-
responding week. On Monday and Sunday the cases
are significantly lower (less than 50%).
Figure 6 presents the confirmed cases per week-
day normalised with respect to the average of the cor-
responding week. It can be seen that on Monday
and Sunday the cases are significantly lower (close
to 50%)
From Figures 5 and 6 it can be seen that although
the normalised values of Sundays and Mondays are
lower than the other days, the median of the nor-
malised values are in general the same between tests
and confirmed cases. E.g. although the normalised
COVID-ex 2022 - Special Session on "COVID-19 epidemic data mining and EXploration"
778
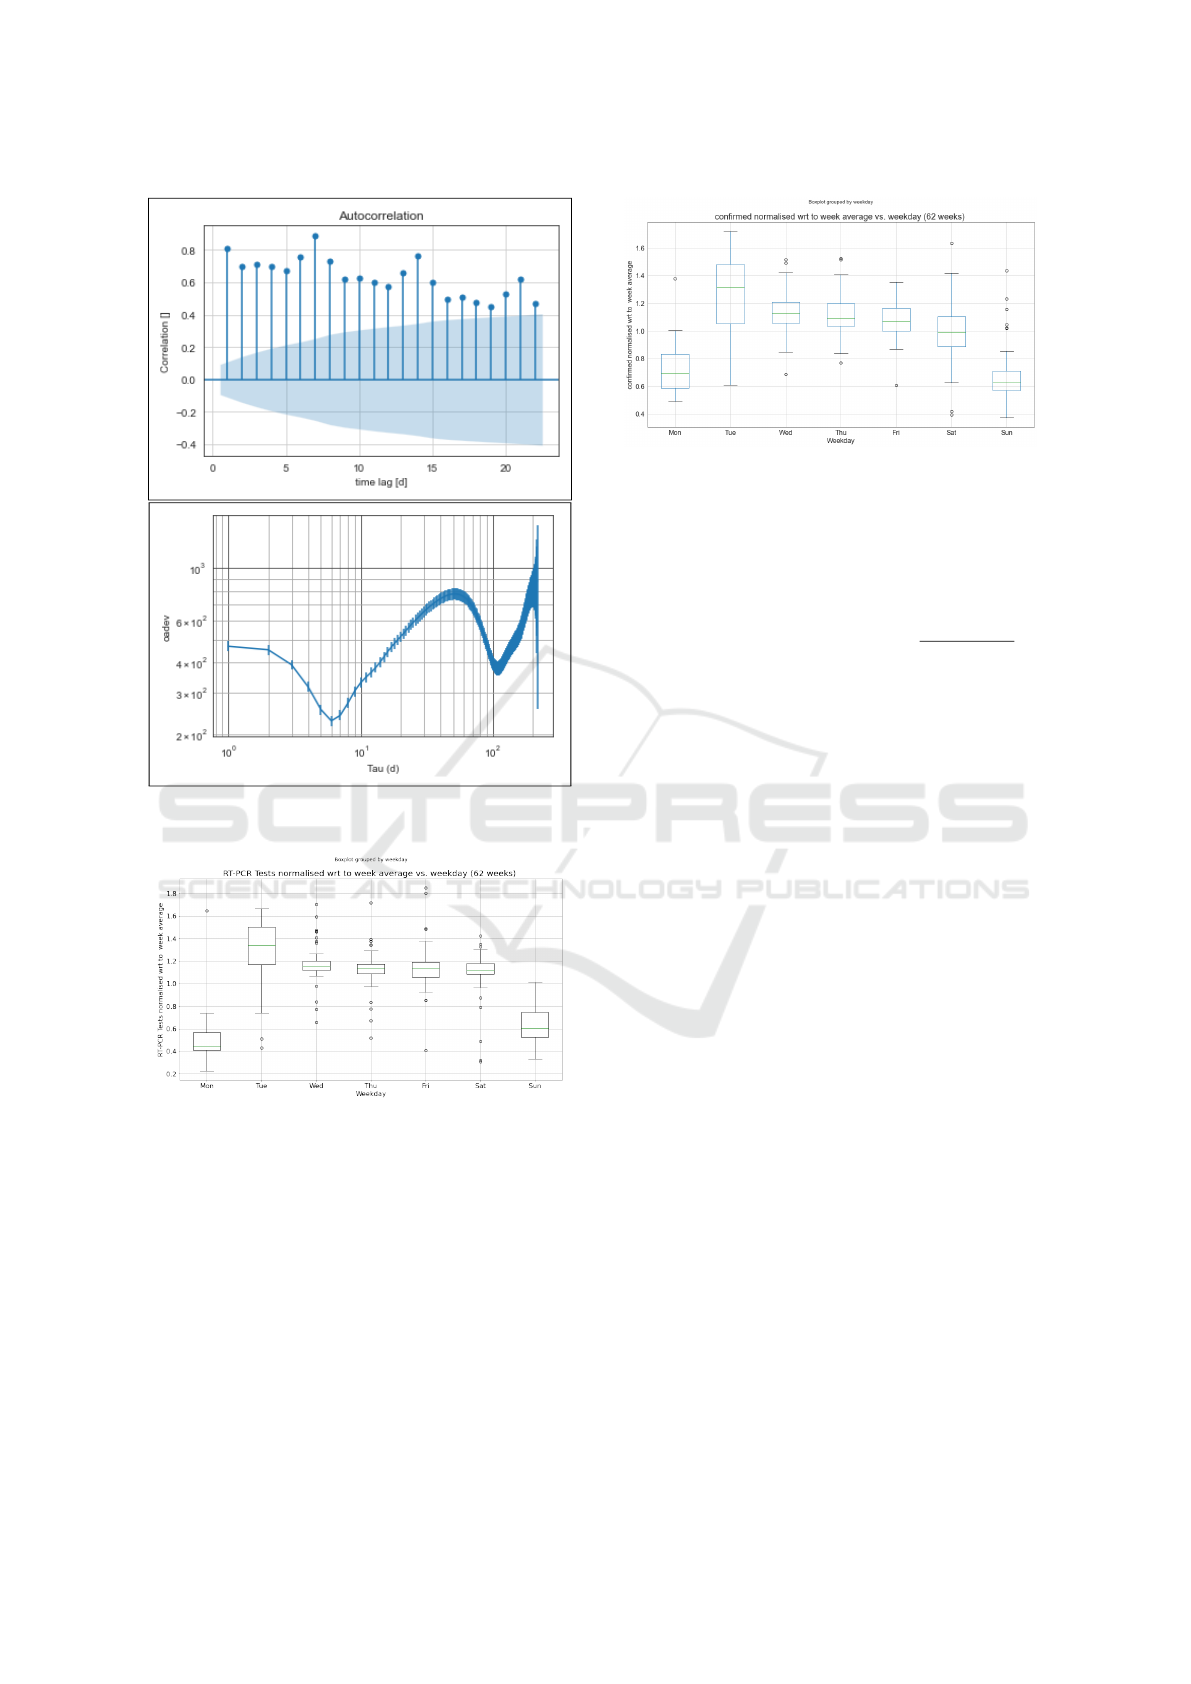
Figure 4: ACF (top) and Allan variance (bottom) for the
confirmed cases.
Figure 5: tests cases normalised with respect to week aver-
age vs. weekday.
confirmed cases for Tuesday are approximately about
30% of the week average, the number of tests are also
increased by approximately the same. The only ex-
ception is Monday, in which the median of the nor-
malised confirmed cases are about 45% of the week’s
average compared to the normalised tests which are
about the 70% of the weeks average.
This is in agreement with Figure 3, which shows
a more smooth progression of the positive rate, fol-
lowed by a brief peak of the positive rate on Mondays.
This is attributed to the smaller number of tests that
are reported on Mondays (close to 50% of the weeks
Figure 6: Confirmed cases normalised with respect to week
average vs. weekday.
average). Additionally the tests that are reported on
Monday are carried out on Sunday, usually on peo-
ple with more grave symptomatology (so they are less
random).
Therefore, reporting the positive rate —i.e. con-
firmed cases over number of tests (
confirmed cases
number of tests
)—
can also have huge fluctuations due to the dependence
between tests and confirmed cases mentioned above
(this is not a case of random sampling, usually people
submitted to a RT-PCR test have either a symptom or
an exposure).
The aim of this paper is to investigate the relation-
ship between the confirmed cases and the number of
tests. To make the comparison feasible the ratio of the
daily reported value is normalised with respect to the
smoothed value, and the respective ratio for the tests.
Additionally, differences between the total num-
ber of tests and RT-PCR tests are reported and con-
trasted with respect to their effect on the confirmed
cases. The dataset of Greece is selected because apart
from data on confirmed cases there are available data
for RT-PCR tests and rapid tests.
2 METHODOLOGY
2.1 Raw Data Collection
The data is collected through the publicly available
dataset at covid-19-greece herokuapp. The data sets
that are downloaded are:
• confirmed cases
• rapid tests
• RT-PCR tests
The data that were collected cover a period be-
tween the 1st of January 2020 until the 6th of October
2021.
The daily data have been checked against the Our
World in Data (OWID) dataset, and they were found
A Data Driven Investigation on the Relationship between Tests, Confirmed Cases and Positive Rate: The Case of Greece
779

in good agreement. The Greek Heroku dataset was
selected because it offers more granular data for the
number and type of tests.
2.2 Preprocessing
2.2.1 Data Cleaning and Outliers
In the dataset some values were detected as abnormal
and they were removed from the dataset. More specif-
ically:
• negative number of tests were recorded
• on 2021-05-02 about minus 3.5 million rapid tests
and minus 4.6 million RT-PCR tests were re-
ported, and on 2021-05-03 about the same number
was added.
In the above cases, the relevant data were dropped
from the dataset.
Additionally, on the 4th, 6th, 7th and 8th of June
2020 the number of confirmed cases is non zero,
while the number of tests is zero. On those dates the
tests were set equal to the number of confirmed cases.
2.2.2 Smoothing Algorithm
The data exhibited a repeated pattern, i.e. 5 days a
week the number of RT-PCR and rapid (antigen or
Lateral Flow Device) tests were considerably greater
than the other two. Figure 7 presents the time series of
the confirmed cases and the RT-PCR tests (although
not presented here the variability of the total tests is
even greater).
Figure 7: Time series of confirmed cases and PCR tests dur-
ing the entire data collection period.
This is attributed to the fact that usually the cases
and tests carried out on a day are reported on the next
day. Therefore the tests and confirmed cases of the
weekend are reported on Sunday and Monday. Lower
number of tests are more likely to yield a lower abso-
lute number of confirmed cases.
The smoothing methodology uses a weighted
moving average with a centred Gaussian window (4
stds), with a window period of 15 days. The dates at
the ends of the time series are removed.
The OWID dataset uses a similar methodology
with a moving average of 7 days, which is not cen-
tred.
2.2.3 Handling of Tests
The Greek Heroku dataset includes data for both rapid
tests and RT-PCR tests. Figure 8 presents the num-
ber of RT-PCR and rapid tests in log scale. For the
rapid tests, a significant variation is evident as time
progresses.
Figure 8: Comparison of RT-PCR and rapid tests in log
scale.
Apart from the fact that the RT-PCR tests ap-
pear to be stable in numbers, there are other signif-
icant differences in RT-PCR and rapid tests (at least
in Greece). Rapid tests are performed either a) in
a free testing location that everyone can have them-
selves tested, b) at pharmacies or c) as part of the
self testing programme (only a and b are considered
valid rapid tests). On the other hand, RT-PCR tests
are more expensive and their use is resource-limited.
As a result, there is significant variation in the number
of rapid tests, while RT-PCR tests have a more or less
steady count.
As a predictive variable, RT-PCR tests have the
following advantages:
• relatively constant number of tests throughout the
time series
• selective nature
• better sensitivity and specificity than the corre-
sponding rapid tests.
According to (Brihn et al., 2021) among 1732
paired samples from asymptomatic patients, the (anti-
gen based) rapid test sensitivity was 60.5%, and
specificity was 99.5% when compared with RT-PCR.
Among 307 symptomatic cases, sensitivity and speci-
ficity were 72.1% and 98.7%, respectively. Others
(Kortela and et. al, 2021), (Mistry et al., 2021) in
a metastudy also report that rapid tests exhibit great
COVID-ex 2022 - Special Session on "COVID-19 epidemic data mining and EXploration"
780

variation in sensitivity (between 37.7% and 99.2%)
and specificity (92.4% and 100.0%).
Because of the above reasons, only RT-PCR tests
are considered in the following analysis.
2.3 Normalised Positive Rate
The daily positive rate (PR) is defined as the ratio of
confirmed cases to the number of tests:
PR =
confirmed
tests
There are many ways this can be expressed, e.g.
as a percentage, or as a value of confirmed cases per
a specific number of tests. In this work the Positive
Rate (and all other similar quantities) are expressed
as confirmed cases per 1000 tests.
A similar quantity (Smoothed positive rate - SPR)
can be calculated using the smoothed confirmed and
the smoothed number of tests:
SPR =
smoothed confirmed
smoothed tests
The normalised positive rate (NPR) for a specific
day can be defined as:
NPR =
PR
SPR
=
confirmed
tests
smoothed confirmed
smoothed tests
NPR =
confirmed
smoothed confirmed
·
smoothed tests
tests
The NPR indicates the relationship between the
actual value of the positive rate compared to the
smoothed positive rate. Values greater than one indi-
cate that the positive rate calculated only by the daily
data is overestimating the positive rate, and vice versa.
Regarding the units of NPR, because it’s a ratio of
similar quantities, it is a unitless quantity.
2.4 Tests for Comparing Distributions
The 2 sample Kolmogorov-Smirnov test is used to
test whether the distribution of a quantity on different
weekdays exhibits the same empirical cumulative dis-
tribution (Hodges, 1958). The considered quantities
are the confirmed cases, no. of tests and the positive
rate.
To perform the test, every data point (e.g. con-
firmed cases)—which is associated to a date—is nor-
malised with respect to the average of the relative
week. Then all the dates that correspond to a cer-
tain weekday are grouped together, (there are approx-
imately 60 weeks in the dataset, so there are about
60 data points in each group). Finally, the 2 sam-
ple Kolmogorov-Smirnov test is performed on a pair
of weekday groups. The results are presented in a
heatmap. Due to multiple comparisons between data
the Bonferroni correction is used(Dunn and Dunn,
1961), (G. Miller, 2012). The results are tested
against a Bonferroni-adjusted alpha level of 0.000476
(0.01/21).
2.5 Model Fitting
A very basic model is fitted using a reciprocal func-
tion (
a
0
x
+ a
1
). The reason this model is selected is be-
cause of its simplicity, and also because it represents
the basic relationship between the two quantities (i.e.
the more tests are carried out the more the process
resembles a SRS scheme, while for lower tests num-
bers it is expected that the process will be less random
therefore there will be a higher positive rate).
Confidence intervals are computed and plotted
based on the covariance matrix and an α value of 0.01.
The model parameters are reported on the graph.
3 RESULTS AND DISCUSSION
3.1 Testing of Weekday Distributions
for Confirmed Cases and Tests
Figure 9 presents the results from a 2 sample
Kolmogorov-Smirnov test (Hodges, 1958) which was
used to determine the proximity of the empirical dis-
tributions per weekday for the confirmed cases and
tests.
Figure 9: Kolmogorov Smirnov 2 sample tests p-value
heatmap for the confirmed cases (left) and tests (right) per
weekday. (Smaller values support stronger statistically sig-
nificant rejection of the hypothesis that the distributions
come from the same distribution).
When tested against a Bonferroni adjusted alpha
level 0.000476 (0.01/21), it can be seen that there is
strong statistical evidence that for the confirmed cases
the distribution of Sunday is significantly different to
all other days—with the exception of Monday. Sim-
ilarly, Monday’s distribution is significantly different
to Tuesday and Wednesday.
A Data Driven Investigation on the Relationship between Tests, Confirmed Cases and Positive Rate: The Case of Greece
781

Similarly, regarding the tests, it appears that Sun-
day’s and Monday’s distributions differ significantly
from all the other weekdays (p-value is smaller than
5e-7 in all cases).
3.2 Smoothing
Figure 10 shows the results of the smoothing on the
daily confirmed cases and the daily tests.
Figure 10: Smoothing results for new cases and RT-PCR
tests.
3.3 Positive Rate and Smoothed Positive
rate
Figure 11 presents the daily (raw) positive rate (PR)
and the smoothed positive rate (SPR). The extreme
values can be seen and they generally correspond to
days following weekends (i.e. Monday and Sunday).
Figure 11: Comparison between Actual and Smoothed Pos-
itive rate.
Figure 12 presents the distribution of the positive
rate grouped by day and the results from a 2 sample
Kolmogorov-Smirnov test (Hodges, 1958) which was
used determine the similarity of the positive rate’s em-
pirical distributions per weekday. It is obvious that the
days following the weekend days (Sunday and Mon-
day) exhibit high variations of the positive rate com-
pared to the average of the week.
Figure 12 shows that there is strong statistical ev-
idence that for the positive rate the distribution of
Monday is different to all other days.
Figure 12: Dispersion of positive rate per weekday (left),
Kolmogorov Smirnov 2 sample tests p-value heatmap for
the positive rate per weekday (right).
It is noteworthy that the higher numbers for pos-
itive rate which are observed on the last data points
of the time-series in figure 11, are probably due to
the significantly higher number of rapid tests. Fig-
ure 13 compares the smoothed positive rate expressed
in cases per 1000 tests using only the RT-PCR tests
and the total number of tests. It can be seen, that al-
though at the beginning the curves are identical, as
time progresses the trends become completely differ-
ent. This can be attributed to the changing number of
rapid tests as evidenced in Figure 8, which since July
2021 are performed in greater numbers (close or over
one order of magnitude).
Figure 13: Positive Rate and Smoothed Positive Rate time
series (expressed in confirmed cases per 1000 tests) using
the total number of tests.
3.4 NPR Model Fitting
Figure 14 presents data and the fitted model for the
normalised positive rate with respect to the number
of RT-PCR tests. Compared to the total tests, the
RT-PCR tests plot shows less variability above 10000
tests. So it can be seen that the daily value of the posi-
tive rate tended to be greater when the number of tests
was smaller in number.
Figure 15 presents the fitted model for the Nor-
malised Positive Rate vs. the normalised no of Tests
(Normalised no of tests is defined as the number of
tests with respect to the smoothed number of tests).
COVID-ex 2022 - Special Session on "COVID-19 epidemic data mining and EXploration"
782

Figure 14: Normalised positive rate vs. the RT-PCR tests.
Figure 15: Normalised positive rate vs. the normalised RT-
PCR tests (normalisation is with respect to the smoothed
quantity).
3.5 Model Comparison with Austria
A similar procedure was undertaken for Austria. The
data were obtained from the official Austrian govern-
ment site. During clean-up the only difference was
that negative values were removed for testing, and
also the data on 27th of June 2021 was considered
an outlier and was removed.
Figure 16 presents the fitted reciprocal model for
the normalised positive rate vs the RT-PCR tests for
Greece and Austria.
It can be seen that although the shape is similar,
the number of tests is significantly higher and there-
fore there can not be a direct comparison. Presum-
ably this can also be tracked to the positive rate, in
Figure 16: Comparison between the fitted reciprocal models
for NPR vs. the total number of RT-PCR tests for Greece
and Austria.
the sense that since Austria has a significantly higher
daily number of RT-PCR tests compared to Greece
(Austria: 78722 compared to Greece: 14155), the
positive rate is expected to be lower for Austria.
Figure 17 presents the fitted reciprocal model for
the normalised positive rate vs the test ratio for Greece
and Austria. The overlapping of the models can be
seen, and it seems that the bulk of the data coincides.
In this case comparisons can me made more readily.
Figure 17: Comparison between the fitted reciprocal models
for NPR vs the test ratio for Greece and Austria.
4 CONCLUSIONS
The relationship between the number of tests and the
confirmed cases for the case of Greece has been inves-
tigated. The variability of the test cases between dif-
ferent weekdays seemed to correlate with the variabil-
ity per weekday of confirmed cases and (ultimately)
the positive rate.
The only consistent exception was the behaviour
on Sundays. A statistically significant difference was
identified in the number of RT-PCR tests that were
performed on Sunday. Similarly, the number of con-
firmed cases was significantly reduced on Sunday.
Additionally, the distribution on the results of the pos-
itive rate on Sunday appear to be statistically different
from the other days. Those results led to the conclu-
sion that the number of confirmed cases and tests did
not change proportionally on Sunday (while it appear
to do so on average on the other days).
Additional ways were considered to try and de-
termine the relationship between tests and confirmed
cases. It was shown that, generally for lower num-
ber of tests the positive rate is expected to be higher
that the week’s average. For higher test numbers the
positive rate appeared to be close to the week’s aver-
age. However, the variation was too great to provide
a useful predictive tool.
A comparison with Austria indicated that even
countries with the same level of population can have
a significantly different behaviour.
A Data Driven Investigation on the Relationship between Tests, Confirmed Cases and Positive Rate: The Case of Greece
783

REFERENCES
Allan, D. W. (1966). Statistics of atomic frequency stan-
dards. Proc. IEEE, 54(2):221–230.
Box, G. E. P., Jenkins, G. M., Reinsel, G. C., and Ljung,
G. M. (2015). Time Series Analysis: Forecasting and
Control, 5th Edition. Wiley, Hoboken, NJ, USA.
Brihn, A., Chang, J., OYong, K., Balter, S., Terashita, D.,
Rubin, Z., and Yeganeh, N. (2021). Diagnostic perfor-
mance of an antigen test with rt-pcr for the detection
of sars-cov-2 in a hospital setting - los angeles county,
california, june-august 2020. MMWR Morb Mortal
Wkly Rep., 70(19):702–706.
Dunn, J. and Dunn, O. J. (1961). Multiple compar-
isons among means. American Statistical Association,
pages 52–64.
G. Miller, Jr., R. (2012). Simultaneous Statistical Inference.
Springer, New York, NY, USA.
Hodges, J. L. (1958). The significance probability of the
smirnov two-sample test. afm, 3(5):469–486.
Kortela, E. and et. al (2021). Real-life clinical sensitivity of
SARS-CoV-2 RT-PCR test in symptomatic patients.
PLoS One, 16(5):e0251661.
Lu, S., Liang, C., Song, W., and Zhang, H. (2013).
Frequency-size distribution and time-scaling property
of high-casualty fires in china: Analysis and compari-
son. Saf. Sci., 51(1):209–216.
Malkin, Z. (2012). Using modified allan variance for time
series analysis. In Reference Frames for Applications
in Geosciences, pages 271–276. Springer, Berlin, Ger-
many.
Mistry, D. A., Wang, J. Y., Moeser, M.-E., Starkey, T., and
Lee, L. Y. W. (2021). A systematic review of the sen-
sitivity and specificity of lateral flow devices in the
detection of SARS-CoV-2. BMC Infect. Dis., 21(1):1–
14.
Papoulis, A. and Pillai, S. U. (2002). Probability, Random
Variables and Stochastic Processes. McGraw-Hill Eu-
rope.
Park, K. I. (2018). Fundamentals of Probability and
Stochastic Processes with Applications to Communi-
cations. Springer, Cham, Switzerland.
Percival, D. B. (1993). Three curious properties of the sam-
ple variance and autocovariance for stationary pro-
cesses with unknown mean. American Statistician,
47(4):274–276.
Percival, D. B. and Mondal, D. (2012). A wavelet variance
primer. In Handbook of Statistics, volume 30, pages
623–657. Elsevier, Walthm, MA, USA.
Scharf, R., Meesmann, M., Boese, J., Chialvo, D. R.,
and Kniffki, K.-D. (1995). General relation between
variance-time curve and power spectral density for
point processes exhibiting 1/ f
β
fluctuations, with spe-
cial reference to heart rate variability. Biol. Cybern.,
73(3):255–263.
COVID-ex 2022 - Special Session on "COVID-19 epidemic data mining and EXploration"
784
