
Research of the Method for Assessing Facial Phenotypic Features
from 2D Images in Medical Genetics
V. S. Kumov
1
, A. V. Samorodov
1
, I. V. Kanivets
2
, K. V. Gorgisheli
2
and V. G. Solonichenko
3
1
Department of Biomedical Engineering, Bauman Moscow State Technical University, 105005, Moscow, Russia
2
Genomed ltd, 115093, Moscow, Russia
3
Filatov Moscow Pediatric Clinical Hospital, 123001, Moscow, Russia
Keywords: Hereditary Diseases, Face Image, Facial Landmarks, Phenotypic Features.
Abstract: The paper proposes and investigates the phenotypic facial features recognition method based on facial
points coordinates on a reconstructed 3D facial image. The accuracy of the determination of phenotypic
features was investigated. The method recognizes phenotypic features with an accuracy of 84 % to 100 %.
The method has been tested on open and own databases of facial images of patients with hereditary diseases.
A criterion for the forming a risk group for Williams syndrome was proposed based on the summation of
the absolute values of z-scores of phenotypic features. On own database, the criterion provides an AUC
value of 0.922 for the separation of the Williams syndrome and the norm.
1 INTRODUCTION
According to the World Health Organization, almost
8 % of the population suffers from hereditary
diseases; more than 7000 such diseases are known
(Hart and Hart, 2009). Genetic pathology accounts
for a significant portion of childhood morbidity,
mortality, and disability.
Despite the growing importance of molecular
genetic methods and an increase in their efficiency
in diagnosing of hereditary diseases, the analysis of
phenotypic manifestations remains extremely
important since it allows one to determine a clinical
hypothesis and correctly interpret the results of
laboratory studies. The description of the face and
head is critical since 30 % to 40 % of genetic
diseases are associated with changes in the
anatomical structure of the craniofacial region (Hart
and Hart, 2009).
Unlike congenital malformations, congenital
morphogenetic variants (minor physical anomalies)
do not disrupt organ functions, and their
differentiation from normal variants is often
problematic. Nevertheless, in the scientific and
medical literature, it has been shown that both the
number of revealed phenotypic traits corresponding
to congenital morphogenetic variants and their
certain combinations have diagnostic significance
(Antonov et al., 2011; Meleshkina et al., 2015).
Therefore, recognizing facial phenotypic features
is essential, particularly for forming of a diagnostic
criterion for the presence of a hereditary disease.
There are works on the recognition of several
syndromes based on facial 2D images (for example,
Gurovich et al., 2019), but in the space of features
that do not coincide with the phenotypic features
used in anthropometry. This circumstance
complicates the interpretation of the results obtained.
In (Kumov et al., 2019), a method was developed
for assessing phenotypic features from a 2D image
using a standard set of 68 points. Statistically
significant differences are shown in these features
between the Noonan and Williams syndromes.
Further improvement of methods for assessing
phenotypic features of the face and head based on
automated measurements is required. This will
reduce the subjectivity of recognizing facial
phenotypic features in clinical practice. The
development of a method for analyzing facial
images of patients with hereditary diseases based on
recognizing phenotypic features will make the
results more interpretable.
Kumov, V., Samorodov, A., Kanivets, I., Gorgisheli, K. and Solonichenko, V.
Research of the Method for Assessing Facial Phenotypic Features from 2D Images in Medical Genetics.
DOI: 10.5220/0010974700003123
In Proceedings of the 15th International Joint Conference on Biomedical Engineering Systems and Technologies (BIOSTEC 2022) - Volume 1: BIODEVICES, pages 299-305
ISBN: 978-989-758-552-4; ISSN: 2184-4305
Copyright
c
2022 by SCITEPRESS – Science and Technology Publications, Lda. All rights reserved
299
2 RESEARCH
A review of the phenotypic facial features is carried
out, followed by a study of the accuracy of
recognition of phenotypic facial features using
simulation.
2.1 Method for Assessing Facial
Phenotypic Features
One of the complete standardized descriptions of the
phenotypes of genetic diseases was developed as
part of the Human Phenotype Ontology (HPO)
project (Robinson et al., 2008). Currently, the HPO
dictionary is widely used in projects aimed at
describing the phenotypes of patients and
understanding the molecular mechanisms underlying
their diseases, as well as for indexing and annotating
information in databases on human genetics (Online
Mendelian Inheritance in Man, Orphanet, GWAS
Central, ClinVar) and in various electronic health
records systems.
Several phenotypic traits presented in the HPO
dictionary are defined in terms of distances between
given anthropometric points. Automation of the
assessment of such features implies both the
automatic localization of the corresponding
anthropometric points and the determination of the
distance between them, taking into account the scale
of the image and the comparison of the obtained
value with the norm, which significantly depends on
race, age and gender. Localization of the facial
points in the image, based on the use of special
software tools, is widely used in medical problems,
in particular, for the diagnosis of Parkinson's disease
(Moshkova et al., 2020, 2021).
Complete statistical data on anthropometric
distances characterizing the structure of the
craniofacial region were collected as part of the
FaceBase project (Hochheiser et al., 2011). The data
contains information on the average values of the
norm and standard deviations for 34 distances for
people of the European population, taking into
account gender and age (from 3 to 40 years). The
distances were determined in accordance with the
system of anthropometric measurements proposed
by L. Farkas (Farkas, 1994).
In this work, from a variety of phenotypic traits,
a set was selected that includes 32 linear distances
from Facebase, which can be estimated from the
results of 3D face reconstruction (Deng et al., 2019).
This set includes 13 distances used in the HPO
dictionary.
Distances between points calculated from the
face image should consider the image scale. For this,
we used the normalization to the average of all 32
distances. After normalization, each distance is
compared to the normal range for the corresponding
group to calculate a z-score.
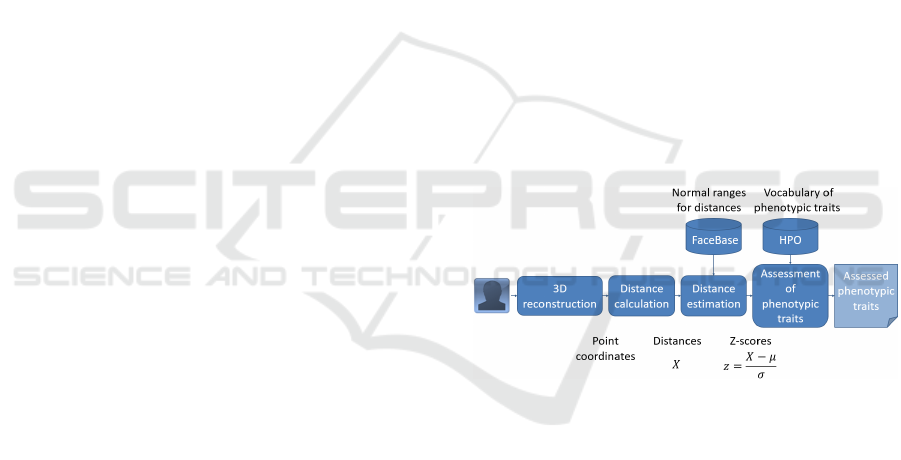
Based on the calculated features, a description of
the face is obtained in terms of the standardized
vocabulary of phenotypic anomalies of the HPO
project. For each characteristic, three ranges of
values are obtained. If the absolute value of the z-
score does not exceed 2, then the corresponding
phenotypic trait is assigned the value "normal". If
the z-score goes beyond the normal range from
below, then the value "reduced" is assigned, for
example, depending on the attribute, "Narrow",
"Thin", "Short", "Hypotelorism". Finally, if the z-
score is outside the upper limit of the norm, then a
value of "increased" ("Thick", "Long", "Broad",
"Wide" or "Hypertelorism") is assigned. These
estimates are constructed both for 13 features used
in the HPO dictionary and, by analogy, for all other
features.
The diagram of the developed method for
assessing facial phenotypic features from a 2D
image is shown in Figure 1.
Figure 1: Diagram of the method for assessing facial
phenotypic features from an image.
2.2 Recognition Accuracy of Facial
Phenotypic Features
The recognition accuracy of facial phenotypic
features was assessed using the following
computational experiment.
For images of healthy subjects of different
gender and age (from 6 to 16 years) from the
database (Dalrymple et al., 2013), a 3D
reconstruction was performed, the result of which
was taken as a reference 3D image of the face,
which was used to determine the actual values of
phenotypic traits. The stages of face image
preprocessing, 3D face reconstruction, and point
determination are similar to those in (Kumov and
Samorodov, 2020). For face detection, the classical
RMHM 2022 - Special Session on Remote Management and Health Monitoring
300
Viola-Jones method was used, but it is also possible
to use more advanced solutions based, in particular,
on neural network models (Aung et al., 2021).
In total, 80 reference 3D images were created,
according to the number of images of different
individuals in the database.
According to the phenotypic traits of these
reference 3D images, the mean values and standard
deviations (regardless of gender and age) were
calculated and used to obtain z-scores. Another
approach used the parameters of statistical
distributions of distances between points for healthy
people, taken from the FaceBase project, taking into
account gender and age.
Each reference 3D image was projected onto the
frontal plane with the formation of 2D images of
faces, to which were applied the methods of
automatic localization of points (without manual
correction), 3D reconstruction, and assessment of
phenotypic traits using the reconstructed coordinates
of points with the estimation of z-scores and
classification of the phenotypic trait on three classes
(3 ranges of values). If the resulting feature class
differed from the actual class in the reference 3D
image, the feature recognition was considered as an
error.
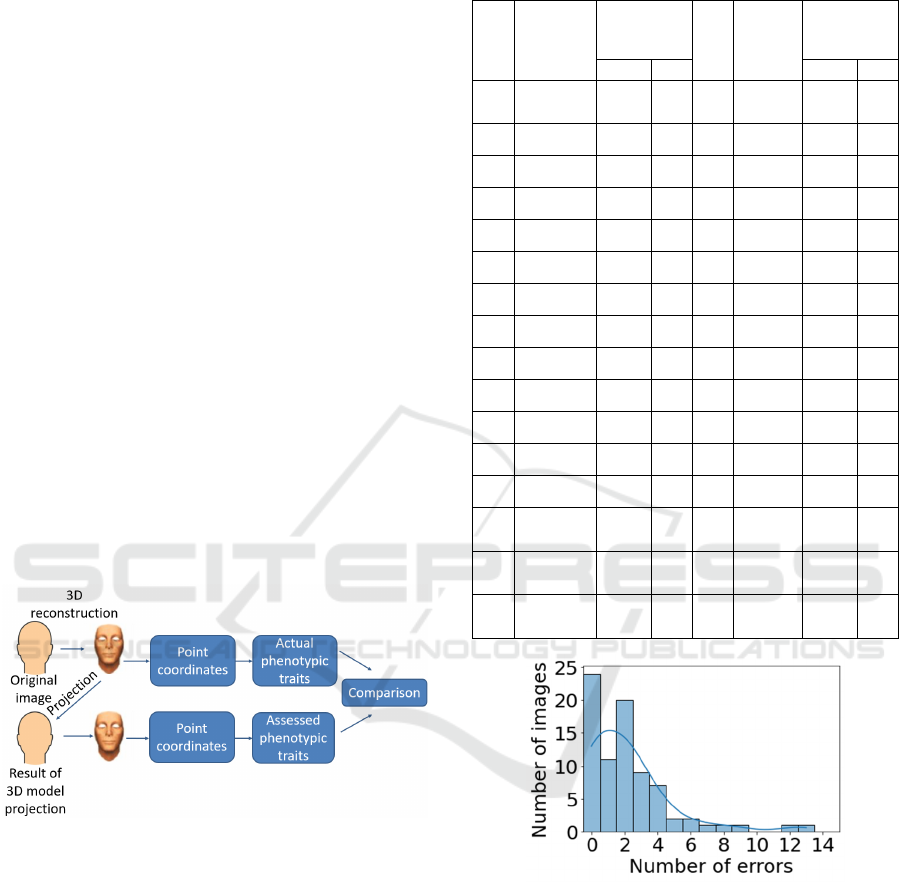
The modeling diagram is shown in Figure 2.
Figure 2: Modeling diagram.
The results of the computational experiment are
shown in Table 1.
The minimum accuracy in assessing features
without regard to age and gender is 88 %, the
maximum accuracy is 99 %. Not less than 27
features were recognized with an accuracy of 90 %,
12 features with 95 %, and 2 features with 97 %.
The histogram of the number of feature
recognition errors for 80 projections compared to the
reference 3D images without considering age and
gender is shown in Figure 3. For nine images
(11.2 % of the total number of images), the number
of errors is five or more.
Table 1: Recognition accuracy of facial phenotypic
features.
№ Feature
Accuracy with /
without regard to
gender and age,
%
№ Feature
Accuracy with /
without regard to
gender and age,
%
without with without with
1
Minimum Frontal
Width
95 100 17
Palpebral
Fissure Length
Left
95 85
2
Maximum Facial
Width
95 100 18 Nasal Width 95 100
3 Mandibular Width 94 84 19
Subnasal
Width
91 89
4
Cranial Base
Width
94 100 20
Nasal
Protrusion
89 92
5
Upper Facial
Depth Right
89 96 21
Nasal Ala
Length Right
90 98
6
Upper Facial
Depth Left
91 99 22
Nasal Ala
Length Left
89 100
7
Middle Facial
Depth Right
90 100 23 Nasal Height 98 100
8
Middle Facial
Depth Left
94 100 24
Nasal Bridge
Length
89 98
9
Lower Facial
Depth Right
95 99 25
Labial Fissure
Width
94 99
10
Lower Facial
Depth Left
94 99 26 Philtrum Width 95 100
11
Morphological
Facial Height
88 100 27
Philtrum
Length
96 100
12
Upper Facial
Height
92 99 28
Upper Lip
Height
92 100
13
Lower Facial
Height
94 99 29
Lower Lip
Height
92 99
14 Intercanthal Width 95 90 30
Upper
Vermilion
Height
95 100
15
Outercanthal
Width
99 100 31
Lower
Vermilion
Height
95 99
16
Palpebral Fissure
Length Right
94 85 32
Cutaneous
Lower Lip
Height
92 100
Figure 3: Histogram of the number of feature recognition
errors for 80 images without regard to age and gender.
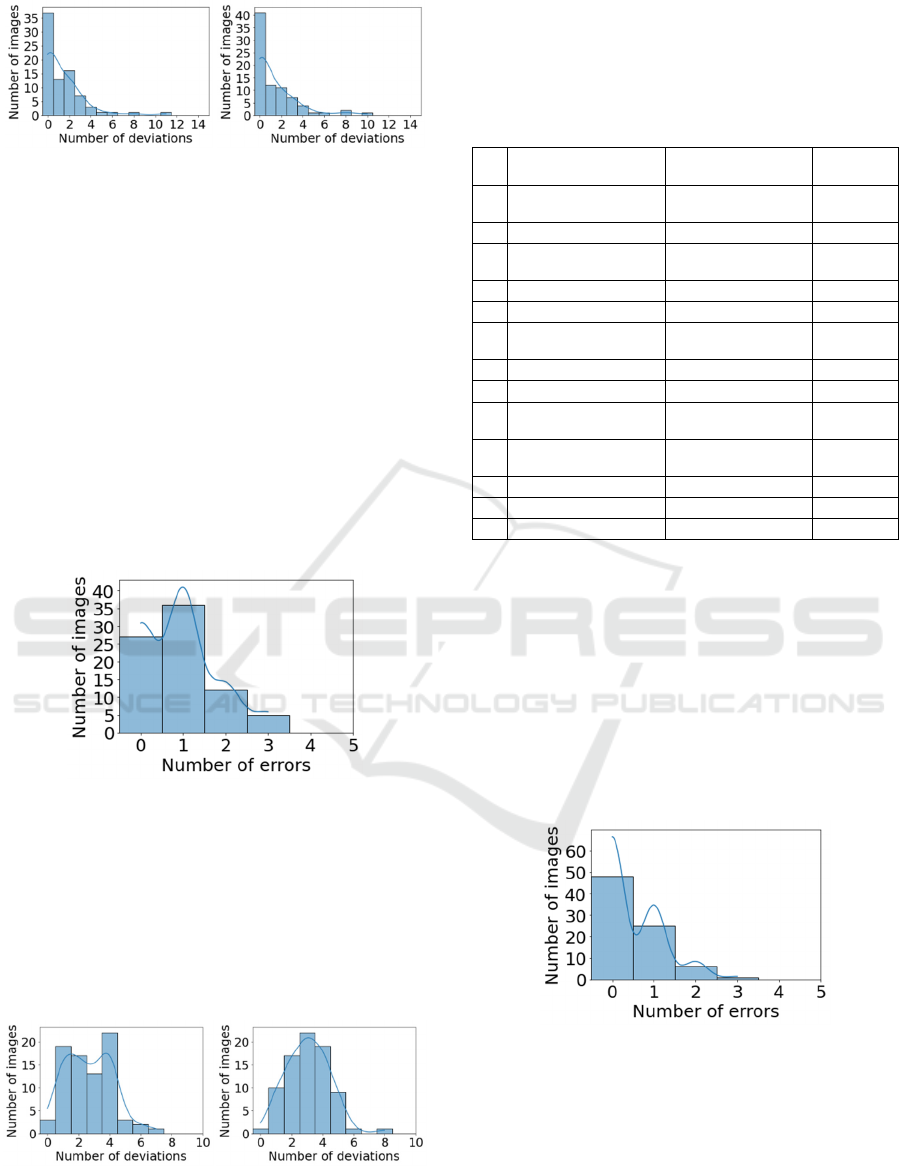
Histograms of the number of feature deviations for
reference 3D images and projections without regard
to age and gender are shown in Figure 4. For
approximately half of the considered images (37 out
of 80 – in references, 41 out of 80 – in projections)
the number of feature deviations from the norm is
zero. The number of deviations of features in
references does not exceed four for 95 % of images
(93.7 % – in projections).
Research of the Method for Assessing Facial Phenotypic Features from 2D Images in Medical Genetics
301
a
)
b)
Figure 4: Histograms of the number of feature deviations
for 80 images (a – in references, b – in projections,
assessment of 32 features without regard to age and
gender).
The minimum accuracy in assessing features
considering age and gender is 84 %, the maximum
accuracy is 100 %. Accounting for age and gender
improves recognition accuracy. The number of
features recognized with an accuracy not less than
90 % is 28, 95 % – 26, and 97 % – 25.
The histogram of the number of feature
recognition errors for 80 projections compared to the
reference 3D images, taking into account age and
gender, is shown in Figure 5. The maximum number
of errors is three (this number of errors is observed
in 5 images out of 80).
Figure 5: Histogram of the number of feature recognition
errors for 80 images considering age and gender.
Histograms of the number of feature deviations for
references and projections, taking into account age
and gender, are shown in Figure 6. For most of the
considered images, the number of deviations of
features from the norm does not exceed five (for
96.2 % of images – in references, for 97.5 % – in
projections).
a
)
b)
Figure 6: Histograms of the number of feature deviations for
80 images (a – in references, b – in projections, assessment
of 32 features, taking into account age and gender).
The accuracy of the assessment of 13 features of
HPO, taking into account age and gender, is shown
in Table 2.
Table 2: Recognition accuracy of 13 HPO features, taking
into account age and gender.
№ HPO features Values of HPO
features
Accuracy,
%
1 Face Broad, Normal,
Narrow
100
2 Face Long, Normal, Short 100
3 Distance between eyes Hypertelorism,
Normal, Hypotelorism
90
4 Palpebral Fissure Right Long, Normal, Short 85
5 Palpebral Fissure Left Long, Normal, Short 85
6 Nose Wide, Normal,
Narrow
100
7 Nose Normal, Prominent 92
8 Nose Long, Normal, Short 100
9 Mouth Wide, Normal,
Narrow
99
10 Philtrum Broad, Normal,
Narrow
100
11 Philtrum Long, Normal, Short 100
12 Upper Lip Vermilion Thick, Normal, Thin 100
13 Lower Lip Vermilion Thick, Normal, Thin 99
The minimum accuracy in assessing features
considering age and gender is 85 %, the maximum
accuracy is 100 %. The number of features
recognized with an accuracy not less than 90 % is
11, 95 % – 9, and 97 % – 9.
The histogram of the number of feature
recognition errors for projections compared to the
reference 3D images, taking into account age and
gender, is shown in Figure 7. The maximum number
of errors is three (this number of errors is observed
in 1 image out of 80).
Figure 7: Histogram of the number of feature recognition
errors for 80 images (estimation of 13 HPO features,
taking into account age and gender).
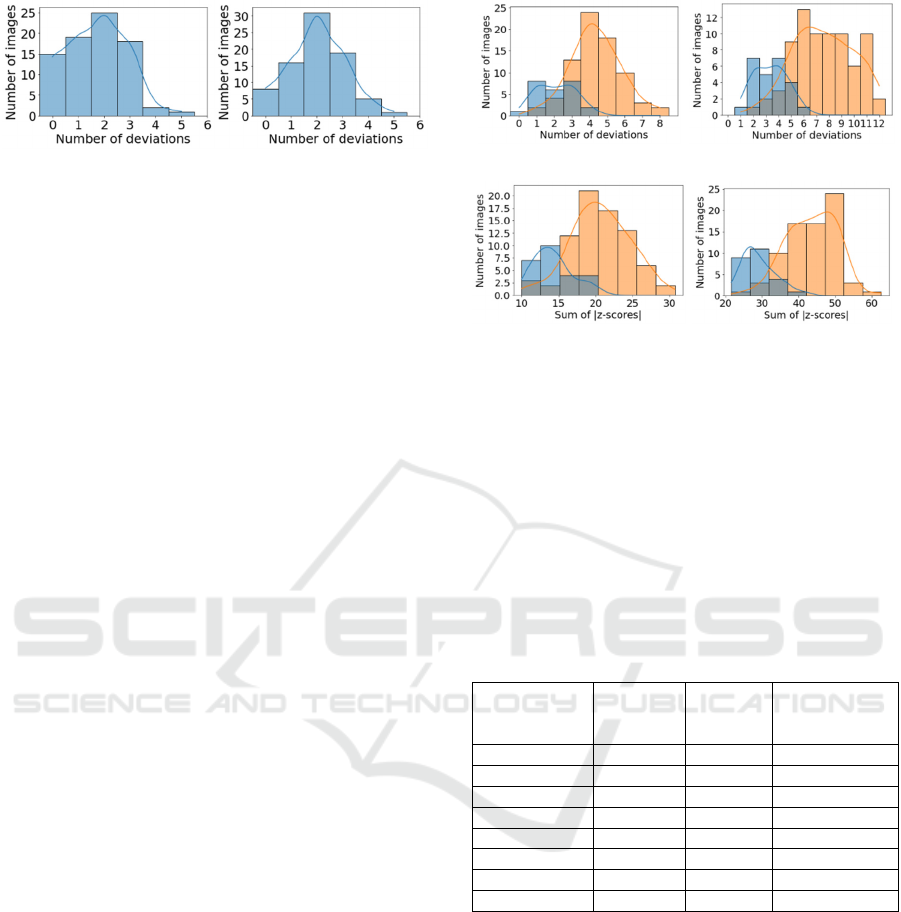
Histograms of the number of HPO feature deviations
for references and projections, taking into account
age and gender are shown in Figure 8. For most
images, the number of deviations of features from
the norm does not exceed three (for 96.2 % of
images – in references, for 92.5 % – in projections).
RMHM 2022 - Special Session on Remote Management and Health Monitoring
302
a
)
b)
Figure 8: Histograms of the number of feature deviations
for 80 images (a – in references, b – in projections,
assessment of 13 HPO features, taking into account age
and gender).
When gender and age are taken into account, the
number of features with recognition accuracy above
95 % and 97 % significantly increases.
Thus, high accuracy of phenotypic features
recognition and the possibility of automatic
formation of a phenotypic face portrait have been
demonstrated.
2.3 Study of the Distributions of
Deviations in the Group of the
Norm and Available Pathology
2.3.1 Open Database
The developed method for assessing phenotypic
features was tested on an open verified database of
patients with hereditary diseases (Ferry et al., 2014).
Unlike (Kumov, 2020), where a pre-trained neural
network model based on the VGG16 architecture
(which is widely used in other fields, in particular, in
the analysis of geographical information (Tun et al.,
2021) was applied in the method of recognizing
hereditary diseases, this study focuses on the use of
interpreted features.
Age and gender were assessed using
gender.toolpie.com, an online service that showed
the best accuracy of age estimates among the
libraries tested. Although the images from the
database (Dalrymple et al., 2013) have metadata, age
and gender recognition in the control group was also
carried out automatically for similar processing of
the two databases.
After automatic age and gender recognition,
those images are selected in which the estimated age
is from 6 to 16 years. Z-scores were calculated using
statistics from the Facebase project.
Figure 9 shows histograms of the number of
feature deviations for Williams syndrome and the
norm, where 13 (a, c) and 32 features (b, d) are
considered.
a)
AUC = 0.898
b)
AUC = 0.943
c)
AUC = 0.906
d)
AUC = 0.954
Figure 9: Separation of Williams syndrome and norm,
open database (a and b
–
the number of deviations for 13
and 32 features, c and d – the sum of the absolute values
of z-scores for 13 and 32 features). The norm is indicated
in blue; Williams syndrome is indicated in orange.
Similar studies were carried out on images of other
syndromes from an open database. Table 3 shows
the AUC values for different syndromes and norms.
For most syndromes, the best separation is obtained
by summing the absolute z-score values of 32
features.
Table 3: Results of the syndrome-norm division (32 only).
Syndrome
Number of
face images
Number of
features with
deviations,
AUC
Sum of
|z-scores|,
AUC
Angelman 83 0.973 0.976
Apert 48 0.920 0.934
Cornelia de Lange 38 0.831 0.829
Down 30 0.957 0.952
fragile X 54 0.893 0.925
Progeria 23 0.850 0.896
Treacher Collins 37 0.724 0.779
Williams 76 0.943 0.954
2.3.2 Own Database
The developed method for assessing phenotypic
traits was also tested on a verified database of
patients with hereditary diseases provided by Filatov
Moscow Pediatric Clinical Hospital.
Figure 10 shows histograms of the number of
feature deviations for Williams syndrome and the
norm, where 13 (a, c) and 32 features (b, d) are
considered. True age and gender data were used for
images of Williams syndrome and the norm (17
images – for Williams syndrome, 80 images – for
the norm). The age of the patients is from 6 to 16
years.
Research of the Method for Assessing Facial Phenotypic Features from 2D Images in Medical Genetics
303
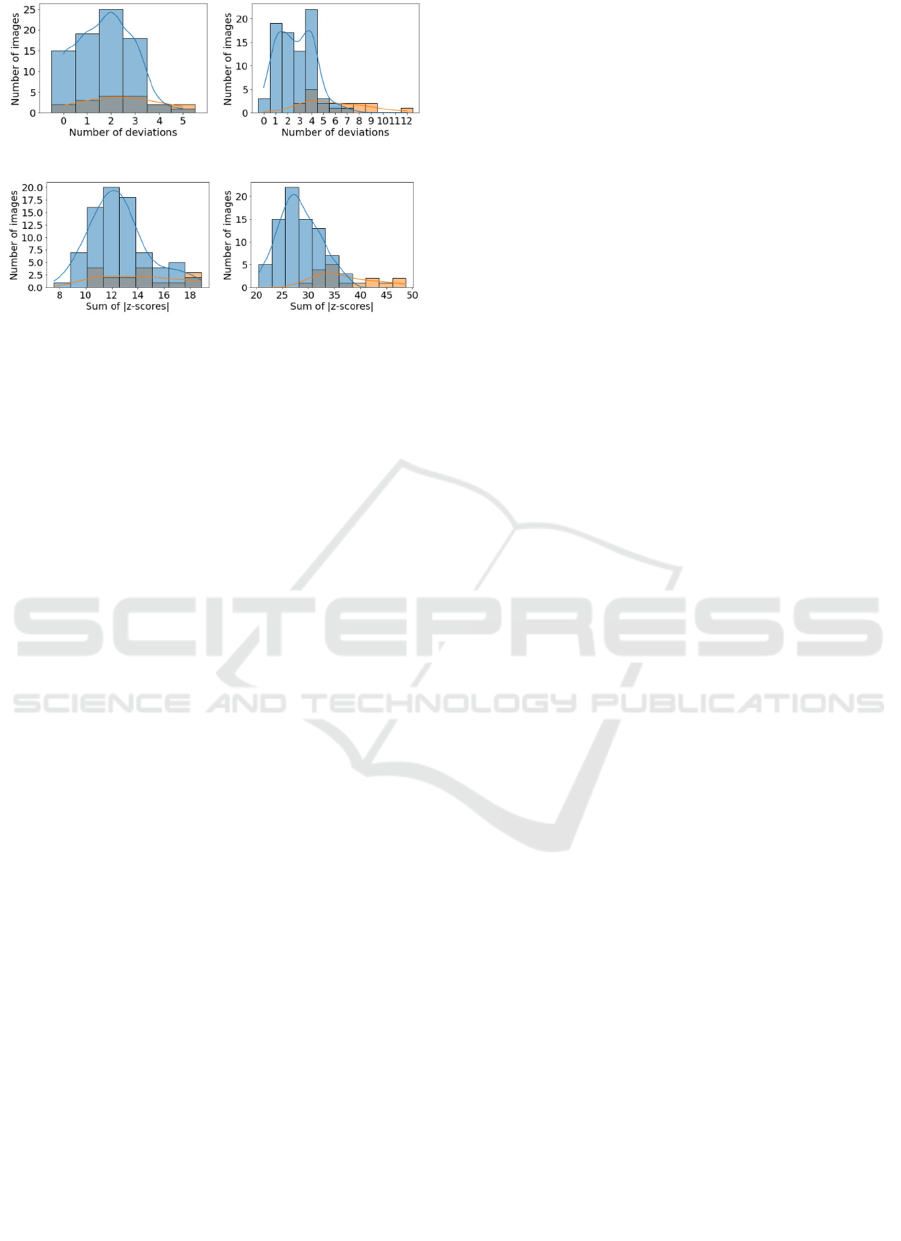
a)
AUC = 0.633
b)
AUC = 0.878
c)
AUC = 0.649
d)
AUC = 0.922
Figure 10: Separation of Williams syndrome and norm,
own database (a and b – the number of deviations for 13
and 32 features, c and d – the sum of the absolute values
of z-scores for 13 and 32 features). The norm is indicated
in blue; Williams syndrome is indicated in orange.
On our database of images of patients with
hereditary diseases, the best separation also
summates the absolute values of the z-score of 32
traits.
To form risk groups for hereditary syndromes, it
is advisable to summarize the absolute values of z-
scores of phenotypic traits. For Williams syndrome,
this approach provides an AUC value of 0.922 in the
studied sample, which is statistically significant (α =
0.01) higher than when using the traditional
approach to count the number of features with
identified deviations.
3 CONCLUSIONS
A method for recognizing facial phenotypic features
from a 2D image has been developed and
investigated. The method is based on the detection
of the facial points from a reconstructed 3D image
and provides recognition of phenotypic features with
an accuracy of 84 % to 100 %.
In addition, a criterion for forming a risk group
for Williams syndrome was proposed based on the
summation of the absolute values of z-scores of
phenotypic traits, and a statistically significant
increase in the AUC was shown in comparison with
the traditional approach to screening by phenotype.
The practical application of the developed
method for recognizing phenotypic features will
make it possible to significantly supplement the
information available in the scientific and medical
literature on the values of phenotypic features of the
facial area in norm and with the presence of
hereditary diseases. Furthermore, these results will
increase the reliability of such studies and create a
diagnostic decision support system for the physician
based on the interpretation of phenotypic traits. In
particular, it is possible to create a web service and
implement the method in the form of a telemedicine
system (Buldakova and Lantsberg, 2019; Buldakova,
2019).
REFERENCES
Hart, T. C., & Hart, P. S. (2009). Genetic studies of
craniofacial anomalies: clinical implications and
applications. Orthodontics & craniofacial
research, 12(3), 212-220.
Antonov, O.V., Filippov, G.P., Bogachyova, E.V. (2011).
K voprosu o terminologii i klassifikacii vrozhdennyh
porokov razvitiya i morfogeneticheskih variantov.
Byulleten' sibirskoj mediciny, 10(4), 179-182.
Meleshkina, A. V., Chebysheva, S. N., Burdaev, N. I.
(2015). Malye anomalii razvitiya u detej. Diagnostika i
vozmozhnosti profilaktiki. Consilium medicum, 17(6),
68-72.
Gurovich, Y., et al. (2019). Identifying facial phenotypes
of genetic disorders using deep learning. Nature
medicine, 25(1), 60-64.
Robinson, P. N., Köhler, S., Bauer, S., Seelow, D., Horn,
D., & Mundlos, S. (2008). The Human Phenotype
Ontology: a tool for annotating and analyzing human
hereditary disease. The American Journal of Human
Genetics, 83(5), 610-615.
Farkas, L. G. (Ed.). (1994). Anthropometry of the Head
and Face. Lippincott Williams & Wilkins.
Deng, Y., Yang, J., Xu, S., Chen, D., Jia, Y., & Tong, X.
(2019). Accurate 3d face reconstruction with weakly-
supervised learning: From single image to image set.
In Proceedings of the IEEE/CVF Conference on
Computer Vision and Pattern Recognition
Workshops (pp. 285-295).
Dalrymple, K. A., Gomez, J., & Duchaine, B. (2013). The
Dartmouth Database of Children’s Faces: Acquisition
and validation of a new face stimulus set. PloS
one, 8(11), e79131.
Ferry, Q., Steinberg, J., Webber, C., FitzPatrick, D. R.,
Ponting, C. P., Zisserman, A., & Nellåker, C. (2014).
Diagnostically relevant facial gestalt information from
ordinary photos. elife, 3, e02020.
Kumov, V. S., Samorodov, A. V., Kanivets, I. V.,
Gorgisheli, K. V., & Solonichenko, V. G. (2019,
August). The study of the informativeness of the
geometric facial parameters for the preliminary
diagnosis of hereditary diseases. In AIP Conference
Proceedings (Vol. 2140, No. 1, p. 020036). AIP
Publishing LLC.
Kumov, V., & Samorodov, A. (2020, April). Recognition
of genetic diseases based on combined feature
RMHM 2022 - Special Session on Remote Management and Health Monitoring
304

extraction from 2D face images. In 2020 26th
Conference of Open Innovations Association
(FRUCT) (pp. 1-7). IEEE.
Aung, H., Bobkov, A. V., & Tun, N. L. (2021, May). Face
Detection in Real Time Live Video Using Yolo
Algorithm Based on Vgg16 Convolutional Neural
Network. In 2021 International Conference on
Industrial Engineering, Applications and
Manufacturing (ICIEAM) (pp. 697-702). IEEE.
Tun, N. L., Gavrilov, A., Tun, N. M., & Aung, H. (2021,
January). Remote Sensing Data Classification Using A
Hybrid Pre-Trained VGG16 CNN-SVM Classifier.
In 2021 IEEE Conference of Russian Young
Researchers in Electrical and Electronic Engineering
(ElConRus) (pp. 2171-2175). IEEE.
Moshkova, A., Samorodov, A., Voinova, N., Volkov, A.,
Ivanova, E., & Fedotova, E. (2020, September). Facial
Emotional Expression Assessment in Parkinson’s
Disease by Automated Algorithm Based on Action
Units. In 2020 27th Conference of Open Innovations
Association (FRUCT) (pp. 172-178). IEEE.
Moshkova, A., Samorodov, A., Voinova, N., Volkov, A.,
Ivanova, E., & Fedotova, E. (2021, January). Studying
Facial Activity in Parkinson's Disease Patients Using
an Automated Method and Video Recording. In 2021
28th Conference of Open Innovations Association
(FRUCT) (pp. 301-308). IEEE.
Buldakova, T. I., Lantsberg, A. V., & Suyatinov, S. I.
(2019, November). Multi-Agent Architecture for
Medical Diagnostic Systems. In 2019 1st International
Conference on Control Systems, Mathematical
Modelling, Automation and Energy Efficiency
(SUMMA) (pp. 344-348). IEEE.
Buldakova, T. I., & Sokolova, A. V. (2019, November).
Network services for interaction of the telemedicine
system users. In 2019 1st International Conference on
Control Systems, Mathematical Modelling,
Automation and Energy Efficiency (SUMMA)
(pp. 387-391). IEEE.
Research of the Method for Assessing Facial Phenotypic Features from 2D Images in Medical Genetics
305
