
Predictive Behavioural Monitoring and Deviation Detection in Activities
of Daily Living of Older Adults
Jiawei Zheng
a
and Petros Papapanagiotou
b
School of Informatics, University of Edinburgh, 10 Crichton Street, Edinburgh, EH8 9AB, U.K.
Keywords:
Activities of Daily Living, Behaviour Monitoring, Deviation Detection, Predictive Modelling, Sensor Data.
Abstract:
Predictive behaviour monitoring of Activities of Daily Living (ADLs) can provide unique, personalised in-
sights about an older person’s physical and cognitive health and lead to unique opportunities to support self-
management, proactive intervention and promote independent living. In this paper, we analyse ADL data from
ambient sensors to model behaviour markers on a daily basis. Using a number of machine learning and statis-
tical methods we model a predicted daily routine for each marker, detect deviations based on a set of relative
thresholds and calculate long-term drifts. We further analyse the causal factors of deviations by investigating
relationships between different activities. We demonstrate our results using data from a sample of 11 partici-
pants from the CASAS dataset. Finally, we develop a dashboard to visualize our computed daily routines and
quantified deviations in an attempt to offer useful feedback to the monitored person and their caregivers.
1 INTRODUCTION
Loss of independence in Activities of Daily Living
(ADL) is associated with adverse health outcomes,
both physical and mental, and mortality in older
adults (Albanese et al., 2020; Cohen-Mansfield and
Perach, 2012). Adverse health events, including heart
failures, falls, strokes, etc. and the onset of cogni-
tive and physical frailty are not random occurrences,
but a consequence of long-term health deterioration
or unhealthy lifestyle. Gradual cognitive and phys-
ical decline can significantly affect the capacity of
people in advanced age to perform ADLs indepen-
dently (Akram et al., 2020). Proactive monitoring and
analysis of short and long term deviations from a reg-
ular routine in ADLs can provide vital insights on an
older person’s health and a continuous evaluation of
their physical and cognitive ability (Sepesy Mau
ˇ
cec
and Donaj, 2021). These can not only inform the de-
cision making of care givers towards timely, proactive
interventions, but also support person-centred self-
management and motivate healthier living.
Modern and emerging smart home and wearable
sensor technologies allow us to collect continuous
data on daily living in an unobtrusive and affordable
manner. This involves time series data with status in-
a
https://orcid.org/0000-0002-6515-6423
b
https://orcid.org/0000-0003-0928-6108
formation and timestamped event data when a status
change occurs (Cook et al., 2013a). Activity Recogni-
tion and Machine Learning (ML) techniques can then
produce fine-grained daily activity data with tempo-
ral and spatial information. Further AI modelling can
allow us to develop rich temporal and spatial profiles
of daily routines, including sleep duration, number of
meals, and levels of active movement. We can detect
temporal and spatial deviations on individual days or
in the long term, such as staying in the toilet too long,
too frequent toilet visits during the night, activity de-
lays due to reduced mobility, sleep disruption or de-
cline over time etc. Ultimately, our goal is to link
these detected deviations to health outcomes, towards
health monitoring and timely, proactive interventions.
More importantly, figuring out the causes of the de-
viations and the relationships between daily activities
can provide key insights towards preventative instruc-
tions and effective care provisions, both by care givers
and the people themselves, to avoid potential negative
effects and prevent adverse events.
Until recently, studies that investigate the relation-
ship between ADLs and health outcomes were based
on questionnaires and self-reporting (Kanti Majum-
dar, 2014; Cook and Schmitter-Edgecombe, 2021).
The result of this may be affected by experi-
menter observations or retrospective memory limita-
tions (Palmer, 2018). Instead, sensor-based, passive
and continuous monitoring of ADLs, associated with
Zheng, J. and Papapanagiotou, P.
Predictive Behavioural Monitoring and Deviation Detection in Activities of Daily Living of Older Adults.
DOI: 10.5220/0010974500003123
In Proceedings of the 15th International Joint Conference on Biomedical Engineering Systems and Technologies (BIOSTEC 2022) - Volume 5: HEALTHINF, pages 899-910
ISBN: 978-989-758-552-4; ISSN: 2184-4305
Copyright
c
2022 by SCITEPRESS – Science and Technology Publications, Lda. All rights reserved
899

behavioural analysis of patterns and routines, can pro-
vide concrete, objective insights about the relation-
ship between daily activities and health.
Our work is part of the Advanced Care Research
Centre, a large multi-disciplinary project focused on
the support of people in later life living in their own
homes and in supported care environments. (Univer-
sity of Edinburgh, 2021). The main contributions
of this paper are the following: Firstly, we extract
behaviour markers from activity-labelled time series
sensor data to model daily behaviours with rich tem-
poral information. Secondly, we propose a devia-
tion detection approach for daily behaviours, includ-
ing a deviation score for a given day and a long-term
drift from the normal routine. Thirdly, we investigate
the relationship between different activities towards
a causal explanation of deviations. Finally, we de-
velop an interactive dashboard, which can visualize
personal temporal profiles of daily behaviours includ-
ing daily routines, trends of each behaviour marker
and potential deviations. The dashboard provides in-
tuitive behavioural statistics of the monitored older
adults that may be useful both for self-monitoring
and management and as useful information to care
providers. We demonstrate the results of our approach
using ADL data from 11 participants over 2 months
from the CASAS project (Cook et al., 2013a).
2 RELATED WORK
Research in the field of ADLs has recently been re-
ceiving increasing attention, especially in the context
of supporting independent living for older people and
providing effective care. Aminikhanghahi et al. pro-
pose a change point detection algorithm for identify-
ing activity transition points, which is used to improve
the performance of activity recognition (Aminikhang-
hahi et al., 2019). In this paper, we focus on predic-
tive daily behaviour monitoring and deviation detec-
tion based on the activity-labelled time series data.
Yahaya et al. provide a comprehensive list of recent
efforts on deviation detection (Yahaya et al., 2019).
Classification methods treat deviation detection
as a binary classification problem. They require ADL
data labelled as normal or abnormal, where the lat-
ter reflects either a pre-specified pattern of behaviour,
such as the behavioural difficulties of people with de-
mentia (Arifoglu and Bouchachia, 2019). Due to the
scarcity of abnormal data in real datasets, it is com-
mon to train and generate synthetic data for the ab-
normal class. More recent approaches consider as
abnormal any deviation from a normal routine that
is learned from historical data (Yahaya et al., 2019;
Pazhoumand-Dar et al., 2020; Yahaya et al., 2021b).
Some classification approaches rely on detect-
ing whether the sensor information exceeds a fixed
threshold of values. Collected data is used as train-
ing data representing the normal behaviours and sub-
sequent activity data are used as testing data for the
learned model. Data that have significant variations
past certain thresholds are defined as outliers. For ex-
ample, Pierleoni et al. propose a fall detection method
based on the fusion data collected from a triaxial ac-
celerometer, gyroscope, and magnetometer on wear-
able devices (Pierleoni et al., 2015). If the body orien-
tation falls below a pre-defined threshold for a certain
period of time, the system will issue an alarm.
However, approaches that rely on wearable sen-
sors are not always applicable in practice. For in-
stance, some people may not feel comfortable con-
stantly wearing a device or may forget to put it on
or charge the battery. Moreover, missing data and
false positives can make these approaches less reli-
able (Pazhoumand-Dar et al., 2020). For example,
lying down on a bed suddenly may be mistaken for
the movement pattern of an accidental fall. Some
approaches have overcome these limitations by us-
ing ambient sensors in a smart home (Cook et al.,
2013a). The data are collected from environmental
sensors when the subjects have interactions with their
environment. For example, Pazhoumand-Dar et al.
use Kinect sensors composed with power consump-
tion data to monitor daily behaviours (Pazhoumand-
Dar et al., 2020). Their training data is aimed to
model the regularity and frequency of important ac-
tivities and does not need to be labelled in advance.
Howedi et al. use ADL data collected from ambient
sensors to detect deviations based on entropy mea-
sures (Howedi et al., 2020). Activities with entropy
values exceeding a certain range are detected as ab-
normalities. Similarly, Yahaya et al. propose an en-
semble of abnormal detection approach by detecting
if the test data differs significantly from the training
data based on a threshold for a defined Normality
Score (Yahaya et al., 2019).
Finally, clinical score-based approaches involve
an assessment of older people by clinical experts
through various factors of their daily activities, such
as cognitive health, functional mobility, etc (Dawadi
et al., 2016; Alberdi Aramendi et al., 2018; Cook and
Schmitter-Edgecombe, 2021). The assessments are
usually conducted at regular time intervals, for ex-
ample every 6 months, and a total score representing
the health status of the participant is calculated. Af-
ter data collection, a computation model is trained to
map the clinical score to the data collected by ambi-
ent sensors and predict future scores based on that.
Smart CommuniCare 2022 - Special Session on Smart Living Environments to Support Aging-in-Place in Vulnerable Older Adults
900

Figure 1: An overview of the proposed approach.
The assessments are carried out by self-reporting, us-
ing an appropriate questionnaire. However, the result
from this type of assessment may be affected by the
respondent’s subjective view and state of mind when
filling in the questionnaire (Yahaya et al., 2021a). As
a consequence, the score may not accurately reflect
the actual health condition of the respondent.
In our work, we also adopt a threshold-based clas-
sification approach using unlabelled data.
3 PROPOSED APPROACH
Our work is aimed towards proactive health monitor-
ing and predictive deterioration and deviation detec-
tion. Our proposed approach consists of four stages,
as shown in Figure 1: (1) data preprocessing, (2)
extraction of behaviour markers, (3) predictive mod-
elling, and (4) deviation detection, including investi-
gating causal factors of deviations. We describe each
stage in more detail next.
3.1 Data Description
In this paper, we analyse available ADL data collected
from ambient sensors in smart homes, published by
Cook et al. (Cook et al., 2013a). The data sets contain
continuous data from unobtrusive sensors including
motion sensors, door sensors, light switches and light
sensors, deployed in single-family residences.
Each sensor event is labelled with a corresponding
activity, including sleeping, cooking, eating, napping,
going to the toilet, and working, in a total of 33 differ-
ent activities. A sample of data is shown in Table 1a.
Our paper is based on data from 11 individuals
over 2 months. The raw sensor data is recorded in a
time-series format with the following fields:
• Timestamp: The date and time of the event.
• Sensor: The name of the sensor, as found in the
sensor floor plan.
• Room: The room-level sensor location.
• Location: The fine-grained location of the sensor,
such as bed, chair, etc.
• Message: The value generated by the sensor, such
as on, off, etc.
• Sensor Type: The type of sensor gener-
ating the event (e.g. Control4-Motion,
Control4-LightSensor, etc.), such that
provides context to the generated message.
• Activity: A manual label of the corresponding ac-
tivity of this event, such as sleeping, eating, etc.
Due to inherent uncertainty in the environment
and human behaviours, the dataset is noisy. We
specifically identified 4 categories of potential noise
below:
• Accuracy of Labelling: Since the particular
dataset we are examining was manually labelled
post-hoc, there is no measure of the accuracy
of the labelling. In fact, newer versions of the
dataset seem to have updated some of the labels.
More generally, even with an automated activity
recognition algorithm, such as the one by Cook et
al. (Cook et al., 2013b), there is still some level of
uncertainty that may affect the results.
• Lack of end Event: The observed activity events
indicate when an activity is detected. However,
there is no clear indication of the exact end time
of the activity or the transition time to the next
one. This causes some inaccuracy in our calcu-
lated activity intervals (see Section 3.2).
• Distinguishing Activities: In some cases, the
same small set of 1-2 sensors may be used to de-
tect multiple types of activities with similar action
Predictive Behavioural Monitoring and Deviation Detection in Activities of Daily Living of Older Adults
901

Table 1: Sample of ADL sensor data.
(a) Raw ADL sensor data labelled with activities.
Timestamp Sensor Room Location Message Sensor type Activity
1 2011-06-15 09:58:27 M007 Kitchen Kitchen ON Control4-Motion Cook Breakfast
2 2011-06-15 09:58:42 M007 Kitchen Kitchen OFF Control4-Motion Cook Breakfast
3 2011-06-15 09:58:45 D005 Kitchen Refrigerator Close Control4-Door Cook Breakfast
4 2011-06-15 09:58:46 M005 DiningRoom DiningRoom ON Control4-Motion Eat Breakfast
5 2011-06-15 09:58:47 M008 Kitchen Kitchen ON Control4-Motion Cook Breakfast
6 2011-06-15 09:59:05 LS001 Kitchen Kitchen 4 Control4-LightSensor Cook Breakfast
7 2011-06-15 09:59:06 LS007 Kitchen Kitchen 6 Control4-LightSensor Cook Breakfast
8 2011-06-15 09:59:10 M005 DiningRoom DiningRoom ON Control4-Motion Eat Breakfast
9 2011-06-15 10:00:29 LS005 DiningRoom DiningRoom 13 Control4-LightSensor Eat Breakfast
10 2011-06-15 10:00:46 LS015 DiningRoom DiningRoom 14 Control4-LightSensor Eat Breakfast
11 2011-06-15 10:00:47 M008 Kitchen Kitchen OFF Control4-Motion Cook breakfast
(b) ADL data resulting after pre-processing.
Activity Start time End time Duration Daycase Interval
Cook Breakfast 2011-06-15 09:58:27 2011-06-15 09:59:06 00:00:39 2011-06-15 00:00:04
Eat Breakfast 2011-06-15 09:59:10 2011-06-15 10:00:46 00:01:36 2011-06-15 00:00:01
patterns or taking place in the same location, such
as washing the dishes and preparing a meal. This
can lead to some misclassification.
• Sensor Modalities: Given the selection of sen-
sors, there are only a few modalities available,
mainly movement and lighting. This means that
certain activities, such as the exact time an indi-
vidual falls asleep, cannot be detected accurately.
Additional modalities, such as the ones offered by
wearable devices, can help provide a finer grained
activity detection. However, there will always be
some uncertainty in activity recognition due to the
granularity of the involved sensors.
Whilst we do not address this noise explicitly in
our modelling, it needs to be taken into considera-
tion when making potential decisions or interventions
based on our produced insights.
3.2 Data Preprocessing
The ADL dataset consists of raw sensor data, which
represents all sensor events that occur during a pe-
riod of time, along with their specific location, times-
tamps, sensor ID, message, etc, as shown in Table 1a.
The first processing step involves the removal of
noise, as described in the previous section, to the ex-
tent possible, as well as the removal of unknown ac-
tivities labelled as “other activity”.
We then focus on particular patterns of sequences
of events representing two different, interleaved ac-
tivities during the same period of time, as shown in
Table 1a. A person is cooking breakfast when a se-
quence of eating breakfast events occurs. Subsequent
events show that the person continues to cook break-
fast. This means that the person is cooking while eat-
ing and the two activities are interleaved during this
time.
In row 4 of Table 1a, the eat breakfast event is a
single orphan event, which prevents us from measur-
ing the (assumed to be short) duration of the corre-
sponding activity. We treat such events as false oc-
currences and remove them from the dataset.
In rows 8-10 of Table 1a, we observe a continuous
sequence of eat breakfast events. We consider such
cases as an interleaved activity and we treat them as
though the initial activity ended in row 7 and a new
cook breakfast activity started in row 11.
Based on the above, we detect consecutive events
of the same activity and choose the timestamp of the
first event as the start of the activity interval and the
timestamp of the last event as the end of the activity
interval. This results in a processed dataset (shown
in Table 1b) that includes the following temporal fea-
tures of each activity in order:
• Activity: the name of the ADL.
• Start Time: the start time of the activity.
• End time: the end time of the activity.
• Duration: the duration of the activity in seconds.
• Daycase: the date of the activity.
• Interval: the interval in seconds until the next ac-
tivity starts.
3.3 Modelling Behaviour Markers
Our aim is to process activities performed on a daily
basis in order to detect daily routines and deviations.
We model behaviour markers for each day.
Smart CommuniCare 2022 - Special Session on Smart Living Environments to Support Aging-in-Place in Vulnerable Older Adults
902

This daily segmentation requires us to split events
occurring at midnight into two events, each be-
longing to the previous and new day respectively.
For example, a Watch TV event from 22:10:00 to
01:12:23 is split into two events, one from 22:10:00 to
23:59:59 for the previous day and one from 00:00:00
to 01:12:23 belonging to the new day. The only ex-
ception is the sleep activity, which we count from
noon to noon of the next day, as we consider overnight
sleep to be a significant indicator of healthy living.
The modelled behaviour markers are extracted ac-
cording to the features related to each daily activ-
ity such that provide key insights of the individual’s
lifestyle and potential links to health indicators.
The total number of behaviour markers we ob-
served is 26, with some examples shown in Table 2.
We subsequently focus our efforts to detect deviations
on these particular behaviour markers.
Table 2: Examples of daily behaviour markers.
Behaviour markers Description
nap duration total nap duration
sleep time time of sleep
wake up time
morning wake up
time
last personal hygiene
time of the last
personal hygiene
last nap endtime
end time of the last
nap
if eat breakfast
whether eat breakfast
occurred or not
bed toilet times
times of toilet visits
during sleep
3.4 Detecting Deviations
The main goal of our approach is to detect and mea-
sure short and long term deviations of ADLs from a
routine, such that may indicate health deterioration. A
key input here is the ground truth compared to which
a certain behaviour is considered a deviation. Each
individual may have a significantly different routine
and lifestyle, particularly at a later age. This vari-
ance can be exacerbated by the consideration of the
large variety of different health conditions that may
apply to each person. For instance, the connections
between frailty and sleep disturbances have been well
studied (Piovezan et al., 2013). We therefore adopted
a personalised approach and observe daily living de-
viations from an individual routine, irrespective of its
relation to a healthy standard. This means we are de-
tecting and measuring when and individual is not be-
having according to their regular routine, even if that
routine is unhealthy.
More specifically, given a set of daily behaviour
markers for each individual, we create a computa-
tional model of their expected measures each day.
Taking nap duration as an example, we develop a
model that can predict the total duration of a person’s
naps during the day given their historical data. We
also account for seasonality by including the day of
the week (e.g. some people may nap more during the
weekend) and the month (e.g. people tend to sleep
longer during the winter, particularly if affected by
a seasonal affective disorder) as features (Anderson
et al., 1994). This model is then used as the ground
truth of expected values, against which any new ob-
served behaviour is compared.
The technical aspects of this approach are de-
scribed in more detail next.
3.4.1 Building the Predictive Model
Our aim is to build a predictive model of the nor-
mal daily behaviour markers of an individual. Such
a model needs to be trained with historical data of
routine daily living. We therefore begin by remov-
ing outliers in the data, consisting of values that de-
viate from the mean by 2 standard deviations, which
is a common cut-off for outliers in practice in a small
dataset (Ilyas and Chu, 2019).
We also consider special cases of daily behaviours
that we may want to filter out. For example, we use
specific patterns for detecting if the person is away
from home overnight and sleeps elsewhere. If the last
event of that day is leave home and sleep duration is
zero, we consider that day an outlier and remove it.
We use the remaining data to train a regression
model to predict the future value of behaviour mark-
ers. We only consider seasonality features in the
model, i.e. the full date, the day of the week, the
month, and the order of events.
Our next goal is to maximize the accuracy of the
model. For this, we compare the predictive accuracy
of different regression models in a model selection
process. In this process, we use one of the partici-
pants as the validation set for choosing best perform-
ing model and other participant as the testing set. The
best performing model on the validation set is eval-
uated on the testing set. Finally, the most accurate
model is chosen as the predictive model.
For the data of each behaviour marker of a indi-
vidual, we use K-fold time series split technique in
Scikit-learn (Pedregosa et al., 2011) to split 3-fold
training and testing sets. It returns 3 split of data.
In the kth split, it returns the first k folds as train-
ing set and the (k + 1)th fold as testing set. We train
and evaluate different ML models and statistical time
Predictive Behavioural Monitoring and Deviation Detection in Activities of Daily Living of Older Adults
903

series models based on the training and testing sets.
Note that we build separate model for each behaviour
marker of a individual. The evaluation result is ob-
tained by computing the average performance of 3
pairs of training/testing sets.
All experiments are evaluated using the mean ab-
solute error (MAE) and the root mean squared error
(RMSE) measures. MAE, shown in (1), and RMSE,
shown in (2) both measure the average magnitude of
the errors in a set of predictions, with 0 corresponding
to perfect accuracy, while RMSE magnifies the im-
pact of large errors. In these equations, for each pre-
dicted value i, ˆy
i
represents a size-n vector of the pre-
dicted values, y
i
is the vector of actual values, and n
is the number of test instances. All performance eval-
uations are conducted using 3-fold time series cross
validation (Bergmeir and Ben
´
ıtez, 2012).
MAE =
1
n
n
∑
i=1
| ˆy
i
− y
i
| (1)
RMSE =
s
1
n
n
∑
i=1
( ˆy
i
− y
i
)
2
(2)
3.4.2 Deviation Detection
After we build the predictive model, we can get the
predicted value of behaviour markers by fitting them
into the training set. To detect potential deviations
based on the predicted value, we calculate the dis-
tance between the predicted routine value and the ac-
tual value as shown in (3).
z =
|y
predict
− y
true
|
MAE
(3)
MAE is the mean absolute error of the predictive
model (see also Section 3.4.1). For example, if the
MAE of a model of sleep duration is 1800 seconds,
then the model predicts on average 30 minutes more
or less sleep than the actual value. A lower MAE in-
dicates a better performing algorithm with 0 corre-
sponding to perfect accuracy. When comparing mod-
els trained with datasets from 2 distinct individuals
with the same algorithm, a lower MAE score is an in-
dication of less variability in the data and, therefore,
a more predictable and steady daily routine.
The z value in (3) represents the distance of the
actual value from the predicted value as a fraction of
MAE. If the calculated z value of a predicted be-
haviour marker exceeds a chosen threshold, a devi-
ation is detected. The chosen threshold corresponds
to a time window proportional to MAE within which
we consider the behaviour as normal or routine. A
distinct threshold can be selected for each behaviour
marker in the daily routine, to account for the flexibil-
ity we want to allow for each activity. For instance, if
a participant decides to read a book at a considerably
different time than usual, we might not want to con-
sider this as a significant deviation. However, the time
they go to sleep is much more important as a health in-
dicator, and therefore we may want to flag smaller de-
viations. We could therefore choose a higher z thresh-
old for the former behaviour marker and a lower value
for the latter.
For example, given the sleep duration model with
MAE of 0.5 hours discussed above, assume a pre-
dicted sleep duration y
predict
of 8 hours for a partic-
ular day. Setting the threshold of z to 1 means that
an actual sleep y
t
rue of less than 7.5 or more than 8.5
hours will be considered a deviation.
Given that the MAE reflects the variability in an
individual’s routine, choosing the same z value across
all individuals allows us to account for that variability.
In the example above, an MAE of 1 hour would lead
us to only consider sleep of less than 7 hours or more
than 9 hours to be a deviation.
The deviations of an individual across all be-
haviour markers in a particular day can be quanti-
fied in terms of a deviation cost. In this, deviations
in each behaviour marker may have a different cost,
for instance in terms of its potential impact to the per-
son’s health. For example, a deviation from the ex-
pected sleep duration is likely considered more im-
pactful to health compared to a deviation in the time
one chooses to read a book.
For this purpose, we set a customized weight for
each behaviour marker to adjust the impact of specific
behaviours. For the detected deviations above, we
then calculate both the absolute total deviation cost
and the weighted deviation cost. The total deviation
cost is the sum of the cost of each deviation behaviour
marker. The weighted deviation cost is shown in (4),
where i represents each behaviour marker, z
i
is the
z value from (3) for each behaviour marker and w
i
is
the selected custom weight of the marker. The combi-
nation of total deviation cost and weighted deviation
cost provides a quantification of deviations for a sin-
gle person on an individual day. This has the potential
to be used as a behaviour performance score for care
givers when monitoring the daily living routine of an
older adult at a glance.
C =
n
∑
i
z
i
∗ w
i
(4)
3.4.3 Long-term Deterioration
In addition to short-term deviations over a single day,
we also analyse the long-term trend of behaviour
Smart CommuniCare 2022 - Special Session on Smart Living Environments to Support Aging-in-Place in Vulnerable Older Adults
904

markers. This type of analysis can help us detect
long-term changes such as reduced mobility (some
activities taking longer), reduced or disrupted sleep
patterns, etc. that may be linked to health outcomes,
such as deterioration, physical and cognitive frailty,
and reduced independence.
We calculate long-term trends of behavioural
markers based on the individual’s normal daily rou-
tine. In this context, we consider days with detected
deviations through the previous analysis as abnormal
and filter them out of the dataset.
3.5 Investigating Relationship between
Activities
The last step in our current work is aimed towards in-
sights on why the detected deviations occur, focusing
on individual behaviour markers. Taking sleep dura-
tion as an example, we can use the approach described
so far to classify the sleep duration of each day as ab-
normal (deviating) or normal based on the individ-
ual’s historical data. Taking this labelling as ground
truth, we train a new classifier to use the other be-
haviour markers as features for normal/abnormal clas-
sification. We then calculate the feature importance
of each marker using the feature selection technique
in Scikit-learn (Pedregosa et al., 2011). This tech-
nique can assign a score to each feature of the clas-
sifier based on their impact in predicting the target
label. The higher the score, the more important the
corresponding feature is. Features with high impor-
tance are then considered to have a higher correlation
with sleep duration.
4 EXPERIMENTAL RESULTS
In this section, we present the results we obtained in
each stage of our approach using the CASAS dataset.
We develop and evaluate our predictive model of daily
routines by comparing the performance of different
learning models. Additionally, we show the results of
detected deviations and relationships between sleep
duration and other daily behaviours. Finally, we de-
velop an interactive dashboard for visualizing per-
sonal temporal profiles of daily living.
4.1 Predictive Model
In our effort to develop a predictive model for individ-
ual ADL routines, we performed an array of experi-
ments to select the best performing algorithm.
First, we evaluated 19 well known ML regression
models, including Random Forest Regressor, Lin-
ear Regressor, Logistic Regressor, Extreme Gradient
Boosting, etc. As mentioned earlier, the features used
for regression only contain time-related characteris-
tics, i.e. month, day, weekday and chronological or-
der. Then the top 3 best performing among them are
integrated as an ensemble using Stacking and Blend-
ing techniques (Maclin and Opitz, 1999) to further
improve the performance. We also evaluate one statis-
tical time series approach named Prophet (Taylor and
Letham, 2017), which is specifically tailored to deal
with seasonal effects in time-series data, and compare
its performance to the ML models.
We randomly chose hh102 as an example to
present our results. The other participants show simi-
larly interesting results. The performance of different
models of sleep duration in terms of the two metrics
(MAE and RMSE) is shown in Table 3. The units of
these two metrics are both seconds.
Table 3: MAE and RMSE of different predictive models of
sleep duration for individual hh102.
Model MAE RMSE
Prophet 3683 4532
RandomForestRegressor 4200 5065
KNeighborsRegressor 4306 5394
ExtraTreesRegressor 4552 5436
StackingRegressor (top 3) 5943 6551
BlendingRegressor (top 3) 4214 5127
As the result shows, Prophet is the best model for
forecasting sleep duration. In fact, Prophet outper-
formed the ML algorithms in all behaviour markers
across our dataset, so we selected that algorithm for
all our predictive models. This came with added ben-
efits of Prophet, such as the calculation of long-term
trends (see Section 4.3).
The model performance on the behaviour mark-
ers of the individual hh102 is shown in Table 4. As
an example, the mean absolute error in the predic-
tion of the time when breakfast was cooked is 3745
seconds, so approximately one hour, which is a rea-
sonable level of variability for that activity. Similarly,
all of the obtained results show a reasonable level of
accuracy, given the high variability in people’s daily
lives.
4.2 Detected Deviations
We present the results of our deviation detection ap-
proach using hh102 as an example. In this, we set the
threshold of the z value of each behaviour marker to
1. We set the weight cost of sleep duration, bathe du-
ration and leave home duration, which we considered
more important in our particular use case, to 2, and
the weights of the rest of the behaviour markers to 1.
Predictive Behavioural Monitoring and Deviation Detection in Activities of Daily Living of Older Adults
905
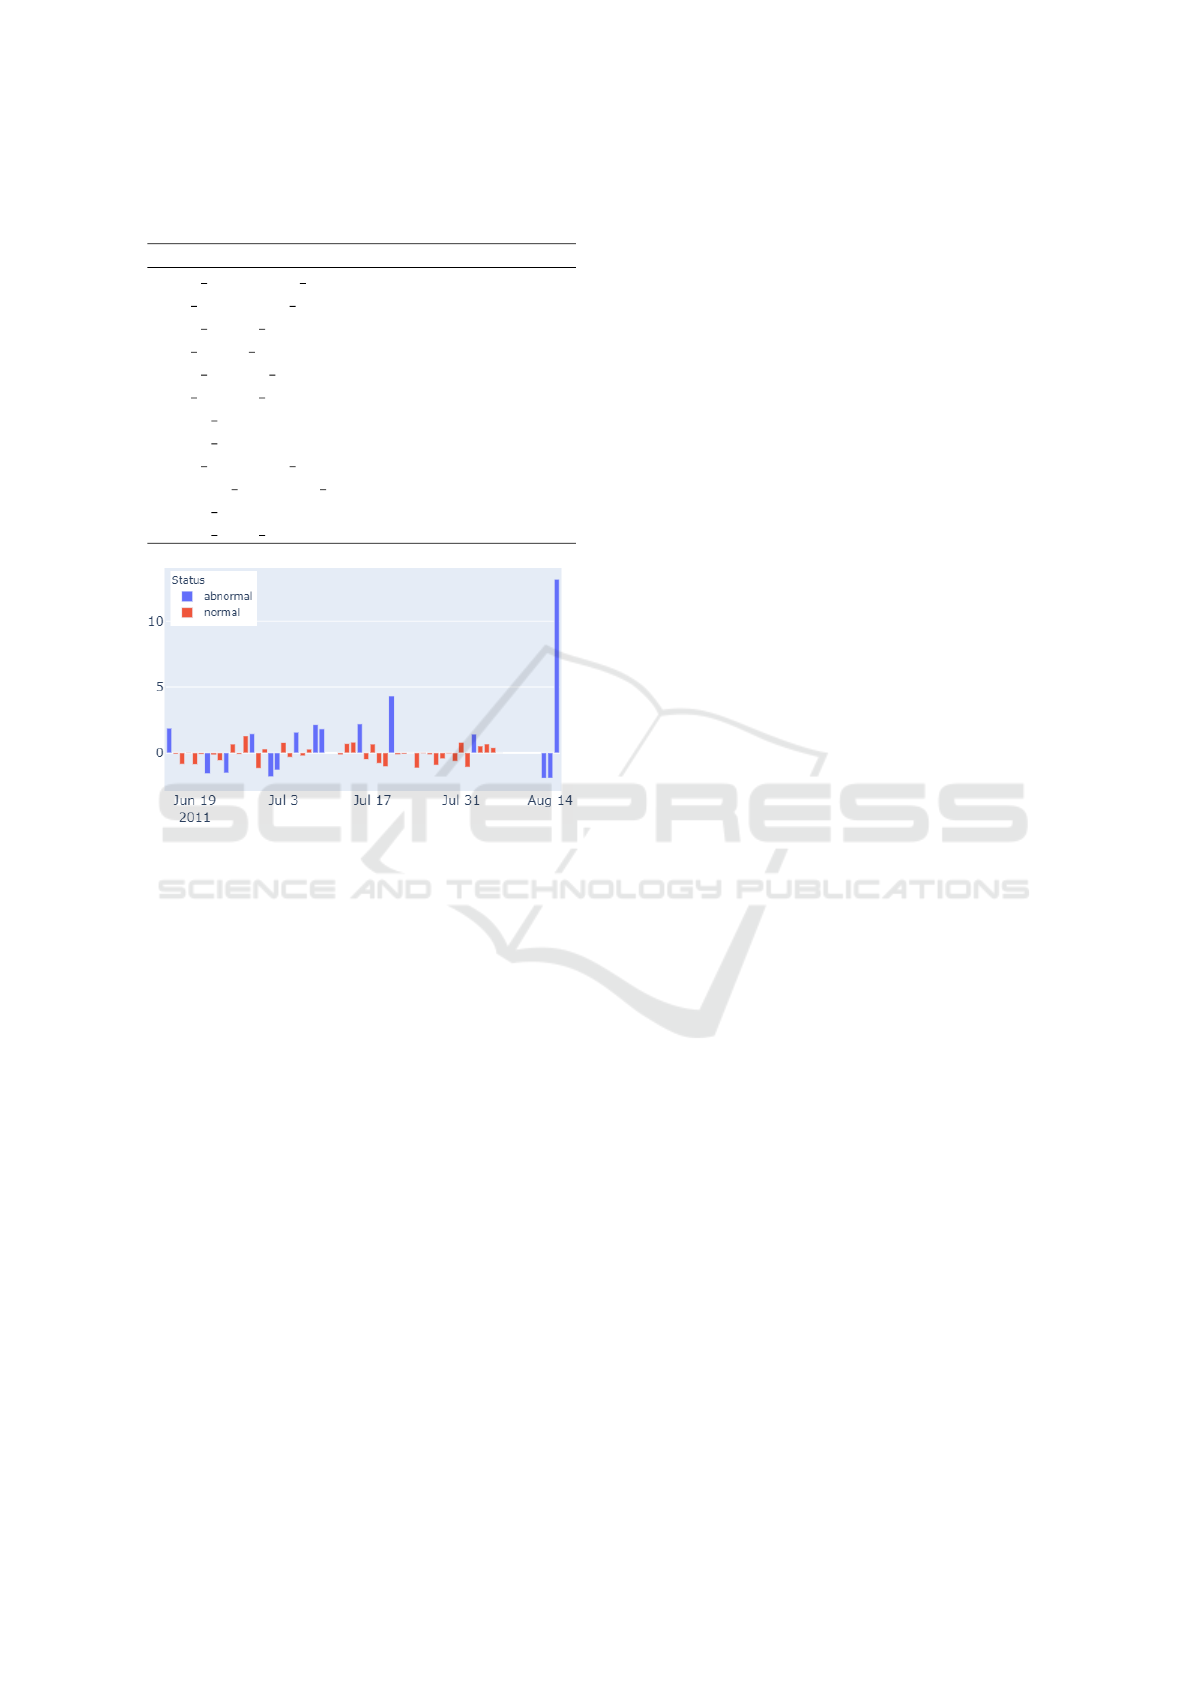
Table 4: Performance measures of the models on the be-
haviour markers of hh102.
Behaviour markers MAE RMSE
cook breakfast time 3745.318 3938.721
eat breakfast time 4185.226 4611.391
cook lunch time 4232.662 5127.29
eat lunch time 6120.533 6651.227
cook dinner time 1263.975 1580.311
eat dinner time 1687.354 2115.673
sleep time 2726.95 3160.01
sleep duration 3875.959 4543.112
take medicine time 4615.162 4933.677
morning medicine time 2250.793 2825.039
bathe duration 187.1277 274.4289
leave home duration 3415.511 4944.483
Figure 2: Detected deviations of sleep duration for hh102.
Figure 2 shows the calculated z values for sleep
duration on different dates. Negative values mean that
the actual sleep duration was longer than the predicted
value, while positive values mean the expected sleep
duration was longer than the actual value. We detect
deviations on 15 days, which we label abnormal.
We also visualize the actual values and predicted
values of behaviour markers related to time of the day
and their MAE range in a timetable in Figure 3. Red
marks mean the actual value and the yellow marks
mean the predicted value with a line showing the cor-
responding fault tolerance range based on the thresh-
old of the z value. We can readily figure out which be-
haviour markers are deviations and the magnitude of
each one. For example, we see that participant hh102
took their morning medicine earlier than the predicted
time on this particular day.
We summarize the computed personal temporal
profile of the individual person, including their daily
routines, long-term trends and detected deviations in
an interactive dashboard. Figure 3 shows one of the
views of our dashboard that visualizes the absolute
deviation cost, the weighted deviation cost, the de-
tected deviations, and the predicted ranges (in yellow)
and actual values (in red) of behavioural markers re-
lated to the time of the day for a particular, selected
date. Other views of our dashboard show a timeline
of the detected day routine and the long-term trends of
the behavioural markers, but due to space limitations
we do not present these here.
4.3 Long-term Deviations
Based on the 2 month data of the individual hh102,
we analyse the sleep duration trend to detect whether
it is deteriorating. The general trend of sleep duration
for hh102 is shown in Figure 4, where the horizontal
axis and the vertical axis represent the observed date
period and the sleep duration in seconds respectively.
The black dots represent the actual sleep duration of
that day, while the blue shaded area shows the predic-
tion range (lower bound and upper bound) provided
by Prophet. The predicted trend shows the sleep du-
ration follows a relatively steady pattern over time.
We further explore the long-term trend by filtering
out deviations that may be skewing the trend of the
normal routine. Firstly, we classify the sleep duration
as abnormal or normal based on the detected devia-
tions. Secondly, we filter out the dates with abnormal
sleep duration and investigate the normal pattern over
an extended period of time. More specifically, we cal-
culated the overall linear trend and weekly seasonal-
ity (the relative effect of each day of the week to the
predicted value) of our predictive model, the results
are shown in Figure 5. The normal linear trend (Fig-
ure 5a) shows the sleep duration of hh102 is increas-
ing during this period. The weekly seasonality shows
the person gets the least sleep time on Wednesday.
We have also included the trend calculated using
all of the data, without filtering deviations (Figure 5a).
The 2 trends are visibly different, which demonstrates
how deviating behaviour can significantly affect the
observed trend. In the context of analysing long term
sleep routines with the aim of exploring implications
to health, abnormal days become outliers that skew
the results. Instead, we choose to filter those out and
focus on the “normal” or routine behaviour and how
it evolves through time.
4.4 Relationships between Activities
We take sleep duration as an example to investigate
the relationship with other activities. Through tempo-
ral deviation detection, the sleep duration of each day
can be labelled as abnormal and normal. We combine
all the labelled sleep duration data of 11 individuals
to train a classification model. The goal is to classify
sleep duration as normal or abnormal using the other
behaviour markers as features.
Smart CommuniCare 2022 - Special Session on Smart Living Environments to Support Aging-in-Place in Vulnerable Older Adults
906
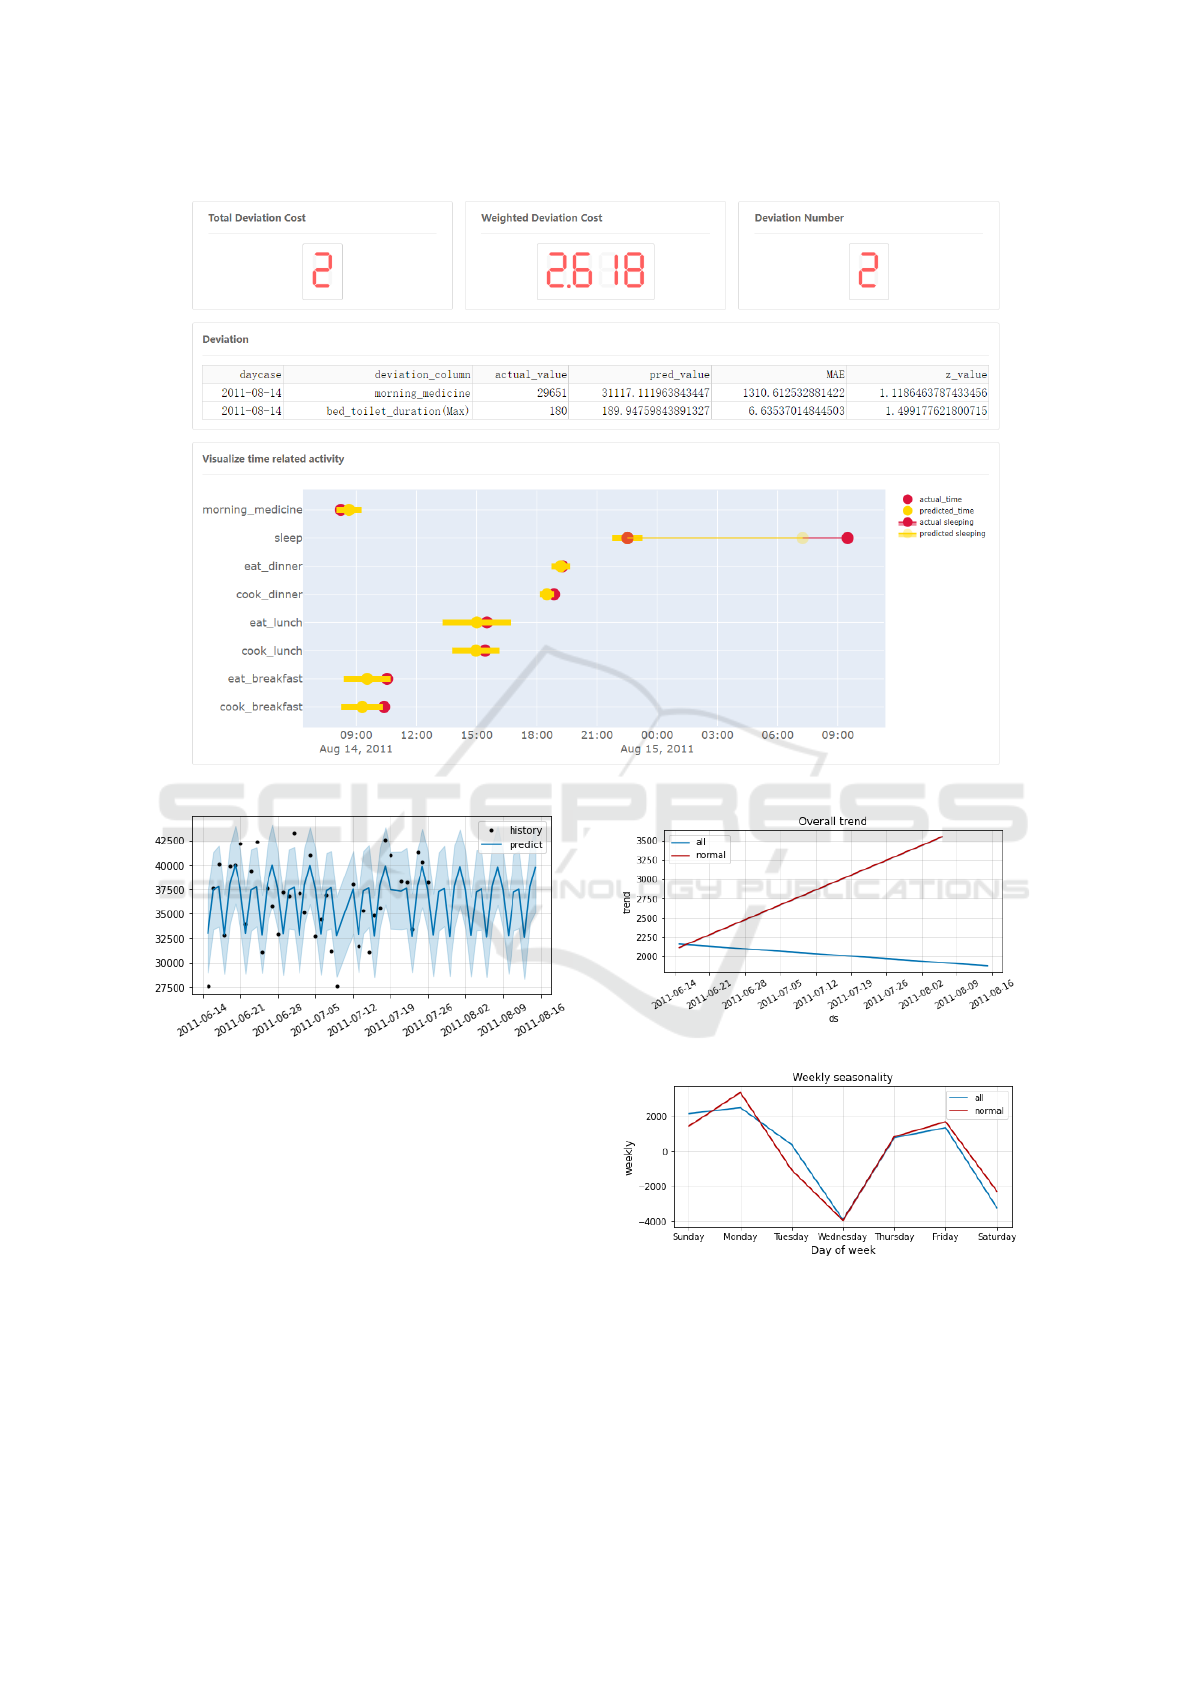
Figure 3: The dashboard for visualizing the temporal profile of each individual.
Figure 4: The predicted trend of sleep duration for hh102
using data from 15 June to 26 July 2011.
To this end, we first train separate predictive mod-
els of sleep duration for each person in the dataset.
The performance of each model is shown in Table 5.
The results show that the error of each predictive
model is less than 1 hour, which we consider a rea-
sonable error range for a sleep duration prediction.
Next, we experiment with different z values be-
tween 1 and 2 to choose the best classification method
and investigate how different z values impact the ac-
curacy. We train separate classification models based
on the results of deviations calculated by different z
values. A 10-fold cross validation is used to calculate
the performance. We choose accuracy, Auc, recall,
precision and F1 score of the cross-validated results as
(a) The overall trend of sleep duration for hh102.
(b) The weekly seasonality of sleep duration for hh102.
Figure 5: Long term pattern of sleep duration for hh102.
our metrics to evaluate the classification model. The
Auc metric can make a reasonable evaluation of a bi-
nary classification problem on imbalanced datasets,
i.e. datasets where one class (normal) has a much
Predictive Behavioural Monitoring and Deviation Detection in Activities of Daily Living of Older Adults
907
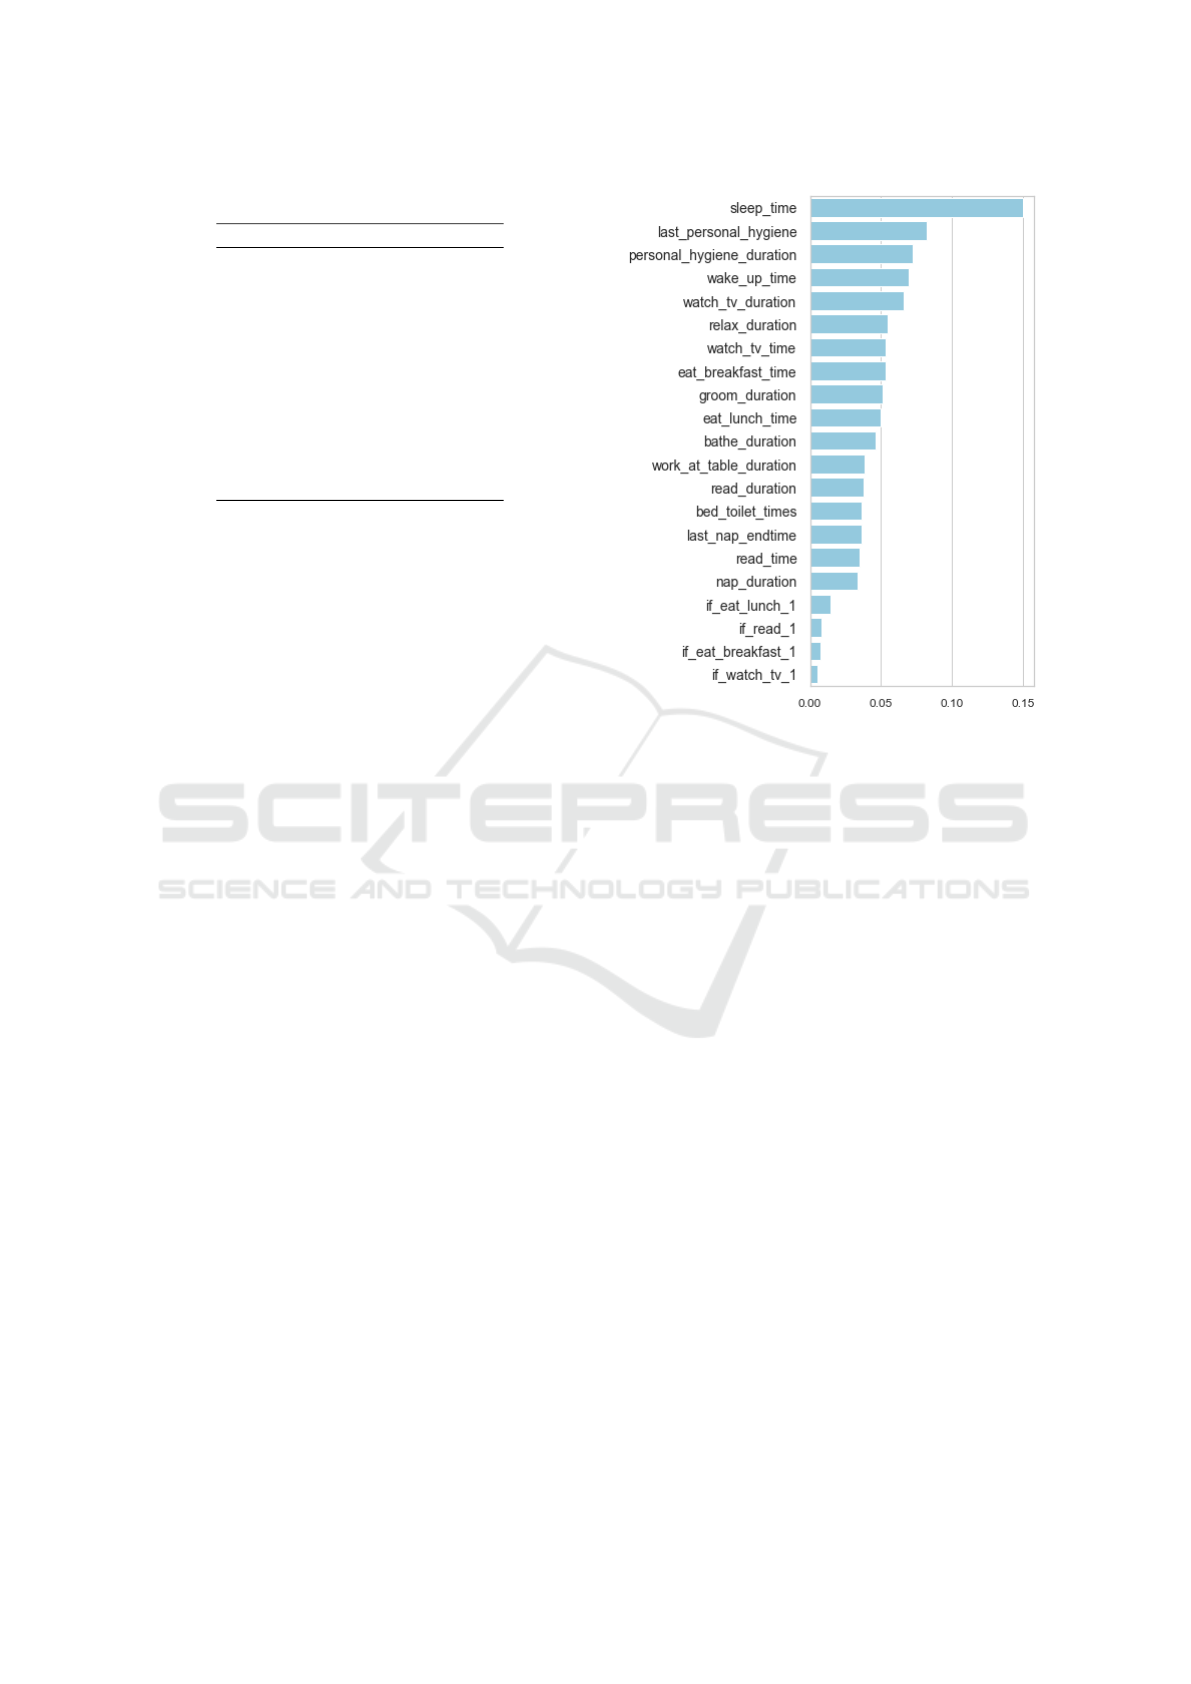
Table 5: Individual performance of sleep duration models.
Participant MAE RMSE
hh101 3959.30 4863.67
hh102 2802.01 3152.73
hh103 1177.24 1443.22
hh104 2974.59 3491.83
hh105 2013.01 2181.18
hh106 1218.23 1442.67
hh107 1939.70 1956.81
hh108 2671.29 2962.98
hh109 1537.11 2286.03
hh110 559.72 804.56
hh111 1533.05 1784.17
larger population than the other (abnormal).
The results show that the Random Forest Classi-
fier performs best, so we use it as the main model.
The comparison of performance for different z values
is shown in Table 6. It shows that the higher z value
we choose, the better classification performance we
get. The higher the performance of the model means
the features are more predictable and the results on
feature importance are more reliable. We get the high-
est Auc when the z value is set to 1.8, which means the
classification performs best on this imbalanced case.
Therefore, we investigate the relationships between
sleep duration and other activities for a z value of 1.8.
The calculated (impurity-based) feature impor-
tance of the Random Forest Classification model is
shown in Figure 6. These particular results show that
the total duration and the last time of personal hy-
giene activities have a strong influence on sleep du-
ration. Also, the morning wake up time has a high
correlation with sleep duration, meaning that the time
one wakes up in the morning can significantly affect
their sleep duration compared to their usual routine at
night. Surprisingly, nap duration during the day has a
weaker correlation with the nightly sleep duration.
5 CONCLUSIONS
In this paper, a predictive behaviour monitoring ap-
proach is proposed for ADLs coupled with a method-
ology to detect short-term deviations and long-term
trends. Moreover, we investigate the causal factors
of deviations by exploring the relationship between
different daily activities in terms of predictive power.
Experiments are conducted on a sample of 11 individ-
uals’ ADLs data that is publicly available.
Due to the dynamic nature of human behaviour
and the variability between different people, we set
an adjustable deviation threshold for each behaviour
marker such that the model is tailored to individual
Figure 6: Feature importance of the Random Forest Classi-
fier.
human activities. We can also modify the individual
weights of each behaviour marker in order to obtain
an aggregate score that reflects the importance of each
deviation, for instance in terms of health outcomes.
Finally, we develop a dashboard which visualizes the
various information of the human behaviour, such as
daily routine, potential deviations, trend of sleep du-
ration, etc. The dashboard provides both the person
involved and their caregivers with key behavioural in-
sights.
The work presented in this paper is indicative of
the useful insights that sensor data on ADLs can pro-
vide towards health monitoring of older adults. We
believe that such insights have the potential to en-
able an unprecedented capacity for self monitoring
and management as well as inform proactive interven-
tions far in advance of any adverse health events.
However, further challenges still exist in dealing
with the inherent noise in the data and the variability
of people’s routines. The models used are naturally
sensitive to noise. We therefore believe that future
improvements in ADL data collection, especially in
the 4 types of noise we identified (see Section 3.1),
will bring forth significantly better and more accurate
insights. Moreover, results need to be further contex-
tualised to the needs, lifestyles, and medical condi-
tions of the individual participants. Further compar-
ison experiments with literature could get more con-
vincing insights for providing proactive interventions
Smart CommuniCare 2022 - Special Session on Smart Living Environments to Support Aging-in-Place in Vulnerable Older Adults
908

Table 6: The performance of classification model with different z value.
z value Normal cases Abnormal cases Accuracy Auc Recall Precision F1
1 268 226 0.5478 0.5892 0.5914 0.5815 0.5858
1.3 330 164 0.6812 0.6145 0.8707 0.7067 0.7799
1.5 359 135 0.7304 0.6705 0.9145 0.7565 0.8279
1.8 390 104 0.8058 0.7001 0.9814 0.8094 0.8871
2.0 405 89 0.8348 0.6703 0.9857 0.8395 0.9067
2.3 422 72 0.8580 0.6709 0.9966 0.8581 0.9222
and making decisions. Data collection and analysis
beyond the limited dataset we have explored so far is
likely to improve the quality of our algorithms and
lead to new types of insights particularly for long-
term predictions.
REFERENCES
Akram, U., Gardani, M., Riemann, D., Akram, A., Allen,
S. F., Lazuras, L., and Johann, A. F. (2020). Dys-
functional sleep-related cognition and anxiety mediate
the relationship between multidimensional perfection-
ism and insomnia symptoms. Cognitive Processing,
21(1):141–148.
Albanese, A. M., Bartz-Overman, C., Parikh, MD, T.,
and Thielke, S. M. (2020). Associations Between
Activities of Daily Living Independence and Mental
Health Status Among Medicare Managed Care Pa-
tients. Journal of the American Geriatrics Society,
68(6):1301–1306.
Alberdi Aramendi, A., Weakley, A., Aztiria Goenaga, A.,
Schmitter-Edgecombe, M., and Cook, D. J. (2018).
Automatic assessment of functional health decline in
older adults based on smart home data. Journal of
Biomedical Informatics, 81:119–130.
Aminikhanghahi, S., Wang, T., and Cook, D. J. (2019).
Real-Time Change Point Detection with Application
to Smart Home Time Series Data. IEEE Transactions
on Knowledge and Data Engineering, 31(5):1010–
1023.
Anderson, J. L., Rosen, L. N., Mendelson, W. B., Jacobsen,
F. M., Skwerer, R. G., Joseph-Vanderpool, J. R., Dun-
can, C. C., Wehr, T. A., and Rosenthal, N. E. (1994).
Sleep in fall/winter seasonal affective disorder: Ef-
fects of light and changing seasons. Journal of Psy-
chosomatic Research, 38(4):323–337.
Arifoglu, D. and Bouchachia, A. (2019). Detection of ab-
normal behaviour for dementia sufferers using Con-
volutional Neural Networks. Artificial Intelligence in
Medicine, 94:88–95.
Bergmeir, C. and Ben
´
ıtez, J. M. (2012). On the use of cross-
validation for time series predictor evaluation. Infor-
mation Sciences, 191:192–213.
Cohen-Mansfield, J. and Perach, R. (2012). Sleep Duration,
Nap Habits, and Mortality in Older Persons. Sleep,
35(7):1003–1009.
Cook, D. J., Crandall, A. S., Thomas, B. L., and Krish-
nan, N. C. (2013a). CASAS: A Smart Home in a Box.
Computer, 46(7):62–69.
Cook, D. J., Krishnan, N. C., and Rashidi, P. (2013b). Ac-
tivity Discovery and Activity Recognition: A New
Partnership. IEEE Transactions on Cybernetics,
43(3):820–828.
Cook, D. J. and Schmitter-Edgecombe, M. (2021). Fusing
Ambient and Mobile Sensor Features Into a Behav-
iorome for Predicting Clinical Health Scores. IEEE
Access, 9:65033–65043.
Dawadi, P. N., Cook, D. J., and Schmitter-Edgecombe,
M. (2016). Automated Cognitive Health As-
sessment From Smart Home-Based Behavior Data.
IEEE Journal of Biomedical and Health Informatics,
20(4):1188–1194.
Howedi, A., Lotfi, A., and Pourabdollah, A. (2020). An
Entropy-Based Approach for Anomaly Detection in
Activities of Daily Living in the Presence of a Visi-
tor. Entropy, 22(8):845.
Ilyas, I. F. and Chu, X. (2019). Data Cleaning. Association
for Computing Machinery, New York, NY, USA.
Kanti Majumdar, K. (2014). Relationship of Activity of
Daily Living with Quality of Life. British Medical
Bulletin, BBB[2][4][2014]:757–764.
Maclin, R. and Opitz, D. (1999). Popular Ensemble Meth-
ods: An Empirical Study. Journal of Artificial Intelli-
gence Research, 11:169–198.
Palmer, M. G. (2018). Experimenter presence in human be-
havior analytic laboratory studies: Confound it? Be-
havior Analysis: Research and Practice, 19(4):303.
Pazhoumand-Dar, H., Armstrong, L. J., and Tripathy, A. K.
(2020). Detecting deviations from activities of daily
living routines using kinect depth maps and power
consumption data. Journal of Ambient Intelligence
and Humanized Computing, 11(4):1727–1747.
Pedregosa, F., Varoquaux, G., Gramfort, A., Michel, V.,
Thirion, B., Grisel, O., Blondel, M., Prettenhofer, P.,
Weiss, R., Dubourg, V., Vanderplas, J., Passos, A.,
Cournapeau, D., Brucher, M., Perrot, M., and Duch-
esnay,
´
E. (2011). Scikit-learn: Machine Learning
in Python. Journal of Machine Learning Research,
12(85):2825–2830.
Pierleoni, P., Belli, A., Palma, L., Pellegrini, M., Pernini,
L., and Valenti, S. (2015). A High Reliability Wear-
able Device for Elderly Fall Detection. IEEE Sensors
Journal, 15(8):4544–4553.
Piovezan, R. D., Poyares, D., and Tufik, S. (2013). Frailty
and sleep disturbances in the elderly: possible con-
nections and clinical implications. Sleep Science,
6(4):175–179.
Predictive Behavioural Monitoring and Deviation Detection in Activities of Daily Living of Older Adults
909

Sepesy Mau
ˇ
cec, M. and Donaj, G. (2021). Discovering
Daily Activity Patterns from Sensor Data Sequences
and Activity Sequences. Sensors, 21(20):6920.
Taylor, S. J. and Letham, B. (2017). Forecasting at scale.
Technical Report e3190v2, PeerJ Inc.
University of Edinburgh (2021). Advanced Care Research
Centre. https://edin.care. Accessed on Dec 12, 2021.
Yahaya, S. W., Lotfi, A., and Mahmud, M. (2019). A
Consensus Novelty Detection Ensemble Approach for
Anomaly Detection in Activities of Daily Living. Ap-
plied Soft Computing, 83:105613.
Yahaya, S. W., Lotfi, A., and Mahmud, M. (2021a). Detect-
ing Anomaly and Its Sources in Activities of Daily
Living. SN Computer Science, 2(1):14.
Yahaya, S. W., Lotfi, A., and Mahmud, M. (2021b). To-
wards a data-driven adaptive anomaly detection sys-
tem for human activity. Pattern Recognition Letters,
145:200–207.
Smart CommuniCare 2022 - Special Session on Smart Living Environments to Support Aging-in-Place in Vulnerable Older Adults
910
