Classification and Analysis of Liverwort Sperm by Integration-Net
Haruki Fujii
1
, Naoki Minamino
2
, Takashi Ueda
2,3
, Yohei Kondo
2,3,4
and Kazuhiro Hotta
1
1
Meijo University, 1-501 Shiogamaguchi, Tempaku-ku, Nagoya 468-8502, Japan
2
National Institute for Basic Biology, 38 Nishigounaka, Myoudaiji-cho, Okazaki 444-0867, Japan
3
The Graduate University for Advanced Studies, 1560-35 Syonankokusai-mura, Hayama-machi, Miura-gun, Japan
4
Exploratory Research Center on Life and Living Systems (ExCELLS),
5-1 Higashiyama, Myodaiji-cho, Okazaki, 444-8787, Japan
Keywords: Video Recognition,
3DCNN, Visualization, Liverwort.
Abstract: In this paper, we propose a method to classify the videos of wild-type and mutant sperm of liverwort using
deep learning and discover the differences between them. In traditional video classification, 3D-Convolution
was often used. However, when 3D CNN is used, the information of multiple frames is mixed. Therefore, it
is difficult to detect important frames and locations in a video. To solve this problem, we proposed a network
that retains video frame information using Depthwise Convolution and Skip Connection, and used gradient-
based visualization to analyze the difference between wild type and mutant sperm. In experiments, we
compared the proposed method with conventional 3DCNN and show the effectiveness of the proposed method.
1 INTRODUCTION
In recent years, there has been a lot of researches of
video recognition based on Convolutional Neural
Network (CNN). These techniques have been applied
not only to human behavior recognition (Dalal, N.,
Triggs, B., & Schmid, C., 2006), but also to animal
behavior (Anderson, D. J., & Perona, P., 2014). The
purpose of this paper is to classify two types of sperm
using CNN and to discover the differences between
two types of sperm (mutant and wild type) by
visualizing the important frames and locations in a
video.
We would like to visualize important frames and
locations in a video for classification. However, the
3DCNN used for video recognition collapses the
frame information as it goes through the layers.
Therefore, important frame information cannot be
analyzed by gradient-based approaches such as Grad-
CAM (Selvaraju, R. R., Cogswell, M., Das, A.,
Vedantam, R., Parikh, D., & Batra, D., 2017) and
Grad-CAM++ (Chattopadhay, A., Sarkar, A.,
Howlader, P., & Balasubramanian, V. N., 2018). It is
necessary to maintain the time-series information of
frames in the network to discover important frames
and locations in a video.
In this paper, we propose Integration-Net which is
the integrated network of two different networks
devised to maintain frame information. One network
in the integrated network has the structure in which
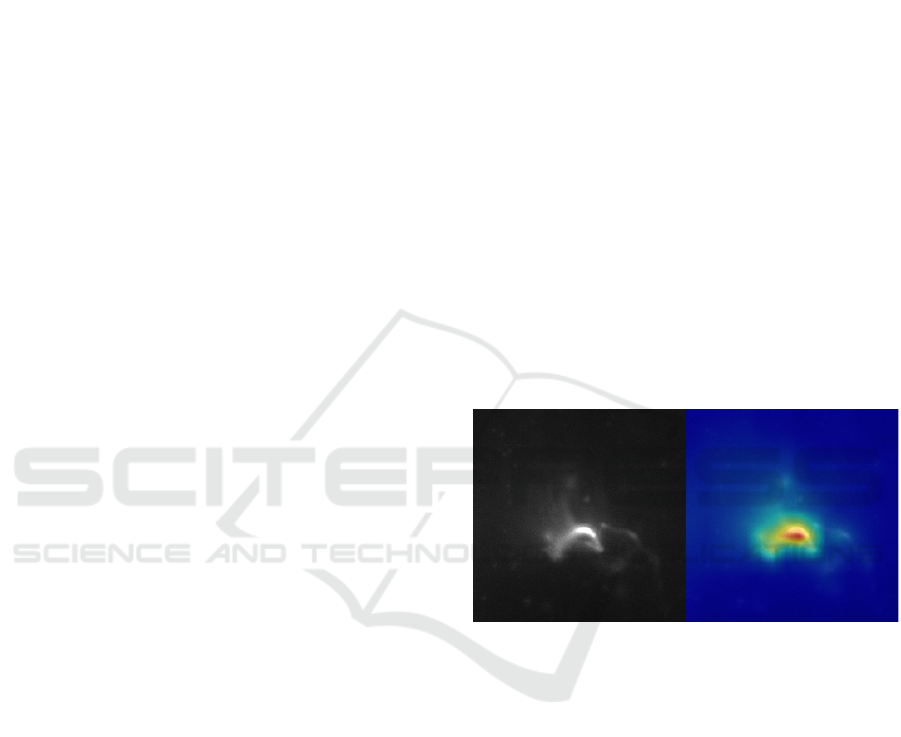
Figure 1: Example of visualization. Left shows an input
image and right shows the result of visualization.
the input frame information is transmitted to the
deeper layer by skip connection in order to maintain
the frame information. The other network uses the
Depthwise convolution. Since the Depthwise
convolution applies a single filter to each channel,
there is no risk for losing frame information. By
integrating the outputs of these two different
networks, we can use the advantages of ensemble
effect which is expected to improve the accuracy in
comparison with a single network.
When a video is classified, our method visualizes
which parts in the video are important for Integration-
Net to determine whether it is wild type or mutant.
We obtain feature maps whose channel is the same
number of frames as the input video, and calculate the
gradients from the outputs to visualize the important
locations and frames in a video.
Fujii, H., Minamino, N., Ueda, T., Kondo, Y. and Hotta, K.
Classification and Analysis of Liverwort Sperm by Integration-Net.
DOI: 10.5220/0010915700003124
In Proceedings of the 17th International Joint Conference on Computer Vision, Imaging and Computer Graphics Theory and Applications (VISIGRAPP 2022) - Volume 4: VISAPP, pages
699-705
ISBN: 978-989-758-555-5; ISSN: 2184-4321
Copyright
c
2022 by SCITEPRESS – Science and Technology Publications, Lda. All rights reserved
699
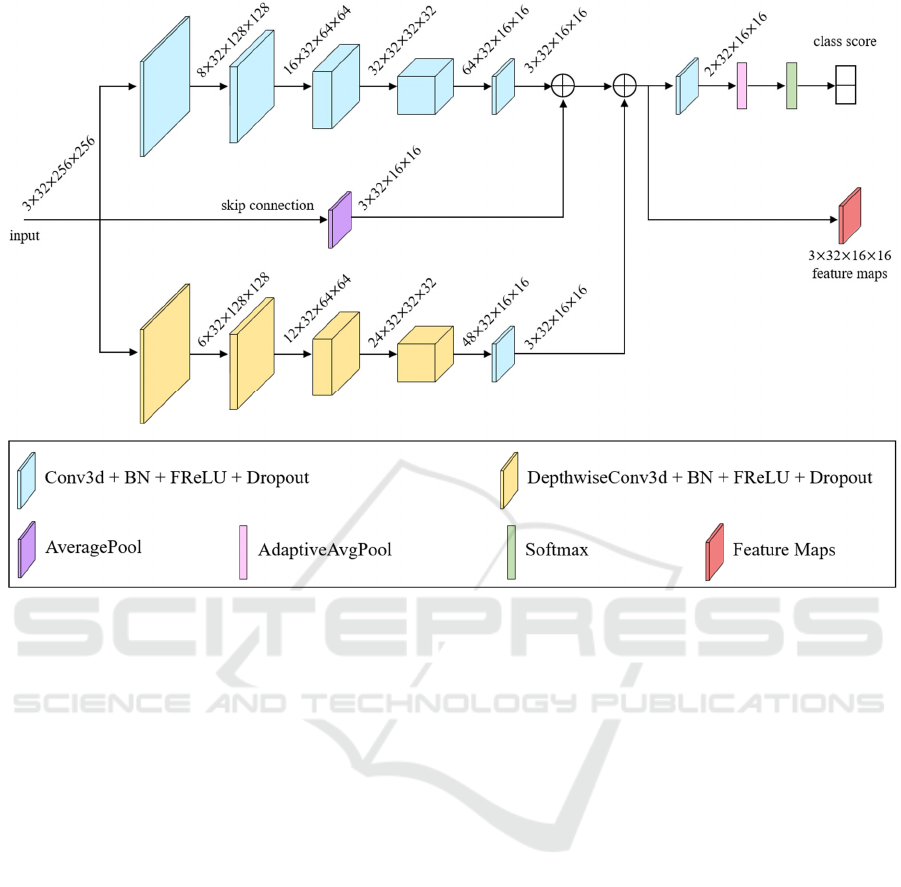
Figure 2: Network architecture of Integration-Net. The numbers in the figure represents the shape of feature maps. For
example, 3 × 32 × 256 × 256 at input represents 3 channels, 32 frames and a size of 256 × 256. BN represents batch
normalization.
In our experiments, we used the videos of
liverwort sperm to discriminate between wild type
and mutants, and achieved an average classification
accuracy 91.79%. In addition, from visualization
results, we confirmed that our method discovered
important frames and locations in a video for
classification. Figure 1 shows the visualization result
in which red indicates important locations and blue
indicates unimportant locations.
The organization of this paper is as follows. First,
section 2 describes related works. Section 3 explains
the proposed method. Section 4 describes the
experimental methods and shows the experimental
results. Finally, in section 5, we describe the
conclusion and future works.
2 RELATED WORKS
2.1 Video Recognition
In recent years, video recognition has been dominated
by CNN-based approaches as well as image
recognition. Since video has an additional dimension
in the time direction to images, and there is a
difference in the characteristics of mainly temporal
and spatial information. Therefore, simple time
dilation, which is an effective method for image
recognition, is not always effective for video
recognition.
3D CNN (Ji, S., Xu, W., Yang, M., & Yu, K.,
2012) is a method that considers the information in
temporal direction by 3D-convolutional processing,
which is the extension of 2D convolutional
processing to the temporal direction.
C3D (Tran, D., Bourdev, L., Fergus, R.,
Torresani, L., & Paluri, M., 2015) was proposed as a
pioneering method for 3DCNN. It can learn task-
appropriate spatio-temporal features in an end-to-end
manner.
In this paper, we propose the Integration-Net
which integrates two different networks. It can use
ensemble of two networks, and we can improve the
accuracy in comparison with a single network. In this
paper, we would like to classify sperm videos and
visualize the important frames and locations in a
video. However, conventional video classification
methods cannot visualize the important frames
VISAPP 2022 - 17th International Conference on Computer Vision Theory and Applications
700
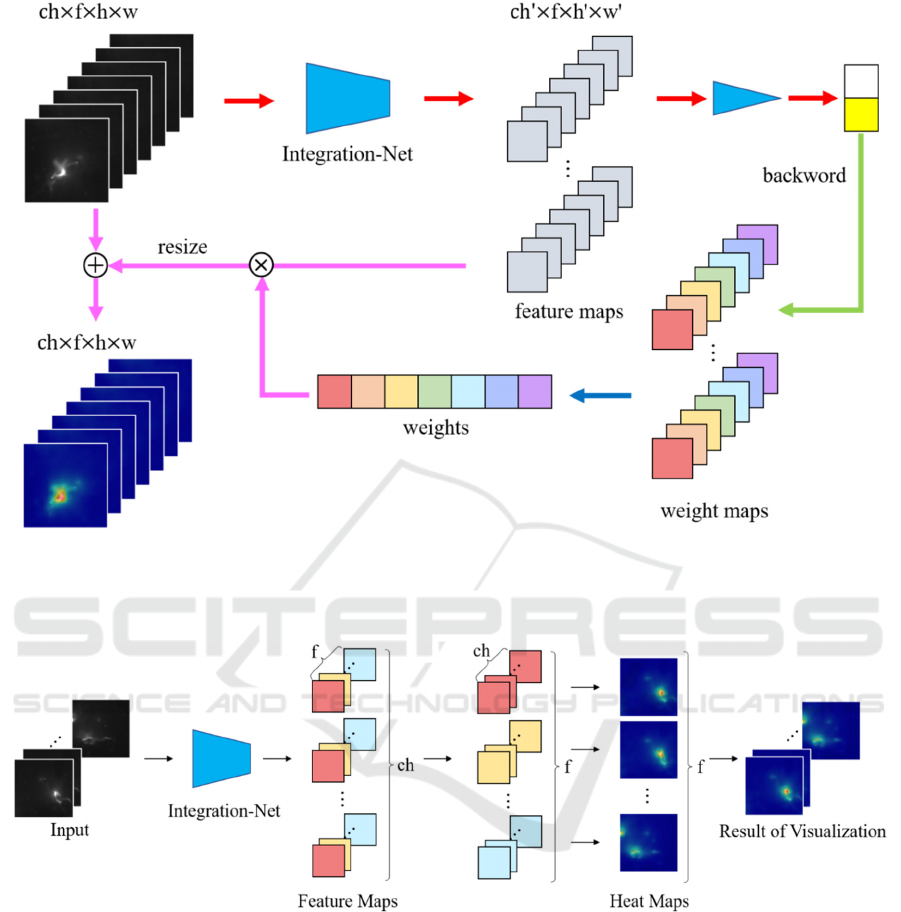
Figure 3: Overview of proposed method. We visualized the important frames and locations by weighting the gradients against
the network predictions. This allows us to show the differences between wild type and mutant sperm. We compute the gradient
of convolutional layer from the prediction result and create weight maps. Weights are calculated by averaging them in channel
direction at each frame of the weight maps. For each pixel, we calculate the product between the feature maps and the weights.
Figure 4: How to detect the differences by our method. The “f” and “ch” represent the number of frames and channels in the
feature maps. The dimension of the feature maps in the Integration-Net is channel x frame x height x width. We transposed
the channels and frames of the feature maps as a preprocessing step for visualization. This allows us to generate a heat map
for each frame.
because the number of output channels is different
from the number of input frames. Our proposed
Integration-Net solved this problem by skip
connection of input information and the Depthwise
convolution.
2.2 Visualization Method
There are researches that visualize where the network
pays attention to classification. If the classification
accuracy of the model is high, the visualization results
can help the people discover problems and new
phenomena. Some visualization methods have been
proposed; Guided backpropagation (Springenberg, J.
T., Dosovitskiy, A., Brox, T., & Riedmiller, M.,
2014) and deconvolution (Zeiler, M. D., & Fergus, R.,
2014) visualized CNN predictions by highlighting
important pixels. These methods emphasized the
details of the image at high resolution, but are unable
to identify classes. Grad-CAM (Selvaraju, R. R.,
Classification and Analysis of Liverwort Sperm by Integration-Net
701
Cogswell, M., Das, A., Vedantam, R., Parikh, D., &
Batra, D., 2017) is a visualization method that
improved the problem. It is a technique for
visualizing important pixels for classification by
weighting their gradients with respect to the predicted
value. The weights are calculated by partially
differentiating the probability scores and all feature
maps are integrated by weighted average into a
saliency map. This means that positions that have a
large impact on the class decision have a large
probability score.
As shown in Figure 2, in the proposed method, the
feature maps from two different networks are
summed. To use gradient-based method such as
Grad-CAM for our method, we extract the summed
feature maps and classification results to visualize the
important parts. Grad-CAM gives the importance of
a pixel by summing in the channel (frames in a video)
direction. However, we would like to know the
important frames and locations. Thus, we must
modify Grad-CAM slightly.
3 PROPOSED METHOD
3.1 Overview of the Proposed Method
Figure 3 shows the overview of the proposed method.
Videos of 256 × 256 pixels and 32 frames are fed into
Integration-Net. As mentioned above, the number of
frames in the feature map used for visualization must
be the same as the number of frames in an input video.
To classify the videos, we used 1×1×1 convolution to
set the number of channels to the number of classes,
and then Adaptive Average Pooling was used. The
output with the highest probability is returned to
Integration-Net, where the important features that
affect the final probability score are calculated. In this
paper, a feature map that summed the outputs of two
networks was used for visualization, as shown in
Figure 2.
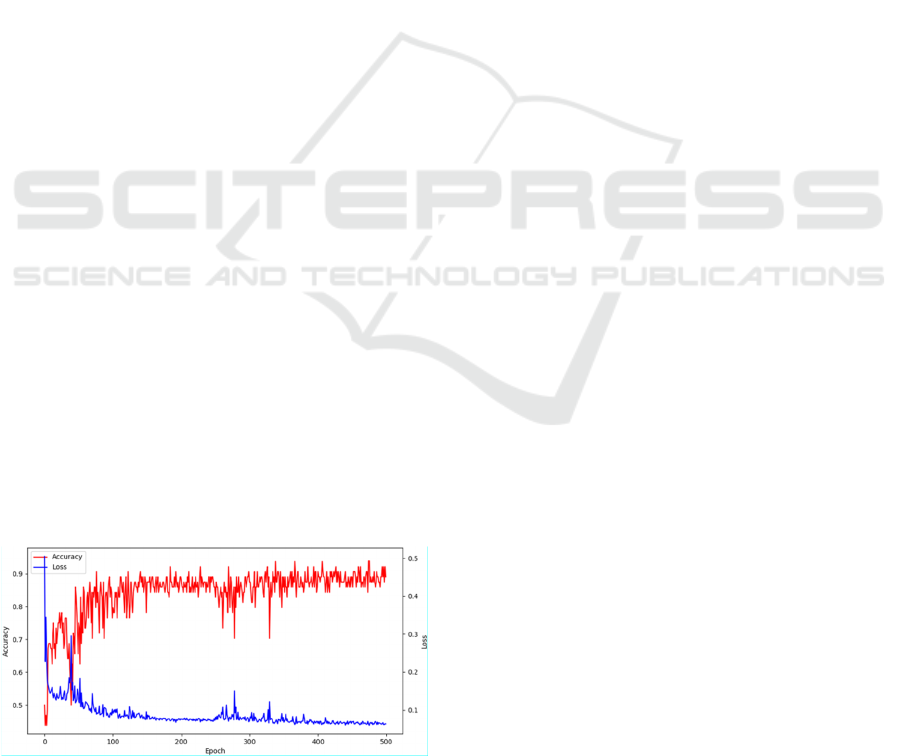
Figure 5: Accuracy and loss function for validation set.
3.2 Details of Network Architecture
Integration-Net is the integration of two different
networks. One of two networks has four
convolutional layers with 3D-Convolution, and the
input video is transmitted to the deeper layer by skip
connections. There is a difference in the resolution
and number of channels of the skip connection, and
we change the resolution of the input by average
pooling. The number of channels in the feature map
is also changed to the same number of channels in the
input video with 1 x 1 x 1 convolution. In general,
when we use 3D-Convolution, the information of
each frame is mixed up. If the frame information is
lost, the important frames cannot be identified when
we analyse important frames using gradient
information. Therefore, we compensate for the frame
information of input video by using skip connections
to convey the frame information of the input.
The other network uses the Depthwise
convolution. The reason for using the Depthwise
convolution is that it applies one filter to each
channel. Thus, frame information is not lost. It also
reduces the computational cost in comparison with
standard convolution. Integration with a network
using skip connections uses the sum of feature maps.
Therefore, the number of channels is also changed to
the same number of channels in the input video by
1×1×1 convolution before integration. This allows us
to align the shape of the output feature maps from the
two networks for integration.
In two networks, the kernel size and stride in the
frame direction for all convolutions were set to 1.
This allows us to keep the number of frames in the
network. After the convolution, batch normalization,
FReLU (Ma, N., Zhang, X., & Sun, J., 2020), and
dropout were used. FReLU is an activation function
specialized for image recognition. Unlike the
commonly used ReLU, the function can be changed
for each location as shown in equation (1).
y=maxx, T
x
(1)
where T(∙) is Depthwise convolution. Therefore,
FReLU is able to learn spatial elements for each pixel,
and can decide whether to use the learned pixel or not
by max(∙).
3.3 Discover the Difference
Figure 4 shows how our method discover the
difference in sperm. The dimension of output feature
map in the Integration-Net is channel × frame ×
height × width. Since Grad-Cam used in image
VISAPP 2022 - 17th International Conference on Computer Vision Theory and Applications
702
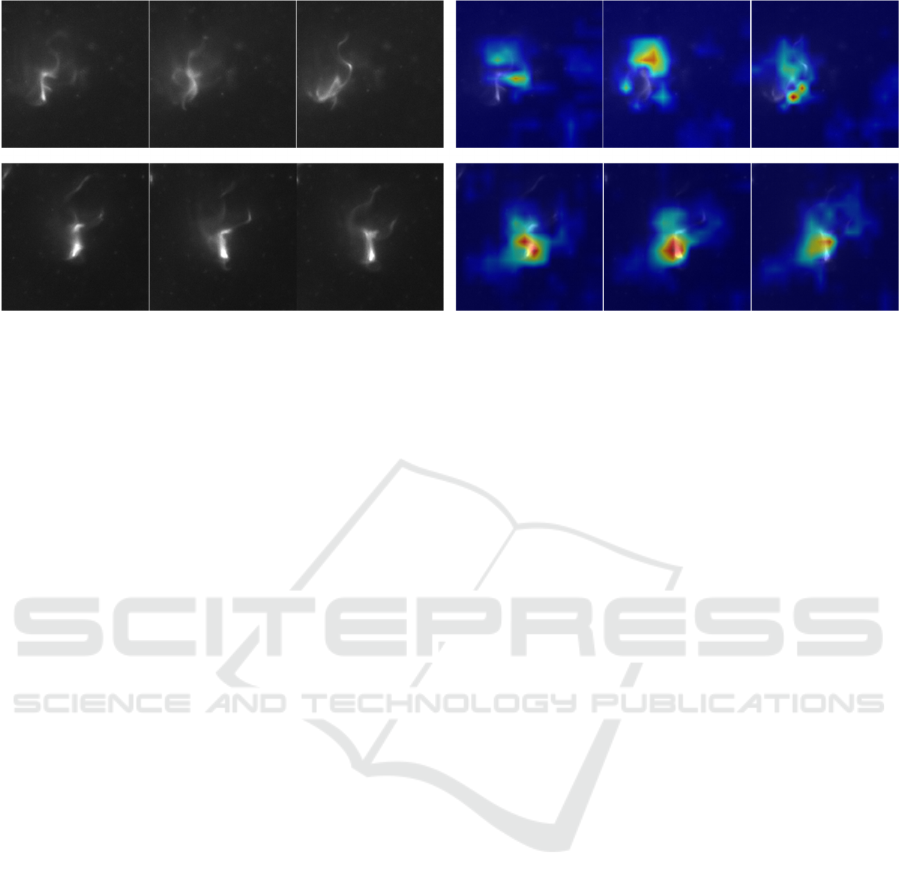
Figure 6: Results of difference discovery by our proposed method. The upper row is the wild type and the lower row is the
mutant. Left column shows the examples of input frames and right column shows the results of difference discovery.
classification is calculated by the weighted sum of
each channel, we cannot know the important frames.
Thus, as shown in Figure 4, the channels and frames
of the feature map are transposed as a preprocessing
step. This allows the channels corresponding to each
frame to be grouped together. For example, the first
frame of the feature map in Figure 4 is shown in red.
Thus, by computing the gradients of the feature map
and generating a heat map for each frame, we can
detect the differences between wild-type and mutant
sperm automatically. The difference shows important
frames and locations in a video for classification.
4 EXPERIMENTS
4.1 Datasets
In experiments, we used video datasets of liverwort
sperm. We cropped the areas including a single sperm
from videos and created 256 video clips. There is no
overlap for cropping areas. The size of video clips is
256 × 256 pixels, and the number of frames is 32.
There are two classes; wild type and mutant. We used
128 video clips for training, 64 for validation and 64
for test. We evaluate our method with 4-fold cross
validation.
4.2 Implementation Details
In this paper, we used the Pytorch library and trained
500 epochs using Adam optimizer. The initial
learning rate was set to 0.001, CosineAnnealingLR
was used as scheduler, T_0=250, T_mult=1.0,
eta_min=0.0, and the batch size was set to 32.
We used Focal Loss (Lin, T. Y., Goyal, P.,
Girshick, R., He, K., & Dollár, P., 2017) defined in
equation 2.
Focal Loss= -1-p
t
γ
logp
t
(2)
where γ is a hyper-parameter and we set γ to 2
according to the original paper.
We chose the model with the lowest loss or the
highest accuracy for validation set. The model is used
for evaluation.
In experiments, six methods were evaluated as
comparison. Six methods are as follows. 3D-
ResNet50 (Hara, K., Kataoka, H., & Satoh, Y., 2017)
which is commonly used in video classification; Skip-
Net which introduces skip connections from the input
frame; Depthwise-Net which uses the Depthwise
convolution; SS-Integration-Net which integrates two
Skip-Nets. DD-Integration-Net which integrates two
Depthwise-Nets. Integration-Net which integrates
Skip-Net and Depthwise-Net.
4.3 Results of Experiments
Table 1 shows the evaluation results of each method
when we use the model with the lowest loss for
validation set. We see that our proposed Integration-
Net, which integrates Skip-Net and Depthwise-Net
gave the best accuracy. The proposed method
improved the accuracy by more than 38% from the
conventional 3D-ResNet50. This is because 3D-
ResNet50 has a large model and overfitting might
occur. Integration of two different networks also gave
better classification accuracy than the integration of
two same networks. This is because the integration of
the two different networks allowed us to use the
ensemble effect.
Classification and Analysis of Liverwort Sperm by Integration-Net
703
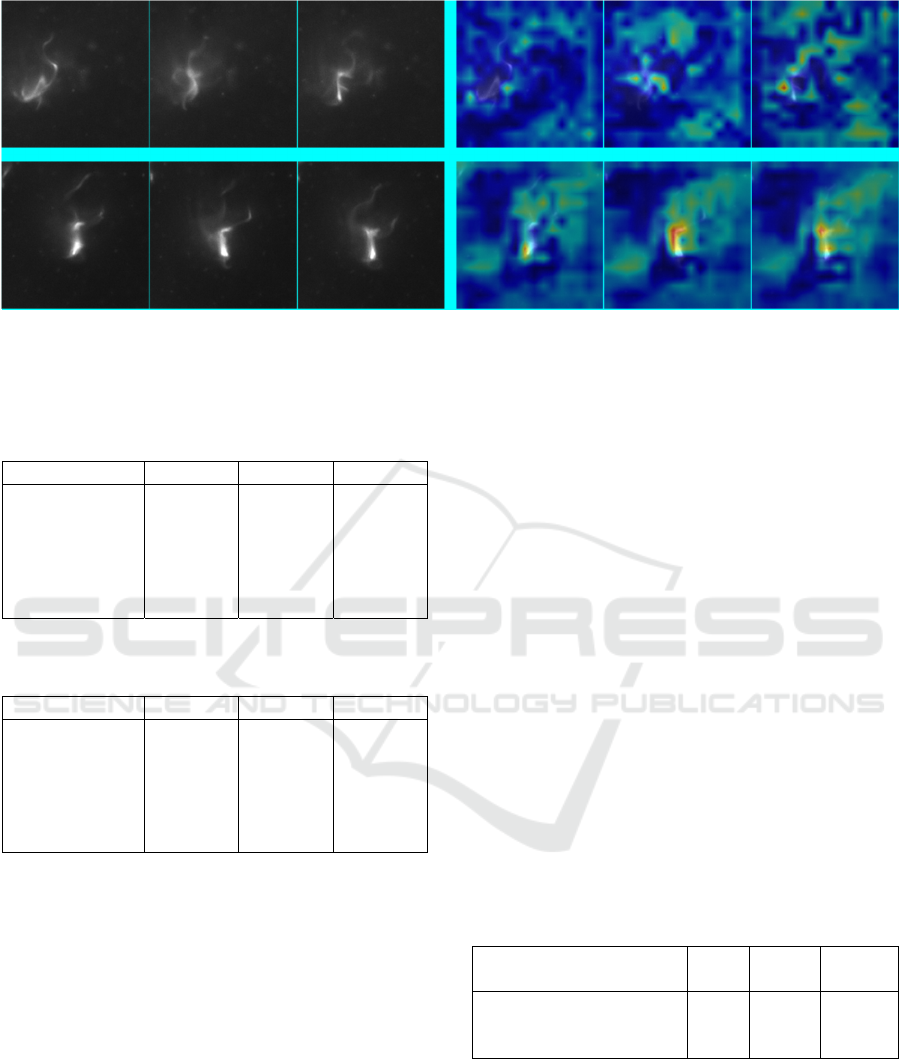
Figure 7: Results of difference discovery by our method when skip connection was removed. The upper row is the wild type
and the lower row is the mutant. Left column shows some frames in a video and right column shows the results of difference
discovery.
Table 1: Comparison results when the model with the
lowest loss for the validation set was chosen.
wild mutant Average
3D-ResNet50 60.94 46.10 53.52
Skip-Net 92.16 70.31 81.25
Depthwise-Net 88.28 89.84 89.06
SS-integration 67.97 93.75 80.86
DD-integration 89.06 91.41 90.24
SD-integration 89.84 93.75 91.79
Table 2: Comparison results when the model with the
highest accuracy for the validation set was chosen.
wild mutant average
3D-ResNet50 61.72 49.22 55.47
Skip-Net 87.50 69.53 78.52
Depthwise-Net 82.81 88.28 85.55
SS-integration 68.75 92.97 80.86
DD-integration 86.72 90.63 88.67
SD-integration 86.72 92.97 89.81
Table 2 shows the results when we choose the
model with the highest accuracy for validation set. In
comparison with the results in Table 1, the overall
accuracy became low. Figure 5 shows the graph of the
transition of accuracy and loss for the validation set.
The highest accuracy is achieved at around 350
epochs, but the loss function continues to be low until
the end of the training. Therefore, it is more accurate
to choose the model with the lowest loss for the
validation set.
Figure 6 shows the visualization results of
important frames and locations for classification by
our proposed method. Important parts are shown in
red and unimportant parts are shown in blue. In both
the wild type and the mutant classes, the flagella that
are used for swimming in water were discovered as
an important part for classification. This indicates that
the wild type and the mutant have the differences in
their flagella. The visualization results show that the
flagella of wild type is a distinctive feature compared
with the mutant’s flagella.
4.4 Ablation Study
In this section, we investigate the effectiveness of
FReLU and skip connections used in the proposed
method. In the experiment, three models were
compared. Three models are our proposed method,
the proposed method without the skip connection, and
the proposed method that the FReLU is replaced by
ReLU.
Table 3 shows the results of ablation study. We can
confirm that the accuracy was improved by more than
8% by using FReLU as the activation function.
FReLU is also effective in video classification using
3D-convolution.
Table 3: Results of the proposed method when skip
connection is not used and when the activation function
FReLU is replaced by ReLU.
skip
connection
activation
function
wild mutant average
FReLU 67.97 93.75 80.86
✓ ReLU 85.94 81.25 83.60
✓ FReLU 89.84 93.75 91.79
Evaluation results showed that the accuracy was
improved by more than 10% when the skip
connection was used. This is because the information
of each frame has been mixed up in the network.
Figure 7 shows the results of difference discovery
by our method without skip connection. In
comparison with Figure 5, the difference is
ambiguous. These results show that providing input
VISAPP 2022 - 17th International Conference on Computer Vision Theory and Applications
704

information to the feature map by skip connection is
effective for visualizing important frames.
5 CONCLUSION
This paper proposed the Integration-Net which
integrates different networks for classifying wild-
type and mutant sperm of liverwort. This allows
more accurate classification than conventional video
classification methods. We discover the difference
between the two types of sperm by using the gradients
of network. Our method discovered the difference of
the flagella automatically.
However, the heat map may be ambiguous or
blurry. Therefore, we would like to use visualization
methods that do not depend on gradient calculation
such as Score-CAM (Wang, H., Wang, Z., Du, M.,
Yang, F., Zhang, Z., Ding, S., Mardziel, P. & Hu, X.,
2020), or consider more detailed visualization
methods that refer to it.
In addition, we would like to use ConvLSTM
(Xingjian, S. H. I., Chen, Z., Wang, H., Yeung, D. Y.,
Wong, W. K., & Woo, W. C., 2015) to use motion
information effectively.
ACKNOWLEDGEMENT
This research is partially supported by JSPS
KAKENHI Grant Number 20H05427.
REFERENCES
Ji, S., Xu, W., Yang, M., & Yu, K., “3D convolutional
neural networks for human action recognition”, IEEE
Transactions on Pattern Analysis and Machine
Intelligence, Vol 35, pp. 221-231, 2013.
Dalal, N., Triggs, B., & Schmid, C., “Human detection
using oriented histograms of flow and appearance”, In
European Conference on Computer Vision, pp. 428-
441, 2006.
Selvaraju, R. R., Cogswell, M., Das, A., Vedantam, R.,
Parikh, D., & Batra, D., “Grad-CAM: Visual
explanations from deep networks via gradient-based
localization”, In IEEE International Conference on
Computer Vision, pp. 618-626, 2017.
Chattopadhay, A., Sarkar, A., Howlader, P., &
Balasubramanian, V. N., “Grad-cam++: Generalized
gradient-based visual explanations for deep
convolutional networks”, In IEEE Winter Conference
on Applications of Computer Vision, pp. 839-847, 2018.
Anderson, D. J., & Perona, P., “Toward a science of
computational ethology”, Neuron, Vol 84, pp.18-31,
2014.
Tran, D., Bourdev, L., Fergus, R., Torresani, L., & Paluri,
M. “Learning spatiotemporal features with 3d
convolutional networks”, In IEEE International
Conference on Computer Vision, pp. 4489-4497, 2015.
Springenberg, J. T., Dosovitskiy, A., Brox, T., &
Riedmiller, M., “Striving for simplicity: The all
convolutional net”, International Conference on
Learning Representations Workshops, 2015.
Zeiler, M. D., & Fergus, R., “Visualizing and understanding
convolutional networks”, In European Conference on
Computer Vision, pp. 818-833, 2014.
Ma, N., Zhang, X., & Sun, J., “Funnel activation for visual
recognition”, In European Conference on Computer
Vision, pp. 351-368, 2020.
Lin, T. Y., Goyal, P., Girshick, R., He, K., & Dollár, P.
“Focal loss for dense object detection”, In IEEE
International Conference on Computer Vision, pp.
2980-2988, 2017.
Hara, K., Kataoka, H., & Satoh, Y., “Learning spatio-
temporal features with 3d residual networks for action
recognition”, In Proceedings of the IEEE International
Conference on Computer Vision Workshops, pp. 3154-
3160, 2017.
Wang, H., Wang, Z., Du, M., Yang, F., Zhang, Z., Ding, S.,
Mardziel, P., & Hu, X., “Score-CAM: Score-weighted
visual explanations for convolutional neural networks”,
In IEEE Conference on Computer Vision and Pattern
Recognition Workshops, pp. 24-25, 2020.
Xingjian, S. H. I. Chen, Z., Wang, H., Yeung, D. Y., Wong,
W. K., & Woo, W. C., “Convolutional LSTM network:
A machine larning approach for precipitation
nowcasting”, In Advances in Neural Information
Processing Systems, pp. 802-810, 2015.
Classification and Analysis of Liverwort Sperm by Integration-Net
705
