
Integrated Label Transfer for Oligodendrocyte Subpopulation
Profiling in Parkinson’s Disease and Multiple System Atrophy
Erin Teeple
1
, Pooja Joshi
2
, Rahul Pande
1
, Yinyin Huang
1
, Akshat Karambe
1
,
Martine Latta-Mahieu
2
, S. Pablo Sardi
2
, Angel Cedazo-Minguez
2
, Katherine W. Klinger
1
,
Amilcar Flores-Morales
2
, Stephen L. Madden
1
, Deepak K. Rajpal
1
and Dinesh Kumar
1
1
Translational Sciences, Sanofi, Framingham, MA, U.S.A.
2
Neurological and Rare Diseases Therapeutic Area, Sanofi, Chilly-Mazarin, France
erin.teeple,@sanofi.com
Keywords: CCA, Data Integration, Seurat, Label Transfer, Synucleinopathy, Parkinson’s Disease, MSA.
Abstract: Transfer of cell type labels as part of the comprehensive integration of multiple single nucleus RNA
sequencing (snRNAseq) datasets offers a powerful tool for comparing cell populations and their activation
states in normal versus disease conditions. Another potential use for these methods is annotation alignments
between samples from different anatomic areas. This study describes and evaluates an integration analysis
applied for profiling of oligodendrocyte lineage nuclei sequenced from human brain putamen region tissue
samples for healthy Control (n = 3), Parkinson’s Disease (PD; n = 3) and Multiple System Atrophy (MSA; n
= 3) subjects with label transfer to substantia nigra region tissue samples for healthy Control (n = 5) subjects.
PD and MSA are both synucleinopathies, progressive neurodegenerative disorders characterized by nervous
system aggregates of α-synuclein, a protein encoded by the SNCA gene. Histologic findings and genetic
evidence suggest links between oligodendrocyte biology and synucleinopathy pathogenesis. In this work, we
first identify disease-associated changes among transcriptionally distinct oligodendrocyte subpopulations in
putamen. We then apply label transfer methods to generalize our findings from putamen to substantia nigra,
a brain region characteristically impacted in PD and variably affected in MSA. Interestingly, our analysis
predicts oligodendrocytes in substantia nigra include a significantly greater proportion of an oligodendrocyte
subpopulation identified in putamen as most highly overexpressing SNCA in PD. Our results provide new
insights into oligodendrocyte biology in PD and MSA and our workflow provides an example of label transfer
methods applied for cross-dataset exploratory purpose.
1 INTRODUCTION
Synucleinopathies are a group of progressive
neurodegenerative disorders characterized by
nervous system aggregates of α-synuclein protein
(Coon, Cutsforth-Gregory & Benarroch, 2018). PD is
the most common synucleinopathy and the second
most common chronic neurodegenerative disorder,
affecting 1% of the population over age 60 (Tysnes &
Storstein, 2017). MSA occurs at a much lower
frequency than PD and has an estimated incidence
rate of 0.6 per 100,000 people (Vanacore, Bonifati,
Fabbrini, et al., 2001). Intracellular inclusions of α-
synuclein are observed on post-mortem microscopic
exam of central nervous system tissue (CNS) in both
PD and MSA, but the cellular location of α-synuclein
and patterns of CNS involvement differ between the
disorders. In PD, α-synuclein aggregates are observed
mainly as neuronal intracellular collections (Lewy
bodies) (Spillantini, Schmidt, Lee, et al., 1997). In
MSA, in contrast, α-synuclein aggregates occur most
frequently as oligodendroglial cytoplasmic inclusions
(Inoue, Yagishita, Ryo, et al.,1997; Hague, Lento,
Morgello, et al. 1997). Death of neurons in the
substantia nigra pars compacta is particularly
characteristic of PD, with lesion involvement
progressing from the brainstem and midbrain to the
neocortex observed over the course of the disease
(Del Tredici & Braak, 2016). While striatonigral
degeneration occurs to varying degrees in MSA,
concurrent and more variable involvement of the
cerebellum and autonomic nervous system are further
clinical features in MSA (Inoue et al., 1997; Hague,
et al., 1997).
SNCA is the gene encoding α-synuclein, a 140
amino acid protein known to participate in vesicle
Teeple, E., Joshi, P., Pande, R., Huang, Y., Karambe, A., Latta-Mahieu, M., Sardi, S., Cedazo-Minguez, A., Klinger, K., Flores-Morales, A., Madden, S., Rajpal, D. and Kumar, D.
Integrated Label Transfer for Oligodendrocyte Subpopulation Profiling in Parkinson’s Disease and Multiple System Atrophy.
DOI: 10.5220/0010915400003123
In Proceedings of the 15th International Joint Conference on Biomedical Engineering Systems and Technologies (BIOSTEC 2022) - Volume 5: HEALTHINF, pages 219-227
ISBN: 978-989-758-552-4; ISSN: 2184-4305
Copyright
c
2022 by SCITEPRESS – Science and Technology Publications, Lda. All rights reserved
219

exocytosis, endocytosis, and neurotransmitter vesicle
cycling (Maroteaux, Campanelli, & Scheller, 1988).
Studies have also localized this protein to the cell
nucleus, where direct interaction with DNA and
histone proteins (Pinho, Paiva, Jercic, et al., 2019)
and modulation of DNA damage responses (Goers,
Manning-Bog, McCormack, et al. 2003) have been
reported. The complete spectrum of α-synuclein
activities and how this protein may contribute to the
development and progression of each of the
synucleinopathies are not fully understood.
Genome-wide association studies (GWAS) and
transcriptomic profiling of human brain tissue have
highlighted potential roles for glial cells in the
synucleinopathies, with particularly strong evidence
implicating oligodendrocyte biology in PD (Bryois,
Skene, Hansen, et al., 2020; Smajic, Prada-Medina,
Landoulis, et al., 2020; Nalls, Blauwendraat,
Vallerga, et al., 2019; Reynolds, Botia, Nalls, et al.,
2019). Inadequate metabolic support for neurons,
overactive stress and inflammatory response
signaling, and dysfunctional autophagy have been
suggested as mechanisms by which oligodendrocytes
might contribute to PD development (Teeple, Jindal,
Kiragasi, Annaldasula, et al., 2020; Bryois, et al.,
2020; Reynolds, et al., 2019). Oligodendrocyte-
specific differentially expressed genes have also been
linked with variants significantly associated with PD
risk by GWAS in analyses of snRNAseq data from
healthy human donor substantia nigra tissues
(Agarwal, Sando, Volpato, et al.,2020) and mouse
nervous system single-cell data (Bryois, et al., 2020).
The present analysis was undertaken in order to
further profile the relationship between midbrain
oligodendrocyte population heterogeneity and α-
synuclein biology as part of a comprehensive analysis
of PD and MSA snRNAseq data with label transfer
methodologies found in this analysis to reveal new
insights (Teeple, Joshi, Pande, Huang, et al., 2021).
1.1 Related Work
The development and ongoing refinement of single
nucleus RNA sequencing (snRNAseq) techniques
have greatly advanced our ability to understand the
heterogeneity and functional activities of cell
populations in the brain and nervous system. Cells are
the basic unit of the multicellular organism, but
although cells in the brain share DNA, each differs in
its transcriptional activities, epigenetic modifications,
and functions in and responses to its
microenvironment (Duran, Wei, & Wu, 2017).
Neuronal cells in the brain form densely
interconnected, diversified networks where structure
and cell functional activation states support and
coordinate dynamic and complex processes, for
example memory encoding, vision, and motor
coordination. Non-neuronal cell populations
intermixed in these cellular networks support
neuronal metabolism, facilitate signal transmission,
and modulate vascular flow and immune responses,
among many other activities (Duran et al., 2017).
Sequencing of nuclei in a tissue sample yields a
unique molecular identified (UMI) count matrix. This
matrix includes integer counts of the number of RNA
molecules for each feature (gene) identified in each
nucleus (one nucleus per cell). In the analysis of
snRNAseq data, variations in gene counts between
nuclei are used both to cluster cell types (by similar
patterns of gene expression in nuclei) as well as for
differential expression analysis where different cell
groups are compared with respect to their mean
expression of different genes. Pre-processing of
snRNAseq data includes initial filtering of UMI data
tables to remove low quality rows (ie those nuclei
with few counts or very many, which likely represent
data for empty droplets or multiplets, respectively)
and cells with very high percentages of mitochondrial
genes (Hao, Hao, Andersen-Nissen, et al., 2021).
These filtering steps are undertaken to ensure high
quality data are used for downstream analyses.
Variations in sequencing depth may result in
different numbers of molecules being detected in
different cells. Normalization of UMI count matrices
is therefore performed to address this technical
variability as a preprocessing step. Options for
normalization include log normalization of gene
expression measurements for each cell followed by
scale factor multiplication (Hao et al. 2021) as well as
an alternative method, sctransform, which takes
sequencing depth as a covariate in a generalized
linear model and yields the residuals of a regularized
negative binomial regression for use as effectively
normalized data (Hafemeister & Satija, 2019). The
sctransform modelling framework has been proposed
as a method by which to remove technical
characteristics from data while preserving cell-to-cell
biological heterogeneity.
In addition to technical effects, joint analysis of
multiple samples presents further challenges, as this
requires matching cell subpopulations across
datasets. Stuart et al. 2019 have proposed and
implemented a comprehensive strategy for
integration of single cell datasets (Stuart, Butler,
Hoffman, et al., 2019). Applying concepts from
statistical learning, their approach combines single
cell datasets through the application of canonical
correlation analysis (CCA) and mutual nearest
HEALTHINF 2022 - 15th International Conference on Health Informatics
220
neighbors profiling for the task of identifying
‘anchors’, pairwise correspondences of cell states
between datasets. These anchor correspondences,
once identified, are then used to transform multiple
UMI tables into a shared space for integrated
comparisons -- also the transformation derived from
creating an integrated reference can then be applied
to other query datasets for aligned comparisons.
Integrated reference datasets may be used to
transfer predicted cell type labels to a query sample,
efficiently labelling newly processed data. Another
possible use for these methods, however, is
exploration of research datasets to examine whether
cell transcriptomic states identified in one dataset
may resemble particular subpopulations in a query
data set. Here, we present such an analysis, using an
integrated reference constructed from Control, MSA,
and PD putamen data with Control substantia nigra
data as our query.
1.2 Problem Formulation and Aims
Clustering of integrated snRNAseq data is performed
after filtering, normalization, and integration. The
features (genes) in the integrated data with the highest
cell to cell variation are used for clustering. PCA is
performed on the subset of these highly variable
genes for dimension reduction, followed by
unsupervised clustering using optimization of a
modularity function for different parameter settings
to generate cluster solutions (Hao, et al., 2021).
Seurat version 4, the software package used in this
analysis, uses a graph-based clustering approach that
includes selection of a resolution parameter based on
stratification of cell-specific feature (gene
expression) markers among identified clusters. When
working with a single integrated dataset, cluster
identities can be assigned by feature differential
expression comparisons, with subsets of genes whose
expression is particular to certain clusters used for
annotation of cell types.
When clustering a single or integrated dataset,
feature expression patterns selected by the above
workflow for clustering (and the final cluster
solutions themselves) will depend on sample
composition. For example, analyzing an snRNAseq
dataset with many neurons and few other glial cell
types will result in the selection of highly variable
genes which differ among neurons as the most highly
variable features and clustering will likely separate
more neuron subclusters than other types. Using such
a neuron-predominant reference in a query dataset
without many neurons would have limitations, in that
the features selected for use in the transformation may
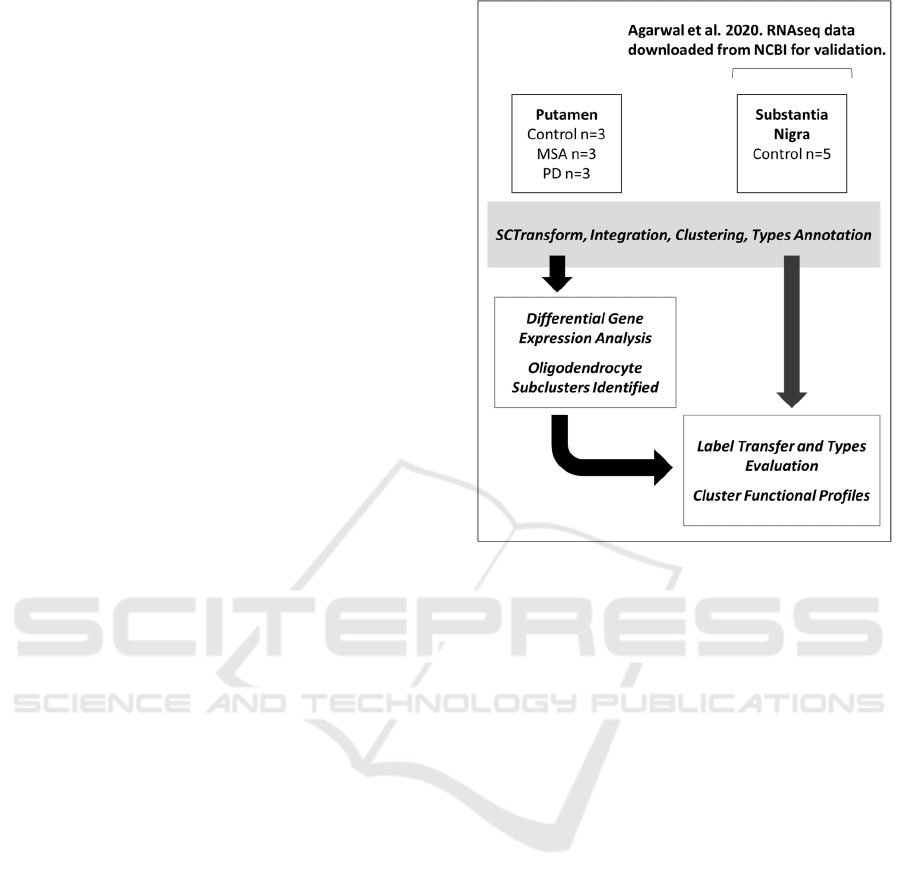
Figure 1: Data analysis workflow schematic.
not perform well for identifying non-neuronal cell
subpopulation clusters. Thus, an issue to consider
when using snRNAseq label transfer for exploratory
research as presented here is whether cell type
compositions may be similar. For profiling
oligodendrocytes in substantia nigra using a putamen
reference, then, a first step to be taken before
examining the results of label transfer is to assess the
generalizability of the reference to the query dataset.
Therefore, we include in this workflow an annotation
of nuclei population types for both putamen and
substantia nigra to first confirm that oligodendrocyte
nuclei are being broadly correctly identified by label
transfer predictions. We then explore the results of
label transfer among oligodendrocyte subpopulations
as the next stage of the analysis.
2 METHODS AND PROCEDURES
Post-mortem fresh-frozen unfixed human putamen
samples were each obtained through partnerships
with licensed organizations with completed pre-
mortem consent for donation and ethical committee
approval for sample acquisition and use (Teeple et al,
2021). Samples used for single-nucleus RNA
sequencing (snRNA-seq) were putamen tissue
sections from nine human donors (n =3 per group,
Integrated Label Transfer for Oligodendrocyte Subpopulation Profiling in Parkinson’s Disease and Multiple System Atrophy
221
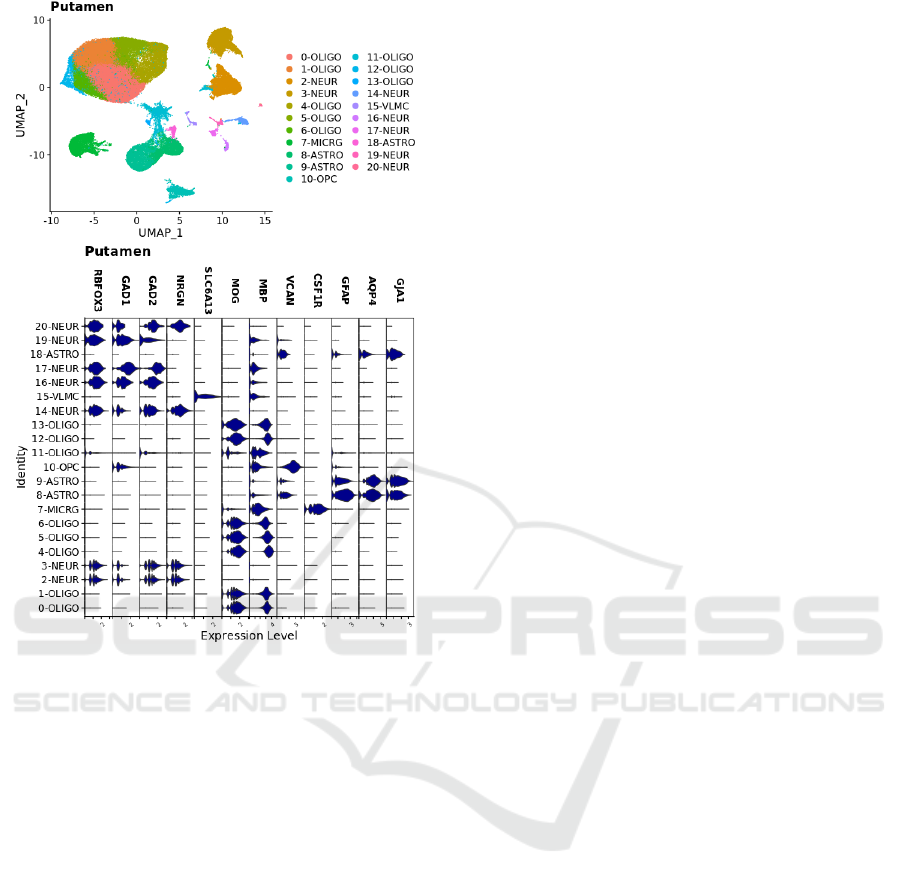
Figure 2: Putamen sample nuclei integrated and clustered.
Plots are UMAP of principle components coloured by
cluster identity. Expression levels for type-specific markers
are shown in violin plots by cluster.
mean age in years ± SD: Control, 78.7 ± 9.5; PD, 79.7
± 5.5; MSA, 65.0 ± 10.6).
Nuclei Isolation: Samples were stored at -80°C. For
tissue lysis and washing of nuclei, tissue sections
were added to 1 mL lysis buffer (Nuclei PURE lysis
buffer, Sigma) and thawed on ice. Samples were then
Dounce homogenized with PestleAx20 and
PestleBx20 before transfer to a new tube, with the
addition of additional lysis buffer. Following
incubation on ice for 15 minutes, samples were then
filtered using a 30 mM MACS strainer (MACS
strainer, Fisher Scientific), centrifuged at 500xg for 5
minutes at 4°C using a swinging bucket rotor (Sorvall
Legend RT, Thermo Fisher), and then pellets were
washed with an additional 1 mL cold lysis buffer and
incubated on ice for an additional 5 minutes. Samples
were then centrifugated at 500g for 5 minutes at 4°C
and then were resuspended in 1mL Nuclei PURE
Storage Buffer (Nuclei PURE storage buffer, Sigma).
Sample washing was performed until the supernatant
cleared. A final resuspension was then prepared in
0.6mL wash buffer before NeuN/Dapi staining and
FACS sorting was performed. For NeuN/Dapi and
FACS sorting, from 0.6 mL nuclei sample, 540 mL,
30 mL, and 30 mL were aliquoted into tubes for
sample and controls and then 10X Dapi/NeuN buffer
was added to tubes for a final 1X concentration.
Tubes were then incubated on ice for 30 minutes, with
inversion every 10 min. Following incubation,
samples were spun at 500xg for 5 min, supernatant
removed, and samples were resuspended in 600 ul
Wash buffer for samples (300 ul for control tubes).
Nuclei then underwent filtering and sorting using BD
Bioscience InFlux Cell Sorter.
Library Preparation and NovaSeq Sequencing:
Libraries were prepared according to 10xGenomics
protocol for Chromium Single Cell 3’ Gene
Expression V3 kit. NovaSeq sequencing was
performed according to illumine NovaSeq 6000
protocol. UMI count matrices generated by
Cellranger V3.0.2.
2.1 Sample Integration and Annotation
A workflow schematic for data integration and
analysis steps for putamen and substantia nigra
samples in shown in Fig. 1.
Putamen: Summary information for final UMI count
matrices for nuclei by individual samples together
with nucleus barcodes and gene labels were loaded
with R version 4.0.0/RStudio for sample integration
and unsupervised clustering using Seurat Package
version 4.0.1. For Quality Control (QC), nuclei were
filtered following standard protocols based on
examination of violin plots. Cutoffs 200 <
nFeature_RNA < 9000 and percent.mt < 5 were used.
Filtered matrices were individually normalized by
sample according to Seurat workflows for
SCTransfom. After quality filtering, 87,086 total
nuclei were included in the final dataset. Sample
integration was performed using the R package Seurat
using the FindIntegrationAnchors and IntegrateData
functions for 3000 variable features. Clustering
resolution 0.5 and 30 dimensions were used for the
final clustering. Broad type annotations were
assigned based on expression of canonical markers:
oligodendrocyte precursor cell (OPC; VCAN),
oligodendrocyte (OLIGO; MOG, MBP), neuron
(NEUR; RBFOX3, SNAP25, GAD1, GAD2,
NRGN), astrocyte (ASTRO; GFAP, AQP4, GJA1),
microglia (MICRG; CSF1R), and vascular
leptomeningeal cells (VLMC; SLC6A13). UMAP
HEALTHINF 2022 - 15th International Conference on Health Informatics
222
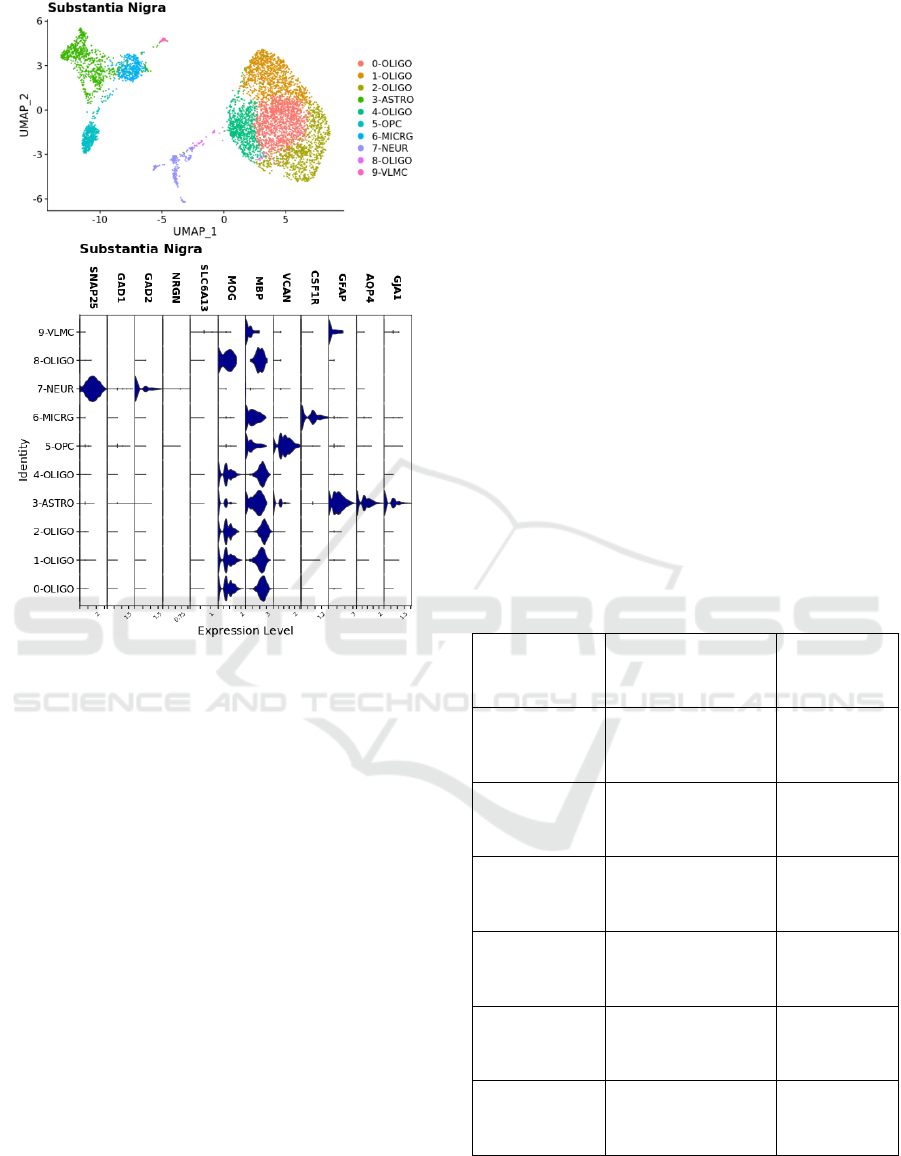
Figure 3: Substantia nigra sample nuclei integrated and
clustered. Plots are UMAP of principle components
coloured by cluster identity. Expression levels for type-
specific markers are shown in violin plots by cluster.
plots for cluster assignments together with violin
plots for expression of broad types markers, and types
annotations are shown in Fig. 2.
Substantia Nigra: Data was downloaded from
supplementary files from Agarwal et al. 2020 for
substantia nigra samples (5943 nuclei) obtained from
five human donors and sequenced using the 10x
Genomics Chromium Platform (Agarwal, et al.,
2020). These files are accessible online through the
NCBI interface: https://www.ncbi.nlm.nih.gov/geo/
query/acc.cgi?acc=GSE140231. Integration and
broad cell type annotations were performed for
Substantia Nigra data separately in R using the Seurat
package, version 4.0.1. A similar workflow as for
putamen samples was followed. Pre-processing cut-
offs were selected based on initial QC plots: 200<
nFeatureRNA < 7500 and percent.mt<5. Data were
normalized at the individual sample level using
SCTransform and then integrated using
FindIntegrationAnchors and IntegrateData as
described in the Seurat data integration workflow
with 3000 variable features and cluster resolution 0.5.
The number of PCs used for clustering (n = 30) was
chosen to optimize separation between clusters.
Broad cell types were assigned for each cluster based
on marker expression levels as for putamen (Fig. 3).
2.2 Differential Gene Expression
Differentially expressed genes for PD versus Control
and MSA versus Control were identified within each
cluster using the Seurat FindMarkers() function and
the MAST package (Finak, McDaid, Yajima, et al.,
2015) for differential gene expression analysis
comparisons. Pathway enrichment analysis for
differentially expressed genes was performed using
Qiagen Ingenuity Pathway Analysis (IPA) software
(Kramer, Green, Pollard, & Tugendreich, 2014) using
adjusted p-value<0.05 and abs(log2 fold change)
cutoff 0.35. For identification of cluster marker
genes, FindMarkers was used with the MAST
package for the comparison of the selected cluster
versus all other nuclei. Functional enrichments for
markers were queried using the Enrichr platform
(Xie, Bailey, Kuleshov, et al., 2021).
Table 1: Broad Cell Types Proportions.
Cell Type
Tissue Source -
Condition
Mean
Proportion ±
Standard
Deviation
Oligodendrocyte Putamen - Control
Putamen – PD
Putamen - MSA
Subst. Nigra - Control
66.5±14.3
64.2±24.5
64.6±13.2
63.8±16.9
Neuron Putamen - Control
Putamen – PD
Putamen - MSA
Subst. Nigra - Control
14.5±6.6
13.9±14.8
18.7±12.1
5.5±5.5
Astrocyte Putamen - Control
Putamen – PD
Putamen - MSA
Subst. Nigra - Control
9.4±5.9
12.6±7.4
7.4±1.4
16.0±8.6
Microglia Putamen - Control
Putamen – PD
Putamen - MSA
Subst. Nigra - Control
4.1±0.8
6.3±2.1
4.8±1.2
5.4±3.7
OPC Putamen - Control
Putamen – PD
Putamen - MSA
Subst. Nigra - Control
5.1±1.6
2.4±0.3
3.8±1.5
8.4±4.5
VLMC Putamen - Control
Putamen – PD
Putamen - MSA
Subst. Nigra - Control
0.4±0.4
0.7±0.5
0.7±0.5
0.9±0.4
Integrated Label Transfer for Oligodendrocyte Subpopulation Profiling in Parkinson’s Disease and Multiple System Atrophy
223
2.3 Label Transfer
Label transfer was performed in Seurat using the
FindTransferAnchors and TransferData functions to
predict substantia nigra nuclei type for broad cell
types and subpopulation clusters as identified in
putamen reference samples. Accuracy of broad types
classifications was calculated using annotations made
for the substantia nigra dataset as ground truth. To
examine which cluster markers identify
oligodendrocytes in the 4-OLIGO subcluster, the
function FindMarkers, using MAST for differential
expression testing, was applied for cluster 4-OLIGO
in Control putamen samples and for nuclei predicted
to belong to 4-OLIGO in Control substantia nigra in
comparison to all other sample nuclei.
3 RESULTS
3.1 Broad Cell Types
After quality filtering, nuclei from human putamen
tissue samples included Control (n = 3 donors; 22,297
nuclei), PD (n = 3 donors; 32,301 nuclei), and MSA
(n = 3 donors; 32,488 nuclei). Data for nuclei from
substantia nigra were Control (n = 5 donors; 6,018
nuclei). For both putamen and substantia nigra
samples, oligodendrocytes were found to be the
dominant cell type. Table 1 presents a summary of
broad cell types proportions for each tissue type and
condition.
3.2 Oligodendrocytes in Putamen
Unsupervised clustering of integrated putamen
sample data identified eight oligodendrocyte clusters
from their transcriptomic features. Pathway
enrichment analysis for differentially expressed
genes in PD versus Control oligodendrocyte nuclei
and MSA versus Control oligodendrocyte nuclei
revealed differences in gene expression changes
between PD and MSA. In IPA comparison pathway
enrichment analysis, more prominent differences in
expression of genes linked with unfolded protein
responses and stress signalling were observed in PD
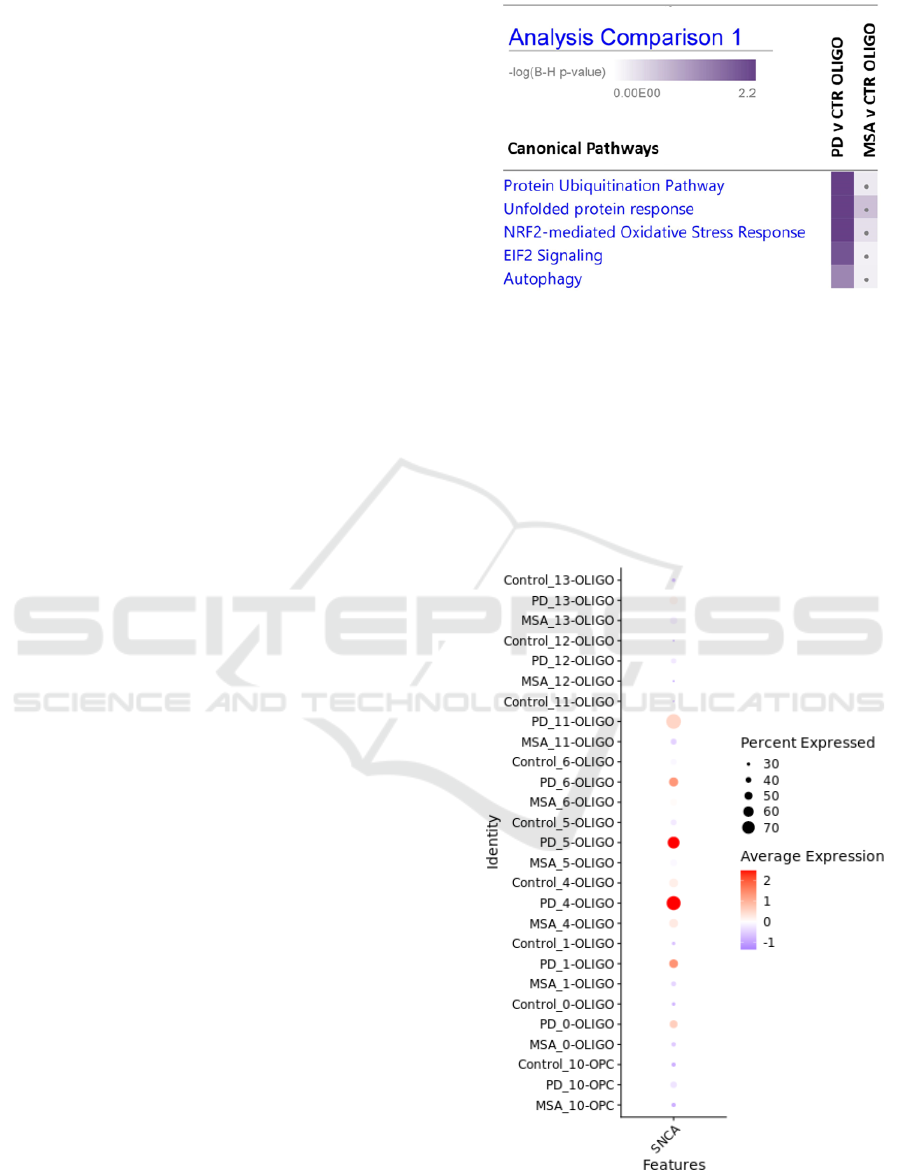
oligodendrocytes (Fig. 4). SNCA expression among
cell clusters was also compared, revealing
oligodendrocyte clusters 4-OLIGO and 5-OLIGO as
subpopulations with the most pronounced increases
in SNCA expression in PD while this expression
pattern was absent in MSA and in Control
oligodendrocytes (Fig. 5).
Figure 4: Pathway enrichments for oligodendrocyte nuclei
differentially expressed genes. (grey dot: p-adj>0.05).
3.3 Predicted Cell Types
Using profiled putamen nuclei as a reference, the
accuracy of oligodendrocyte nuclei classification by
label transfer for substantia nigra oligodendrocytes
was 98%. A summary of accuracy across all cell types
is shown in Fig. 6. Prediction of oligodendrocyte
subtypes was then performed, which was found to
Figure 5: Comparative proportions and average expression
of SNCA in oligodendrocyte lineage clusters.
HEALTHINF 2022 - 15th International Conference on Health Informatics
224
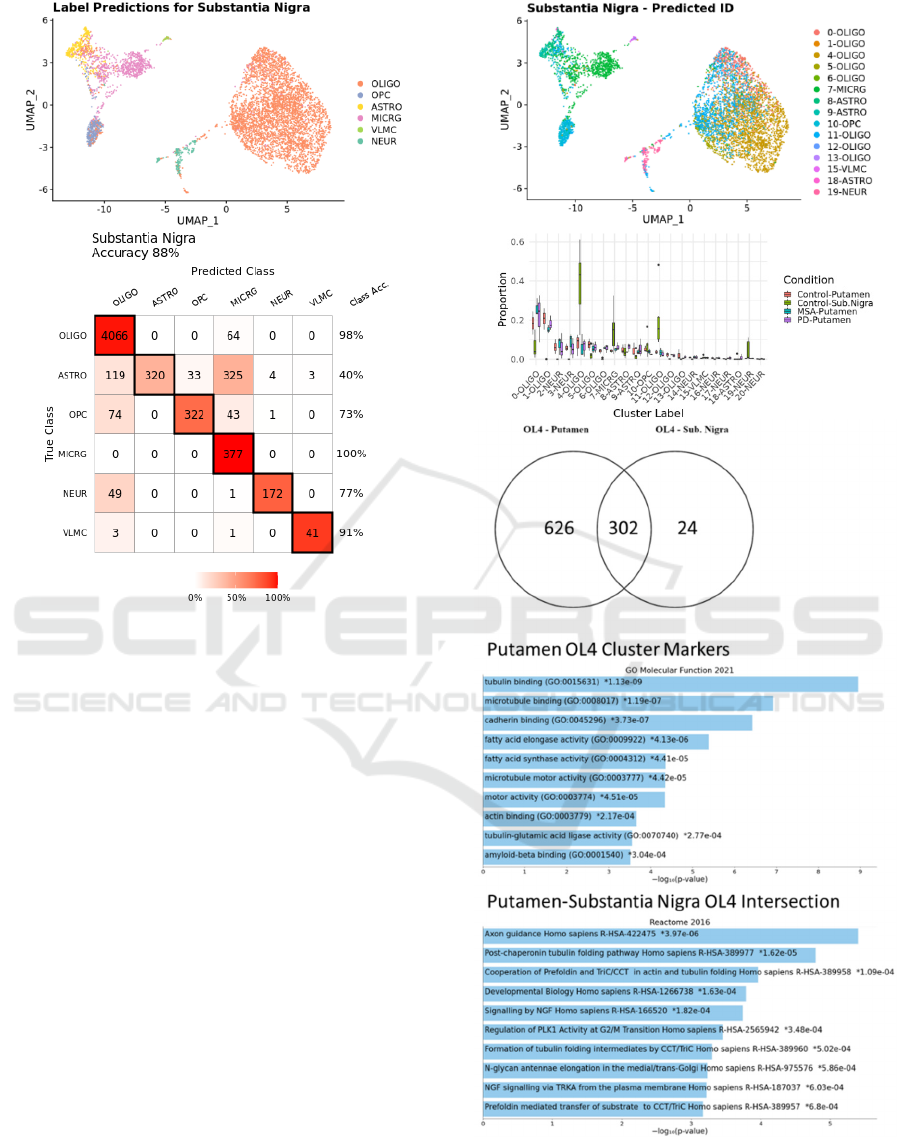
Figure 6: Prediction of broad cell types from putamen
reference and confusion matrix with class accuracies.
identify a greater than expected number of
oligodendrocytes as the 4-OLIGO type. Predicted
subpopulations are identified in label transfer based
on similarities in gene expression patterns, and these
gene expression patterns may be functionally
annotated by gene set enrichment analysis relative to
pathway and function annotation references. Marker
genes are genes differentially expressed within a
cluster relative to alll other nuclei. We compared
cluster markers for 4-OLIGO nuclei in putamen with
marker genes for the predicted 4-OLIGO subcluster
of substantia nigra. Remarkably, 302 genes were
identified as shared markers for both the 4-OLIGO
cluster in putamen and the predicted 4-OLIGO nuclei
in substantia nigra. Functional enrichments for the
putamen 4-OLIGO gene set and the common gene
markers for predicted cluster nuclei are shown in Fig.
7. Prominent among these enriched pathways and
functions are microtubule binding and folding.
Figure 7: Predictions shown in UMAP project and predicted
nuclei population proportions. Overlap of markers for 4-
OLIGO cluster and functional enrichments.
Integrated Label Transfer for Oligodendrocyte Subpopulation Profiling in Parkinson’s Disease and Multiple System Atrophy
225

4 CONCLUSIONS
Recent methods developed for single cell and single
nucleus sequencing have enabled more
comprehensive studies and profiling of
oligodendrocytes in different brain diseases (Agarwal
et al., 2020; Smajic, et al., 2020; Jakel, Agirre, Falcao,
et al., 2019) as well provided new avenues for
exploratory and comparative analyses. In this study,
we apply label transfer methods to generalize our
disease versus control putamen region comparisons to
another brain region to newly identify an expanded
subpopulation of transcriptionally similar nuclei in
substantia nigra. While we observe a greater
predicted proportion of an oligodendrocyte subtype in
substantia nigra which is identified as overexpressing
SNCA in PD in putamen, it remains to be further
understood how functional activities in
oligodendrocyte subpopulations relate to α-synuclein
biology and synucleinopathy disease processes.
Oligodendroglial cytoplasmic inclusions of α -
synuclein protein are described as the predominant
neuropathological finding in MSA; neuronal α -
synuclein aggregates are described as being more
prominent in PD, although varying degrees of
neuronal and oligodendroglial involvement are
reported in both disorders (Jellinger, 2018;
Henderson, Trojanowski, & Lee, 2019. Gillman,
Wenning, Low, et al., 2008). SNCA mutations,
duplications, and triplications have been causally
linked with familial PD in multiple studies (Ibanez,
Bonnet, Debarges, et al., 2004; Polymeropoulos,
Lavedan, Leroy, et al., 1997; Singleton, Farrer,
Johnson, et al., 2003). While genetic variants within
the SNCA locus have also been associated with MSA
in a few studies (Scholz, Houlden, Schulte, et al.,
2009; Kiely, Asi, Kara, et al., 2013), the connection
between SNCA overexpression in oligodendrocytes
and MSA is less clear. Cell-to-cell transmission of
highly pathogenic misfolded α-synuclein proteins
from neurons to oligodendrocytes has been
hypothesized as one potential explanation for the
prominent oligodendroglial inclusions observed in
MSA (Peng, Gathagan, Covell, et al., 2018). Our
observation of lower levels of oligodendrocyte SNCA
expression in MSA versus PD may lend some further
support to this theory. Yet it remains to be further
explored how increased SNCA expression in
oligodendrocytes may relate to PD pathogenesis and
how disease mechanisms may vary between PD,
MSA, and other synucleinopathies.
Our observation of different oligodendrocyte
transcriptional changes suggests that PD and MSA,
while both synucleinopathies, may differ in their
pathological mechanisms. Future work, including the
analysis of greater numbers of patient samples is
needed to verify and generalize our observations. In
addition, further studies are needed to examine how
gene expression changes relate to protein levels by
orthogonal analytic methods. The oligodendrocyte
subpopulations profiled here exhibit distinctive
functional activities which may offer promising
therapeutic targets for these debilitating and often
lethal diseases.
ACKNOWLEDGEMENTS
We thank Dr. Srinivas Shankara for critical review
and insightful feedback on this paper.
This work was supported by Sanofi. E.T., P.J., R.P.,
Y.H., A.K., M.L.M., S.P.S., A.C.M., K.W.K.,
A.F.M., S.L.M., D.K.R., and D.K. are employees of
Sanofi and may hold shares and/or stock options in
the company.
REFERENCES
Coon, E.A., Cutsforth-Gregory, J.K. Benarroch, E.E.
(2018). Neuropathology of autonomic dysfunction in
the synucleinopathies. Movement Disorders, 33(3):
349-58.
Tysnes, O., Storstein, A. (2017). Epidemiology of
Parkinson’s disease. Journal of Neural Transmission,
124: 901-5.
Vanacore, N. Bonifati, V., Fabbrini, G., Colosimo, C., et.
al. (2001). Epidemiology of multiple system atrophy.
ESGAP Consortium. European Study Group on
Atypical Parkinsonisms. Neurol Sci., 22(1): 97-9.
Spillantini, MG, Schmidt, ML, Lee, VM, Trojanowski JQ,
Jakes, R, Goedert, M. (1997). Alpha-synuclein in Lewy
bodies. Nature, 388(6645):839-40.
Inoue, M., Yagishita, S., Ryo, M., Hasegawa, K., Amano,
N., Matsushita, M. (1997). The distribution and
dynamic density of oligodendroglial cytoplasmic
inclusions (GCIs) in multiple system atrophy: a
correlation between the density of GCIs and the degree
of involvement of striatonigral and
olivopontocerebellar systems. Acta Neuropathol,
93(6):585-91.
Hague, K., Lento, P., Morgello, S., Caro, S., Kaufmann, H.
(1997). The distribution of Lewy bodies in pure
autonomic failure: autopsy findings and review of the
literature. Acta Neuropathol, 94(2):192-6.
Del Tredici, K., Braak, H. (2016). Review: Sporadic
Parkinson's disease: development and distribution of α-
synuclein pathology. Neuropathol Appl Neurobiol.
42(1):33-50.
Maroteaux, L., Campanelli, J.T., Scheller, R.H. (1988).
Synuclein: a neuron-specific protein localized to the
HEALTHINF 2022 - 15th International Conference on Health Informatics
226

nucleus and presynaptic nerve terminal. J Neurosci,
8(8):2804-15.
Pinho, R., Paiva, I., Jercic, K.G., Fonseca-Ornelas, L., et al.
(2019). Nuclear localization and phosphorylation
modulate pathological effects of alpha-synuclein. Hum
Mol Genet, 28(1):31-50.
Goers, J., Manning-Bog, A.B., McCormack, A.L., Millett
I.S., et al. (2003). Nuclear localization of alpha-
synuclein and its interaction with histones.
Biochemistry. 22;42(28):8465-71.
Bryois, J., Skene, N.G., Hansen, T.F., Kogelman, L.J.A., et
al., Genetic identification of cell types underlying brain
complex traits yields insights into the etiology of
Parkinson's disease. Nat Genet, 2020. 52(5): p. 482-
493.
Smajić, S., Prada-Medina, C.A.., Landoulis, Z.., Dietrich,
C., et al., (2020). Single-cell sequencing of the human
midbrain reveals glial activation and a neuronal state
specific to Parkinson’s disease. medRxiv. (pre-review)
Nalls, M.A., Blauwendraat, C., Vallerga, C.L., Heilbron,
K., et al. (2019). Identification of novel risk loci, causal
insights, and heritable risk for Parkinson's disease: a
metaanalysis of genome-wide association studies.
Lancet Neurol., 18(12):1091-102.
Reynolds, R.H., Botia, J., Nalls, M.A., et al. (2019).
Moving beyond neurons: the role of cell type-specific
gene regulation in Parkinson's disease heritability. NPJ
Parkinsons Dis, 5:6.
Teeple, E., Jindal, K., Kiragasi, B., Annaldasula, S., et al.,
(2020). Network Analysis and Human Single Cell
Brain Transcriptomics Reveal Novel Aspects of Alpha-
Synuclein (SNCA) Biology. BioRxiv. (pre-review).
Agarwal, D., Sando, C., Volpato, V., Caffrey, T.M., et al.,
(2020). A single-cell atlas of the human substantia nigra
reveals cell-specific pathways associated with
neurological disorders. Nat Commun, 11(1): 4183.
Teeple, E., Joshi, P., Pande, R., Huang, Y. et al., (2021).
Single Nuclei Sequencing of Human Putamen
Oligodendrocytes Reveals Altered Heterogeneity and
Disease-Associated Changes in Parkinson’s Disease
and Multiple System Atrophy. BioRxiv (pre-review).
Duran, R.C.D., Wei, H., Wu, J.Q. (2017). Single cell RNA
sequencing of the brain. Clinical and Translational
Medicine, 6:20. DOI 10.1186/s40169-017-0150-9.
Hao, Y., Hao, S., Andersen-Nissen, E., Mauck, W.M., et al.
(2021). Integrated analysis of multimodal single-cell
data, Cell, 184(13): 3573-87.
Hafemeister, C., Satija, R. (2019). Normalization and
variance stabilization of single-cell RNA-seq data using
regularized negative binomial regression. Genome Biol,
20: 296.
Stuart, T., Butler, A., Hoffman, P., Hafemeister, C., et al.
(2019). Comprehensive Integration of Single-Cell Data.
Cell, 13:177(7):1888-1902.e21.
Finak, G., McDavid, A., Yajima, M., Deng, J., et al., (2015).
MAST: a flexible statistical framework for assessing
transcriptional changes and characterizing
heterogeneity in single-cell RNA sequencing data.
Genome Biol, 16:278.
Kramer, A., Green, J., Pollard, J., Tugendreich, S. (2014).
Causal analysis approaches in Ingenuity Pathway
Analysis. Bioinformatics, 30(4):523-30.
Xie, Z., Bailey, A., Kuleshov, M.V., Clarke, D.J.B., et al.
(2021). Gene set knowledge discovery with Enrichr.
Current Protocols, 1: e90.
Jakel, S., Agirre, E., Falcao, A.M., van Bruggan, D., et al.,
(2019). Altered human oligodendrocyte heterogeneity
in multiple sclerosis. Nature, 566(7745): 543-547.
Jellinger, K.A. (2018). Multiple System Atrophy: an
oligodendroglialsynucleinopathy. J Alzheimers Dis,
62(3):1141-1179.
Henderson, M.X., Trojanowski, J.Q., Lee, V.M. (2019).
alpha-Synuclein pathology in Parkinson's disease and
related alpha-synucleinopathies. Neurosci Lett, 709:
134316.
Gilman, S., Wenning, G.K., Low, P.A., Brooks, D.J., et al.
(2008). Second consensus statement on the diagnosis of
multiple system atrophy. Neurology, 71(9): 670-6.
Ibanez, P., Bonnet, A.M., Debarges, B., Lohmann, E., et al.
(2004). Causal relation between alpha-synuclein gene
duplication and familial Parkinson's disease. Lancet,
364(9440): 1169-71.
Polymeropoulos, M.H., Lavedan, C., Leroy, E., Ide, S.E., et
al. (1997). Mutation in the alpha-synuclein gene
identified in families with Parkinson's disease. Science,
276(5321): 2045-7.
Singleton, A.B., Farrer, M., Johnson, J., Singleton, A., et
al., (2003). alpha-Synuclein locus triplication causes
Parkinson's disease. Science, 302(5646): 841.
Scholz, S.W., Houlden, H., Schulte, C., Sharma, M., et al.
(2009). SNCA variants are associated with increased
risk for multiple system atrophy. Ann Neurol, 65(5):
610-4.
Kiely, A.P., Asi, Y.T., Kara, E. Limousin, P., et al. (2013).
alpha-Synucleinopathy associated with G51D SNCA
mutation: a link between Parkinson's disease and
multiple system atrophy? Acta Neuropathol, 125(5):
753-69.
Peng, C., Gathagan, R.J., Covell, D.J., Medellin, C., et al.
(2018). Cellular milieu imparts distinct pathological
alpha-synuclein strains in alpha-synucleinopathies.
Nature, 557(7706): 558-563.
Integrated Label Transfer for Oligodendrocyte Subpopulation Profiling in Parkinson’s Disease and Multiple System Atrophy
227
