
AMI: Attention based Adaptative Feedback with Augmented Reality to
Improve Takeover Performances in Highly Automated Vehicles
Baptiste Wojtkowski
1
, Indira Thouvenin
1
and Veronica Teichrieb
2
1
Universit
´
e de Technologie de Compi
`
egne, CNRS UMR 7253, Heudiasyc, Compi
`
egne, France
2
Voxar Labs - Center of Informatics, Federal University of Pernambuco, Pernambuco, Brazil
Keywords:
Augmented Reality, Takeover, Adaptation Model.
Abstract:
In the coming decade, the level 3 of semi-autonomous vehicles on the SAE scale is set to develop. However,
the question of the transition of control between human and vehicle remains a widely debated question. From
a cognitive point of view, this operation consists of placing the user back in a sensorimotor loop while limiting
cognitive overload. In order to reduce this, several augmented reality / mixed reality approaches have been
carried out. In this preliminary study, we propose an approach based on adaptive feedback. A naive adaptation
model based on the work of Herzberger is introduced, studying the behavior of the user through his head
behavior to determine an attention level.
We carried out an experiment in a driving simulator reproducing a highway in virtual reality and displaying
AR feedback through the virtual environment. The experiment tends to show that users perform better when
they are placed in front of adaptive feedback. In a future work, we plan to complicate this model.
1 INTRODUCTION
1.1 Transition of Control in Highly
Automated Vehicle (HAV)
The vehicle automation scale defined by the SAE ref-
erences five levels of automation. Level 3 vehicles
on this scale alternate periods of autonomous driving
with periods of manual driving. Several taxonomies
of takeover have been proposed in the literature (Radl-
mayr et al., 2014). In our study, we will focus on the
transition of control from the HAV to the driver when
initiated by the automation system (Lu and de Winter,
2015).
While this transition appears in the literature in
different cases, three of them require particular be-
haviors from the driver: the takeover due to roadwork
(Hayashi et al., 2019), the one due to technical fail-
ure, and the one due to ambiguous marking (Sportillo
et al., 2018). These processes involve notions of vehi-
cle control and situation awareness. In order to allow
the driver to quickly regain awareness of the situa-
tion, several interfaces have already been developed
but the issue of interfaces design for the takeover is
still a burning question. In this study, we focus our-
selves within the framework of interfaces known as
”automation interfaces” based on K. Bengler (Bengler
et al., 2020) theory. The driver’s situation awareness
is widely determined, in this theory, by his attention
level. Getting a model of one’s attention is therefore
the first step to direct it to the salient points of a situ-
ation and to guarantee a sufficient level of awareness.
1.2 Mesuring Driver’s Readiness to
Takeover
Some studies assess a user’s performance evaluating
their behavior before regaining control. Indeed, the
approaches aiming to study the behavior of the ve-
hicle (Phan et al., 2014) cannot be used during the
automation phase. Vehicle behaviors are therefore
used in experiments to highlight user performance via
a posteriori statistical analyzes (Gold et al., 2016).
Therefore, we must concentrate on the action of the
driver while it is engaged in a Non-Driving Related
Task (NDRT). A majority of studies propose to focus
on driver’s gaze behavior to predict his performance
in a takeover (Zeeb et al., 2015). Results show that the
takeover success rate is linked with visual behavior.
We also note that visual NDRT has more impact on
performance than auditory NDRT (Merat et al., 2012)
(Merat et al., 2014) An interesting model for evaluat-
Wojtkowski, B., Thouvenin, I. and Teichrieb, V.
AMI: Attention based Adaptative Feedback with Augmented Reality to Improve Takeover Performances in Highly Automated Vehicles.
DOI: 10.5220/0010914400003124
In Proceedings of the 17th International Joint Conference on Computer Vision, Imaging and Computer Graphics Theory and Applications (VISIGRAPP 2022) - Volume 2: HUCAPP, pages
99-107
ISBN: 978-989-758-555-5; ISSN: 2184-4321
Copyright
c
2022 by SCITEPRESS – Science and Technology Publications, Lda. All rights reserved
99

ing driver attention has been proposed by (Herzberger
et al., 2018) Authors estimate that visual fixation time
on the road is a good indicator of a driver’s ability to
takeover. Others suggest looking at the full body be-
havior of a user by studying not only his gaze, but also
the position of his limbs and the attitude of his face.
(Deo and Trivedi, 2020). It is therefore currently pos-
sible to determine the driver’s attention level. That is
why we propose to base our adaptive augmented real-
ity feedback on this estimation.
1.3 Mesuring Performances of Takeover
The evaluation of a takeover of a vehicle is carried
out on the basis of various factors such as the type of
behavior (braking, cornering, no particular reaction),
the fluidity of the trajectory (determined by the maxi-
mum angle and maximum acceleration). To measure
the interest of devices of this kind we used standard-
ized questionnaires like the NASA-TLX(Hart, 1998)
to measure the mental load induced by a task and to
detect cognitive overload (Eriksson et al., 2019)(Lin-
demann et al., 2019). In this study, we will seek to im-
prove these indicators through the use of an adaptive
system. The adaptive system, by avoiding overload-
ing the user with unnecessary information, should re-
duce the mental load and improve performance.
1.4 Augmented Reality for the Takeover
in Autonomous Vehicle
Using Augmented reality with head up display inter-
faces (HUD) generally improve takeover performance
compared to classical HUD (Langlois and Soualmi,
2016). But in some cases such as quick longitudi-
nal reactions, it may not be relevant(Lindemann et al.,
2019). Researchers have also determined the opti-
mal locations for information on a HUD thanks to an
approach based on the psychological theory of prox-
emics. Data should be displayed at different distances
and angles depending on their nature (personal, au-
tomation...)(Haeuslschmid et al., 2016). Information
should rather be displayed as explanation of actions
allowed by the environment rather than highlighting
the danger(Lorenz et al., 2014). It has also been
shown that the interaction feedback for taking back
control should allow the user to quickly envision pos-
sible scenarios in order to evaluate and implement
them on their own (Eriksson et al., 2019) based on the
taxonomy introduced by Endsley and Sheridan (Ends-
ley, 1999) according to which any task can be divided
into four processing levels: ”Monitoring”, ”Genera-
tion”, ”Choice” and ”Implementation”. They suggest
both feedback of the carpet and the red line (see figure
1), indicating to the user whether or he can overtake
or not. In this study the control takeover interfaces
seek to improve the driver’s level of attention with-
out trying to measure it. However, as far as we know,
there are not any model allowing an augmented re-
ality interface taking into account the driver’s level
of attention. In this study, we propose a new model
of adaptation based on an attention estimation and a
feedback displayed to the driver. This model is vali-
dated in a virtual reality simulator on a group of sub-
jects. We will present in part 2 the model proposed to
answer this, and in part 3, we will present the exper-
iment lead to study this model. Then, in part 4 and 5
we will present the results and our conclusions.
2 PROPOSED MODEL
We first propose a simple adaptation model called
AMI (Adaptive attention Model for human vehicle In-
teraction) in order to explore its effectiveness. This
model is described in figure 2. It consists of an atten-
tion model, an adaptation model and visual feedback
from the literature that we will describe individually
in the following sub-parts.
2.1 Attention Model
Herzberger considers that attention is proportional to
the staring time of an element of the road (Herzberger
et al., 2018). We used his modeling named ARI for
our adaptation model. ARI can be described as
ARI(t) =
t
∑
k=t−N
1
f
(k) · θ
1
+ (1 − 1
f
(k) · θ
2
θ
1
and θ
2
are the coefficients of contribution of
the gaze and the absence of gaze of the road, 1
f
the
indicator function of the set of points verifying the
assertion ”the user is looking at the road’, and N the
size of the sliding window.
Thus, we outlined the gaze’s scope area corre-
sponding to the situations in which the driver is look-
ing at the road. In real time, the behavior of the head
was recorded at a frequency of 10Hz on a sliding win-
dow of 10 seconds and we established the relation be-
tween the number of points corresponding to the zone
and the others.
We have taken the parameters of Herzberger’s ex-
periment with θ
1
= −θ
2
= 0.05 and N = 200.
We determined the area of interest by asking a
subject to stare at road and mirrors and collection the
corresponding directions.
HUCAPP 2022 - 6th International Conference on Human Computer Interaction Theory and Applications
100
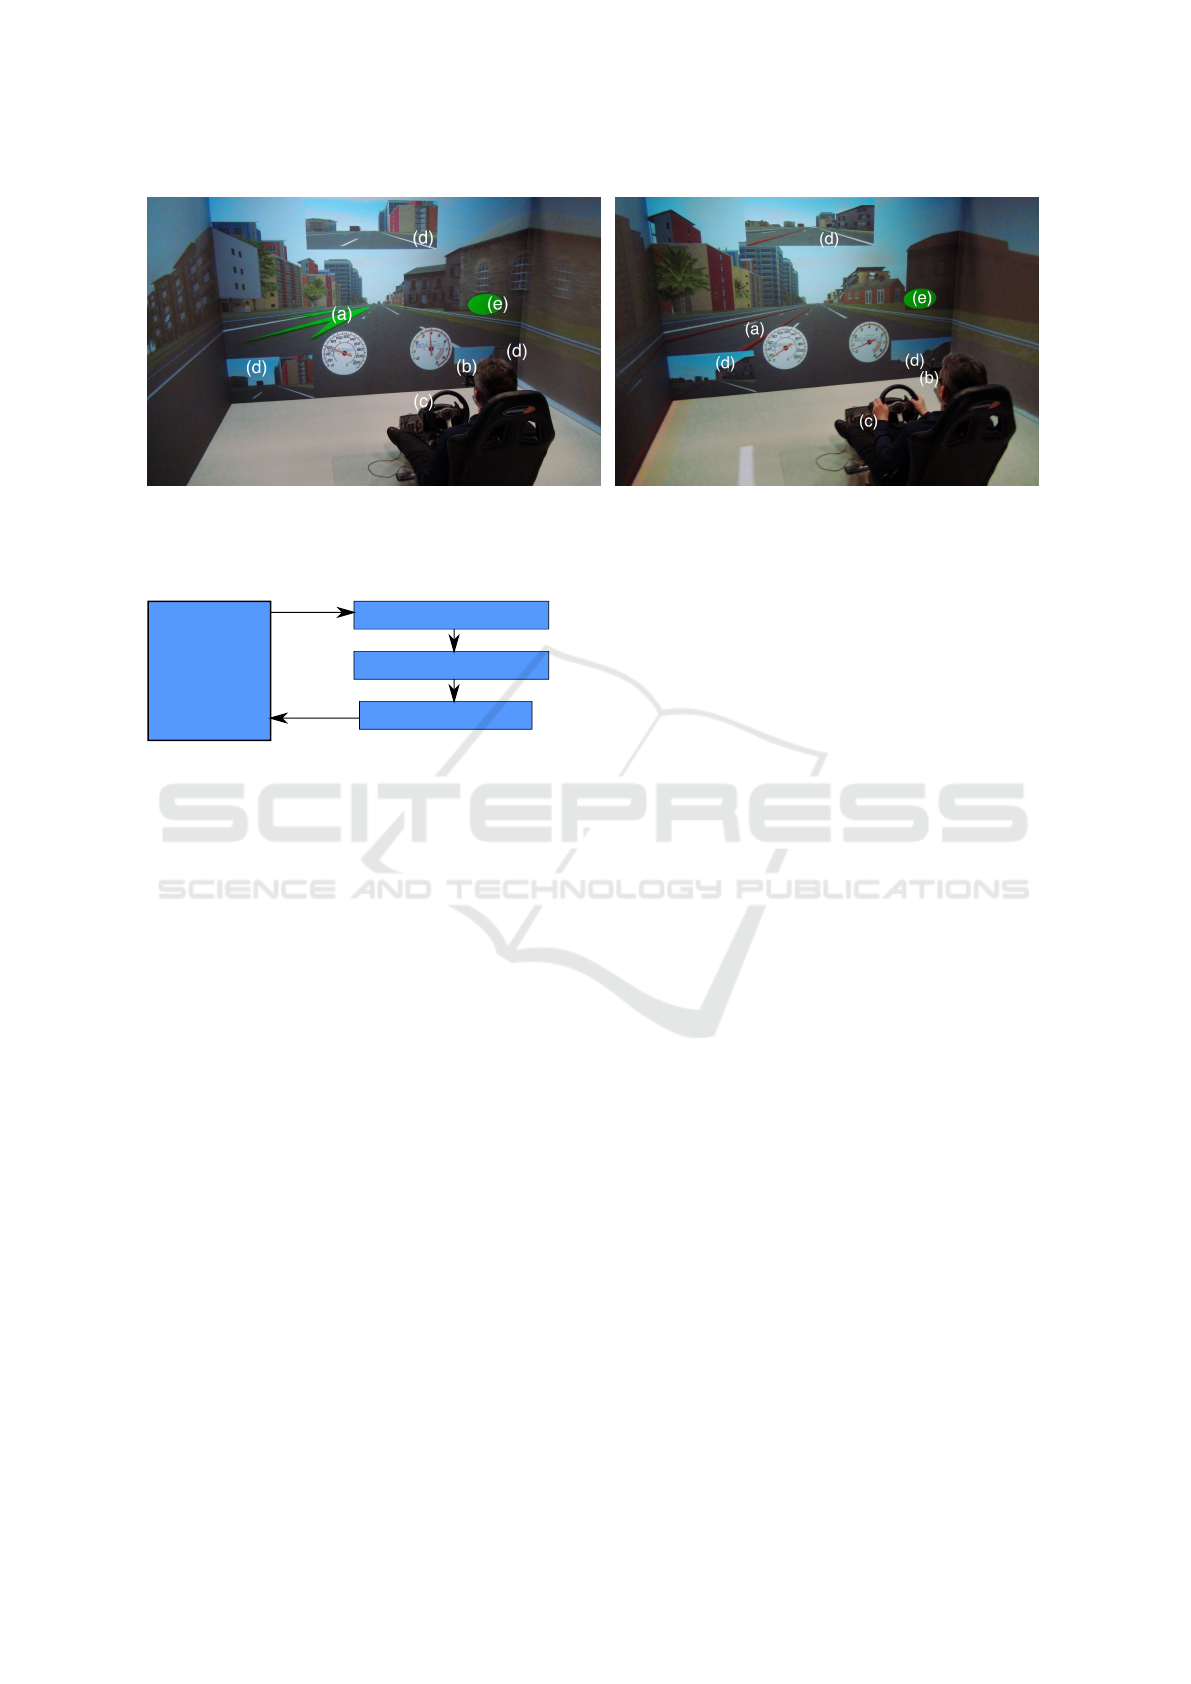
(a) Green carpet implementation (b) Red line feedback implementation
Figure 1: Eriksson’s feedback as implemented in our simulator. (a) carpet/red line feedback, (b) tracking glasses, (c) steering
and pedals, (d) mirrors, (e) automation system state indicator.
Driver
Attention Model
Adaptation model
Visual feedback
Gaze data
ARI
Feedback decision
Visual Information
Figure 2: The AMI model.
2.2 3D Feedback
To allow the transfer of information through 3D in-
teractions, we have implemented in our simulator
feedback similar to those of Eriksson(Eriksson et al.,
2019), the feedback of the carpet and the red line as
described in figure 1.
2.3 Adaptation Model
The authors of the ARI study considered that a road
sign could be missed as soon as the ARI was less than
0.33. So in this naive model, when the ARI was less
than 0.33 we were using augmented reality feedback,
otherwise the user wasn’t helped.
3 EXPERIMENTAL PROTOCOL
To test the effectiveness of this protocol in a driving
situation on the road, we imagined an experiment us-
ing the three scenarios described in figures 4c, 4a, 4b.
3.1 Research Question
We state the following research question
RQ : Can a simple adaptation model, based on a rudi-
mentary attention model, improve the performance of
takeover on autonomous vehicle?
3.2 Theoretical Hypothesis
We formulate the following hypothesis:
As part of a takeover initiated by the automated sys-
tem, the objective and subjective performance of the
driver is improved by taking his state into account.
3.3 Driving Scenarios
Two scenarios are regularly studied in the literature:
the takeover at high velocity (Hayashi et al., 2019)
(Zeeb et al., 2015) (Eriksson et al., 2019) on a high-
way and the takeover in town (Langlois and Soualmi,
2016). In this study, we focus on high speed takeover.
In order to diversify the driving situations, we
have proposed three different driving scenarios:
3.3.1 Accident
The expected behavior requires precise actions on the
part of the driver. It is depicted in figure 4a.
3.3.2 Sensors Failure
No specific action is necessary but the automated sys-
tem is no longer able to drive. It is depicted in figure
4b.
3.3.3 Ambiguous Marking
Due to roadworks, the lane marking doesn’t allow
the automated system to define a safe behaviour and
the driver must choose between two scenarios. This
AMI: Attention based Adaptative Feedback with Augmented Reality to Improve Takeover Performances in Highly Automated Vehicles
101
Control
Computer
CAVE
Computer
3D engine
and rendering
CAVE-like environment
Driver
Steering wheel and
pedals
Commands
Control module
Manual
(takeover)
Automotion
System
Driving simulator
Feedback
Simulation
Environment
Feedback
selection
Attention
model
Driver's gaze tracking
data
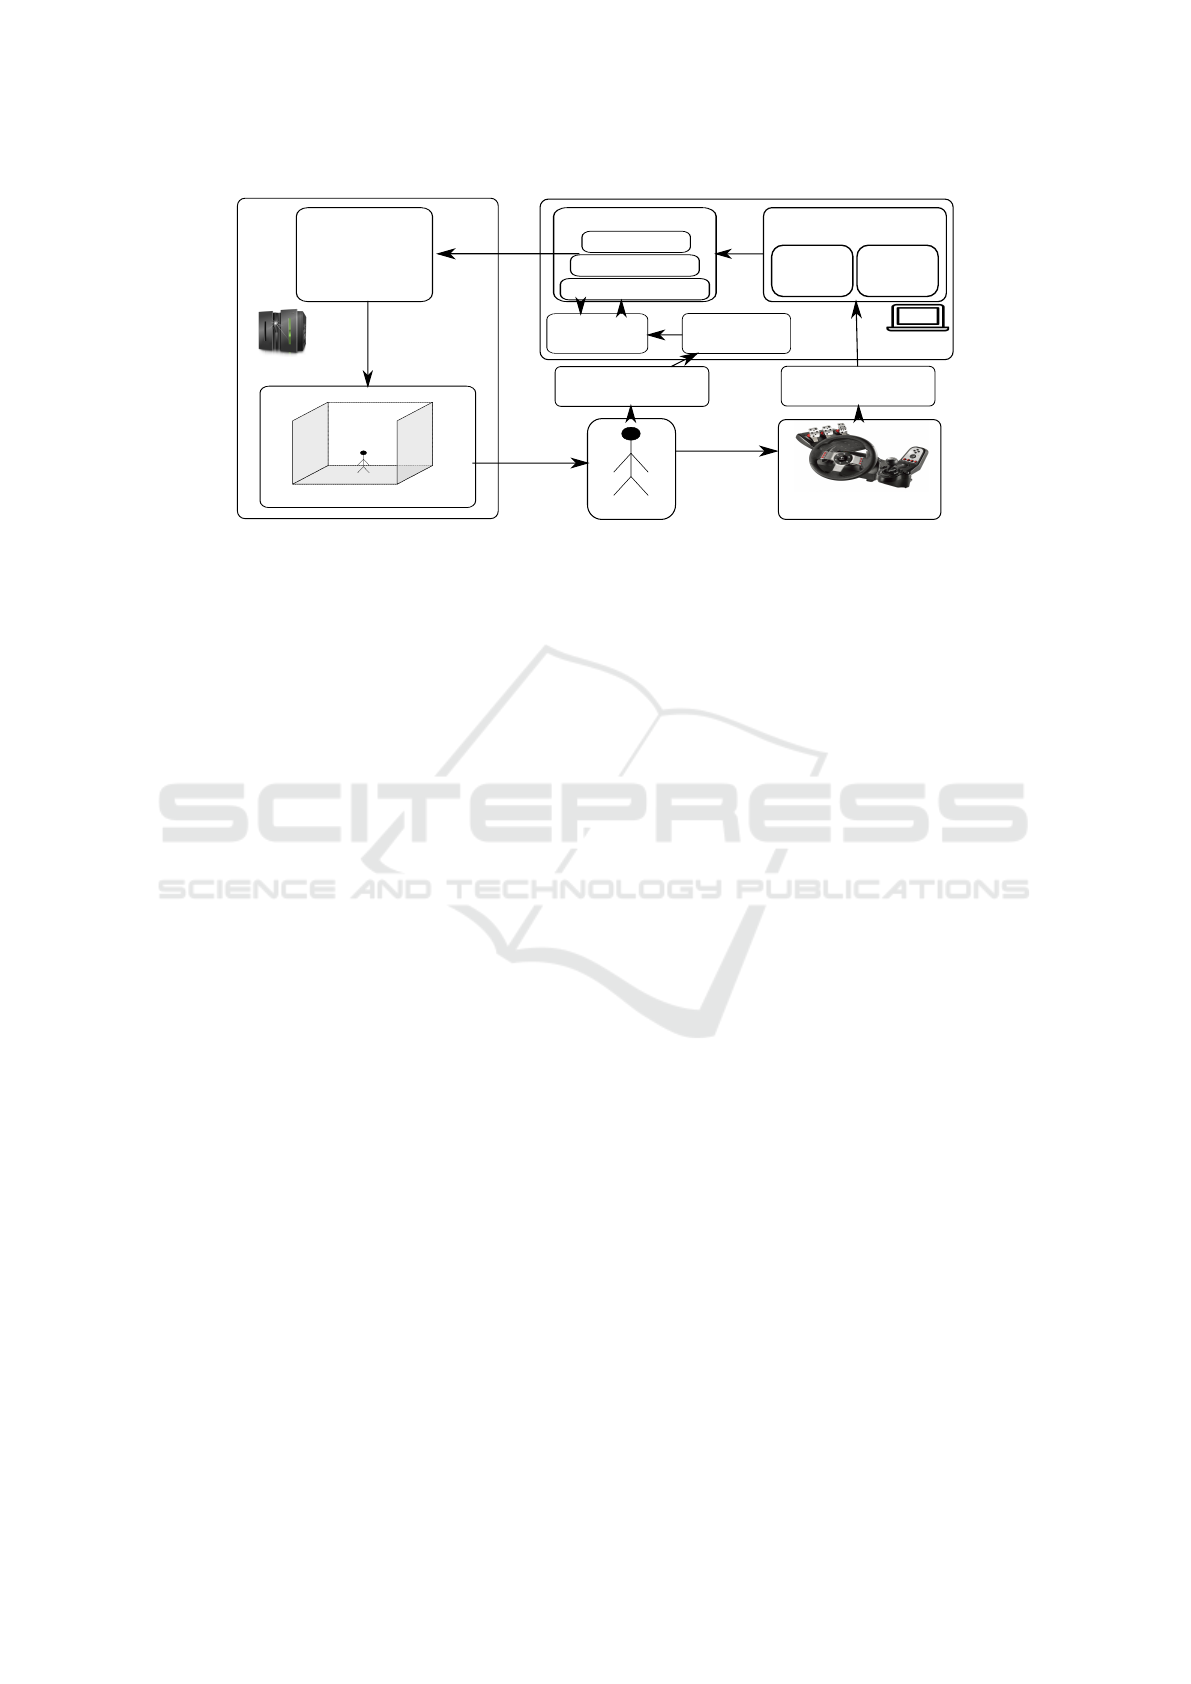
Figure 3: Implementation of the AMI model.
takeover is more complex than the previous ones be-
cause the traffic is denser and the obstacles are less
visible. It is depicted in figure 4c.
Scenarios for takeover shouldn’t concentrate on
short time budgets (TB)(de Winter et al., 2021) since
the nature and the location of perturbations use to be
known in advance. All of these scenarios were low
emergency takeovers and the time budget was 15 sec-
onds. The task at hand was relatively straightforward
and required a slight deceleration each time. In sce-
narios 1 and 3 the user had to swing to the left to avoid
obstacles.
3.4 Settings
We implemented the model as depicted in figure 3.
The driver is placed in a CAVE-like environment and
can interact with the driving simulator through the
steering wheel and pedals. A control module en-
capsulates the manual and autonomous mode and al-
lows the driver to switch between modes. The con-
trol module sends commands to the driving simulator
which determines the behaviour of all simulated vehi-
cles and the whole feedback. The AMI model selects
the appropriated feedback using our attention model.
Once all elements of the simulation have been calcu-
lated, a render engine providing a 3D representation
of the simulation in the CAVE-like environment.
We used the driving simulator SCANeR Studio to
model different scenarios. This software allows defi-
nition of precise scenarios, vehicle behaviors as well
as a specific environment. We used a CAVE-like envi-
ronment – an immersive virtual environment – with a
Logitech G29 driving device. The inputs were cap-
tured by a simulink module allowing to switch be-
tween manual mode and a rudimentary autonomous
driving mode. Driver was wearing AR glasses on
which constellations where placed so that the posi-
tion and orientation of the head were captured by
an Optitrack device whose information was retrieved
by a python3 module responsible for determining the
driver’s level of attention.
3.5 Independant Variables
The independent variable was the lack or use of the
AMI model. Groups that did not have access to an
adaptation model saw the feedback all the time while
those who did have access to the adaptation model
only saw it when the ARI fell below the threshold of
0.33.
3.6 Experiment Design
A between subject design was used for the indepen-
dent variable. Each subject was welcomed and briefly
presented with the task. They had five minutes to fa-
miliarize themselves with the simulator. Then, they
had to carry out three takeover on a single road in or-
der to learn the takeover task specifically. The subject
was offered four ways to regain control of the vehicle:
by accelerating or braking more than the automated
system, by steering or pressing a button to deactivate
the automated system. The takeover request (TOR)
was performed by a recorded male voice asking in
french to take over the control of the vehicle.
Then, they had to accomplish three scenarios de-
picted in figure 4. These three human interventions
took place on a highway at 100 km/h, each lasting one
to three minutes and separated by automation time
lasting 4 minutes during which the user was invited
to immerse themselves in a Non Driving Related Task
(NDRT).
The NDRT was a twenty question task (Merat
et al., 2014) whose answer was given orally by the
experimenter. The user had to guess a living being in
HUCAPP 2022 - 6th International Conference on Human Computer Interaction Theory and Applications
102
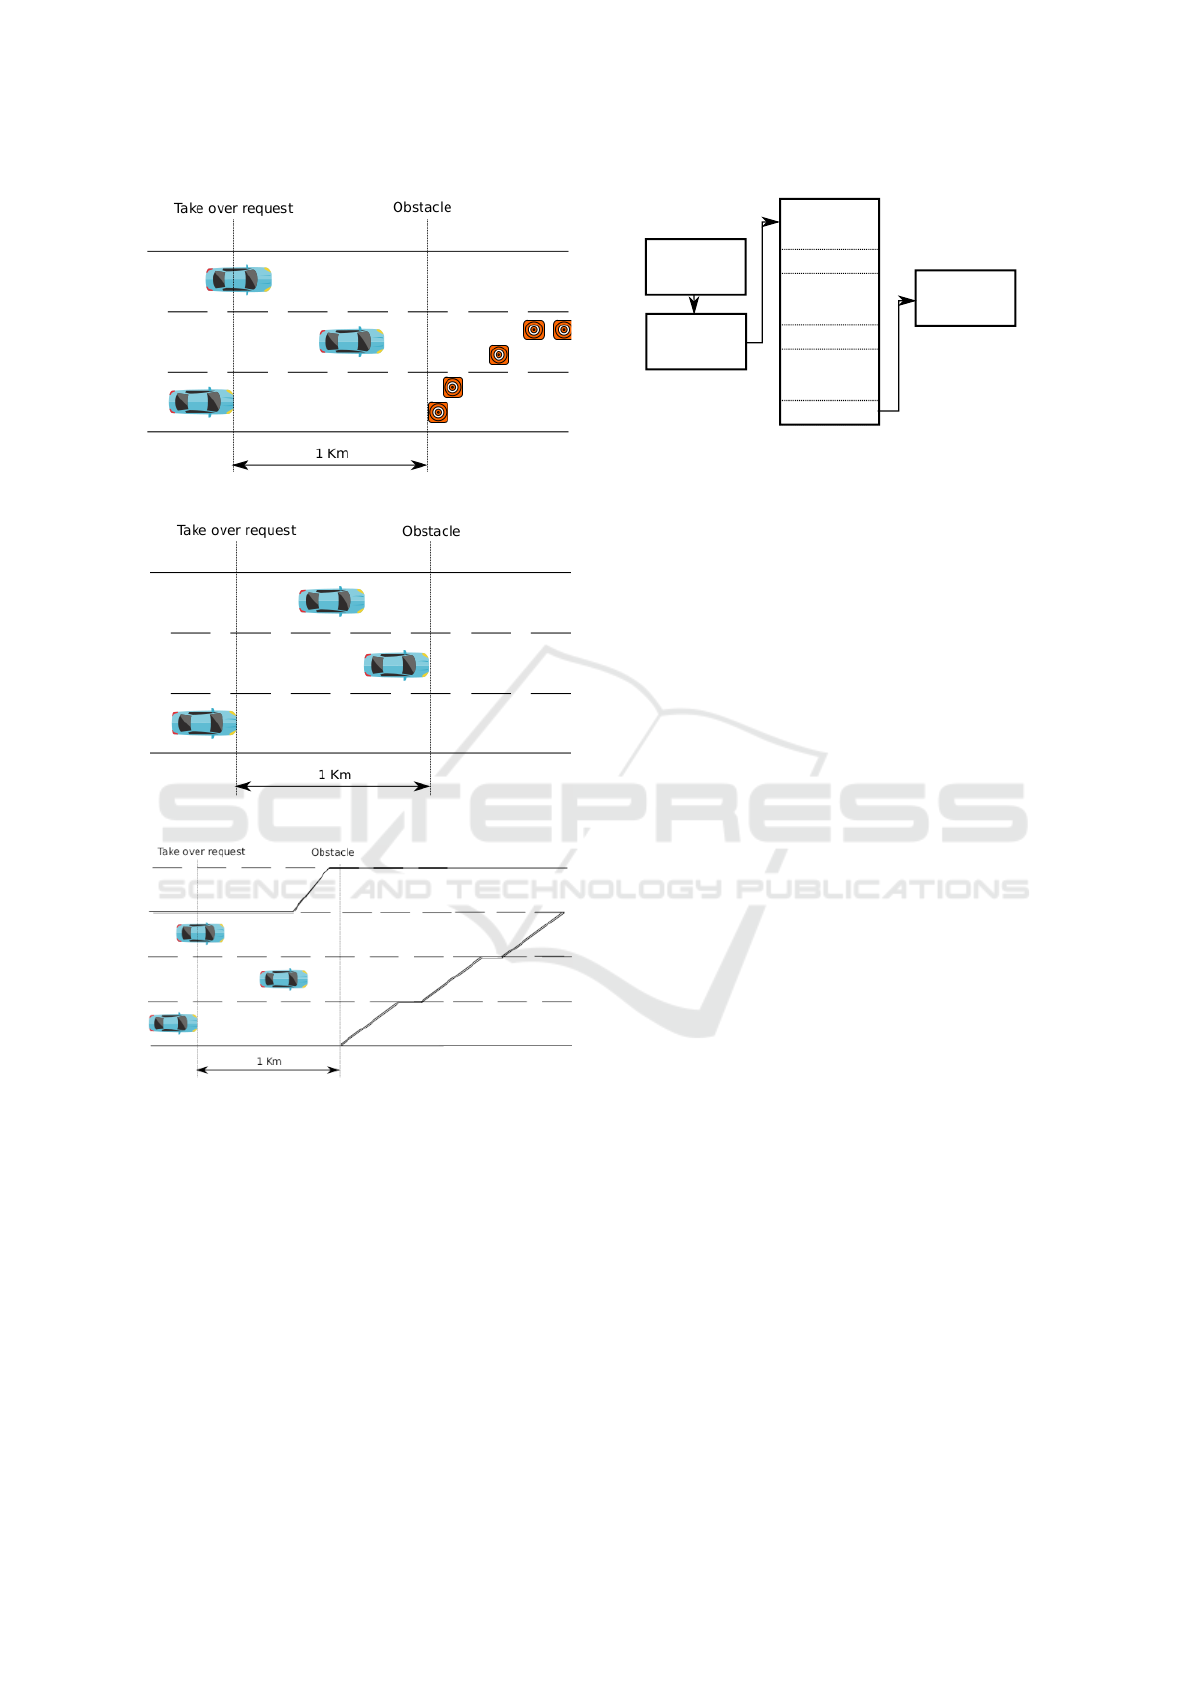
(a) Scenario 1 : Takeover due to an accident.
(b) Scenario 2 : Takeover due to sensors failure
(c) Scenario 3 : Takeover due to ambiguous marking around
roadworks
Figure 4: Studied scenarios.
a predefined list using only closed questions. When
the user guessed right, it was invited to guess a new
word. After the simulator phase, the subject had to
answer a questionnaire consisting of the NASA-TLX
and other questions specific to the experiment.
3.7 Data Collection
Several sets of data were collected to analyze the
driver’s performance.
Simulator
training
Takeover
training
High
Automotion
(3 mins)
Takeover 1
High
Automotion
(3 mins)
Takeover 2
High
Automotion
(3 mins)
Takeover 3
Subjective
questionnaire
Figure 5: Experiment design.
3.7.1 Subjective Data
We focused on data collected from the NASA-TLX
questionnaire to find out if the subject was more
stressed by one mode or the other. These results were
obtained by compiling subject’s responses to post-test
questionnaires. We are particularly interested in the
Temporal demand and Cognitive demand variables
which particularly reflect the variation of state that
we seek to measure and which characterize cognitive
overload.
3.7.2 Objective Data
Objective data were obtained by analyzing simulation
data from the virtual environment including tracking
data.
Reaction Time: Reaction time was calculated as the
time difference between the moment the TOR oc-
curred and the subject’s inputs were registered by the
system, whether driving or pressing the pedal. It in-
dicated better situation awareness when coupled with
other objective performance (Eriksson et al., 2019).
Type of First Reaction: The type of first reaction
recorded the instant the user regained control. If a
variation in the angle at the steering wheel has been
recorded, it was a ”turn” reaction, while braking re-
sults in a ”braking” reaction. A turn-type first reaction
was often considered abrupt.
Maximum Steering Wheel Angle: The maximum
steering wheel angle was calculated as the maximum
angle steering wheel during each of the scenarios.
They testified to the fluidity of the path and therefore
to a clear decision upstream.
Maximum Braking: Maximum braking was calcu-
lated as the maximum braking force value recorded
by the acquisition system and indicates a panic reac-
tion or lack of anticipation.
Maximum Acceleration: The maximum accelera-
tion was calculated as the maximum pressure on the
accelerator pedal recorded by the acquisition system.
It varied between 0 (no pressure) and 1 (maximum
AMI: Attention based Adaptative Feedback with Augmented Reality to Improve Takeover Performances in Highly Automated Vehicles
103
possible pressure). It was coupled with maximum
braking to distinguish panic reactions from late reac-
tions.
Critical ARI Duration: The critical ARI dura-
tion was calculated as the duration while the ARI was
under 0.3, taking into account the tracking data and
was related to the time during which the user had a re-
duced attention level. It was therefore used as a naive
indicator of attention.
4 RESULTS
4.1 Sample Presentation
A total of 19 participants divided into two groups
went through the three scenarios. Three of them could
not go beyond the simulator training phase for rea-
sons of simulator sickness and one had to be ruled out
for technical problems during the experiment. The
experiment was therefore actually carried out on 15
participants aged 23 to 44, including 13 men and two
women, all possessing a driving license. Most of the
subjects had never entered a CAVE-like environment
and had never driven a vehicle in a simulator.
4.2 Objective Results
Only one collision was recorded, in the case of a fixed
feedback in the third scenario. The average time dur-
ing which the ARI was deemed critical by the sys-
tem is approximately 15% of the time and no sig-
nificant difference could be observed regarding max-
imum acceleration, maximum braking, and reaction
time. descriptive statistics of the sample is shown in
table 2. We found significant differences concerning
the maximum angle recorded (alpha < 0.05). After
running normality tests, we performed appropriated
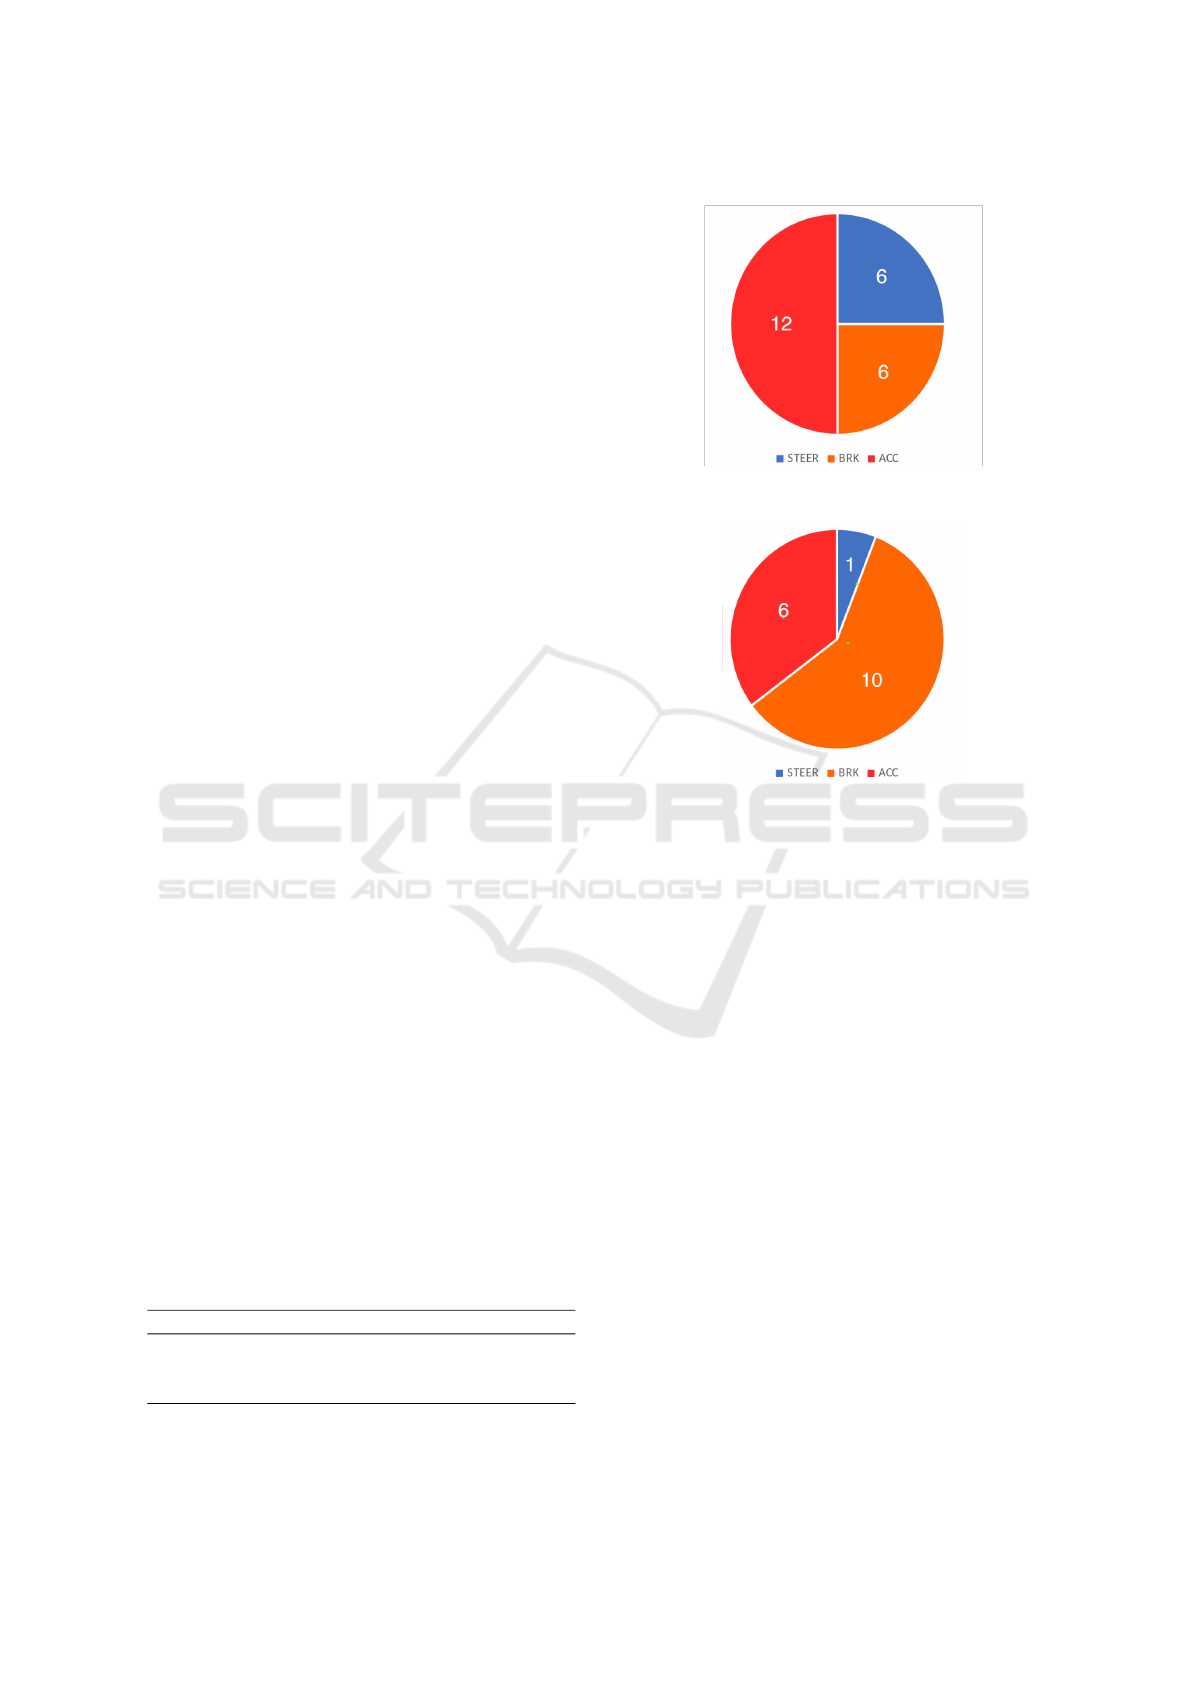
tests which can be seen on table 1. We can see a clear
difference between the two modalities when the situ-
ation looks very complex (scenario 3). Indeed, users
regained control by turning in 25% of cases (see fig-
ure 6), which shows a reaction of fear toward the ap-
proaching obstacle since steering is not the correct be-
haviour.
Table 1: T-tests performed on maximal angle distributions
(mw stands for Mann Whitney, W for Welch’s t-test).
Max Angle Test Stat p-value Effect Size
Scenario 1 MW 21.5 0.652 0.0964
Scenario 2 MW 19 0.27 0.4780
Scenario 3 W 2.43 0.017 1.3074
(a) Fixed feedback
(b) Adaptive feedback using AMI model
Figure 6: Distribution of the types of takeover of control.
We performed Shapiro-Wilk normality tests
which showed exits from normality in the first
two scenarios, which is why we performed Mann-
Whitney tests for the first two scenarios and a Welch’s
test for the third. Even if the results are not very sig-
nificant in the other scenarios, the trend seems to be
confirmed. To see the variations observed, we also
printed in figure 7 the y position of the vehicle over
time during the first 15 seconds of takeover. We can
see that the path followed by the vehicle is smoother
in case of Adaptive feedback rather than in case of
fixed feedback. This figure shows that users react very
fast to the takeover by turning the steering wheel with-
out a proper situation awareness.
4.3 Subjective Results
Concerning the subjective results, the answers to
the NASA-TLX questionnaire concerning Mental De-
mand (MD), Physical Demand (PD), Temporal De-
mand (TD), Success (Su), Effort (E) and Satisfaction
(SA) are presented in table 3. A high average indi-
cates a better score while a low average indicates a
poorer score. We observe, as expected, that the men-
HUCAPP 2022 - 6th International Conference on Human Computer Interaction Theory and Applications
104
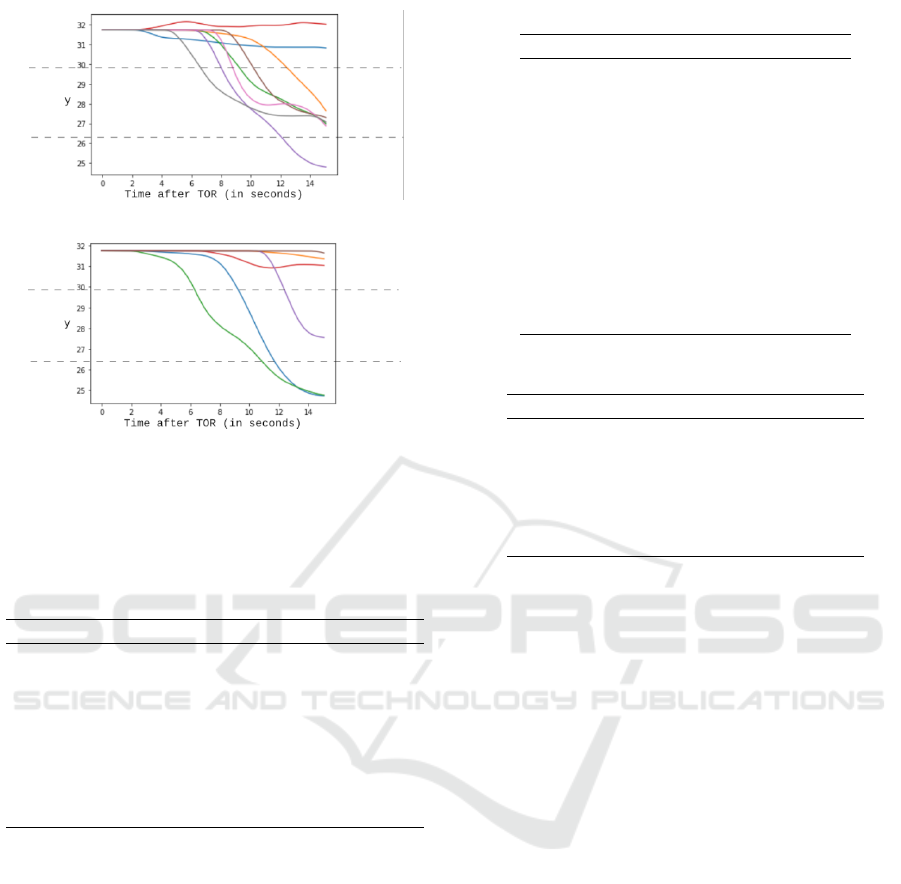
(a) Fixed feedback
(b) Feedback using AMI model
Figure 7: Variation of lateral position over time during the
third scenario (staying at the lane after 15 seconds isn’t re-
lated to failing at the task since driver decelerated in these
cases). Y represents the y coordinate in the simulator and
lines represents the position of the road lines on the road.
Table 2: Descriptive statistics for objective performances.
Variable Group N Mean SD
Reaction Time Fixed 24 3.36 2.1410
AMI 17 3.50 2.2285
Max. acc. Fixed 24 0.77 0.2616
AMI 17 0.71 0.2441
Max. brk Fixed 24 78.85 108
AMI 17 62.81 63.7703
Max. Angle Fixed 24 0.107 0.0780
AMI 17 0.077 0.0686
tal demand seems weaker when the subjects use the
adaptive interface. Our normality tests were positive
and therefore we proceeded to a Welch’s Student test,
whose results are presented in table 4. In general, sub-
jective results appear to be slightly lower using the
adaptive interface but the significance level is individ-
ually low.
5 DISCUSSION
5.1 Hypothesis Validation
The theoretical hypothesis according to which an
adaptive model allows the improvement of mental
load, and takeover performance seems to be con-
firmed, in particular in the case of the third scenario
Table 3: Descriptive statistics for subjective performances.
Variable Group N Mean SD
MD Fixed 8 5.50 1.77
AMI 7 3.71 1.60
PD Fixed 8 1.88 1.13
AMI 7 2.57 1.72
TD Fixed 8 4.13 2.30
AMI 7 3.43 2.37
Su Fixed 8 4.75 3.15
AMI 7 3.57 1.40
E Fixed 8 5.50 2.33
AMI 7 3.00 2.23
Sa Fixed 8 2.50 2.67
AMI 7 6 2.43
Table 4: T-tests performed on global performances.
Variable p-value Effect size
MD 2.178 0.051 1.170
PD -0.914 0.382 -0.479
TD 0.576 0.575 0.298
Su 0.956 0.362 0.484
E 1.213 0.247 0.627
Sa -1.301 0.216 -0.671
which involves an obstacle which is not very easy
to detect and requires greater concentration. Visual
feedback, which is supposed to assist the driver, ap-
pear to be more effective when used sparingly, and
subjects with naive feedback appear to have a slightly
better situation awareness and higher performance.
One could formulate the hypothesis that these perfor-
mances are related to a better attention level. How-
ever, these results are still not heavily significant and
should be confirmed in further studies.
5.2 Adaptation Model
Some subjects reported having been bothered by the
rapid disappearance of interfaces, which they initially
assimilated to a bug. This can be easily corrected by
displaying the feedback a few seconds after the ARI
comes back to a sufficient level.
5.3 Simulator Limitations
The low significance of the results can be explained
by some bias in the simulator. In particular, the cog-
nitive overload generated by the distracting task was
not coupled with a level of stress or danger. Indeed,
we can see that the temporal demand is rather low in
both cases and this seems to imply that the subjects
do not feel danger or particular emergency (Gemonet
et al., 2021). In addition, simulators tend to increase
AMI: Attention based Adaptative Feedback with Augmented Reality to Improve Takeover Performances in Highly Automated Vehicles
105

the variability in driving performance (Gemonet et al.,
2021).
In addition, our simulator did not inform the sub-
ject of his decisions and the choices of trajectories he
took, which led subjects to have very little confidence
in it and to remain very attentive to the road. Many
subjects reported that they considered themselves to
be fully attentive and that the distracting task had lit-
tle impact on their performance.
5.4 Perspectives for the Attention Model
Our results are encouraging but the attention model
is totally binary, meaning that one is considered by
the system to be either completely attentive or com-
pletely inattentive, and eye-on-road type phenomena
cannot be taken into account. It should be improved
by integrating real knowledge of the situation in order
to obtain noticeable differences in performance.
In particular, it would be necessary to add seman-
tic elements of the situation and to make assumptions
about elements of the scene. The ARI model proposes
a study of the road staring time, but it would be neces-
sary to give attention to the staring time of the impor-
tant elements in the scene such as the vehicle in front,
the obstacle or the other vehicles.
During the automation phase, numerous subjects
express verbally of by moving their body their dis-
agreement with the automated driving system deci-
sion (for example, slowing down). These visual and
verbal behaviors should be integrated in our model.
6 CONCLUSION AND FUTURE
WORKS
In this article, we present a new model of adaptive
visual feedback for takeover in highly automated ve-
hicle. This model is based on Herzberger’s attention
estimation. We developed a complete system in a
virtual reality device (CAVE-like environment) with
a driving simulator allowing the creation of specific
scenarios and the data collection of the user’s behav-
ior. Adaptive feedback were displayed through the
virtual environment (mixed reality).
Experiment were lead on around twenty partici-
pants of different ages. Results tend to show that user
have slightly better performances using an adapta-
tion model and feel less mental workload while taking
over the vehicle. However, the results should be cor-
roborated with future experiment on a more complex
model. This experiment allowed us to collect data on
driver’s gaze behavior and gestures during takeover.
We plan to improve this first model to obtain more
detailed information on driver readiness and thus im-
prove our adaptation model. Our work will aim at
correlating particular behaviors with some poor per-
formances recorded, in order to improve the feedback
and simplify the interface by restricting the number of
options displayed and then we will be able to test the
effectiveness of a more complex adaptive model.
ACKNOWLEDGEMENT
We thanks gratefully the FEDER (Fond europ
´
een de
d
´
eveloppement r
´
egional) and the UTC foundation for
research for their funding for this project. We also
thank Yohan Bouvet for his technical assistance on
the project.
REFERENCES
Bengler, K., Rettenmaier, M., Fritz, N., and Feierle, A.
(2020). From HMI to HMIs: Towards an HMI Frame-
work for Automated Driving. Information.
de Winter, J., Stanton, N., and Eisma, Y. (2021). Is the take-
over paradigm a mere convenience? Transportation
Research Interdisciplinary Perspectives.
Deo, N. and Trivedi, M. M. (2020). Looking at the
Driver/Rider in Autonomous Vehicles to Predict Take-
Over Readiness. IEEE Transactions on Intelligent Ve-
hicles.
Endsley, M. R. (1999). Level of automation effects on per-
formance, situation awareness and workload in a dy-
namic control task. Ergonomics.
Eriksson, A., Petermeijer, S. M., Zimmermann, M., de Win-
ter, J. C. F., Bengler, K. J., and Stanton, N. A.
(2019). Rolling Out the Red (and Green) Carpet:
Supporting Driver Decision Making in Automation-
to-Manual Transitions. IEEE Transactions on Human-
Machine Systems, 49.
Gemonet, E., Bougard, C., Honnet, V., Poueyo, M., Mas-
frand, S., and Mestre, D. R. (2021). Drivers’ perfor-
mances and their subjective feelings about their driv-
ing during a 40-min test on a circuit versus a dynamic
simulator. Transportation Research Part F: Traffic
Psychology and Behaviour.
Gold, C., K
¨
orber, M., Lechner, D., and Bengler, K. (2016).
Taking Over Control From Highly Automated Vehi-
cles in Complex Traffic Situations The Role of Traffic
Density. Human Factors: The Journal of the Human
Factors and Ergonomics Society.
Haeuslschmid, R., Shou, Y., O’Donovan, J., Burnett, G.,
and Butz, A. (2016). First Steps towards a View Man-
agement Concept for Large-sized Head-up Displays
with Continuous Depth. In Proceedings of the 8th
International Conference on Automotive User Inter-
faces and Interactive Vehicular Applications - Auto-
motive’UI 16, Ann Arbor, MI, USA. ACM Press.
HUCAPP 2022 - 6th International Conference on Human Computer Interaction Theory and Applications
106

Hart, S. G. & Staveland, L. E. (1998). Development of nasa-
tlx (task load index): Results of empirical and theoret-
ical research. Human Mental Workload. Amsterdam:
North Holland Press.
Hayashi, H., Kamezaki, M., Manawadu, U., Takahiro, K.,
EMA, T., Lollett, C., and Sugano, S. (2019). A Driver
Situational Awareness Estimation System Based on
Standard Glance Model for Unscheduled Takeover
Situations.
Herzberger, N. D., Voß, G. M. I., Becker, F. K., Grazioli,
F., Altendorf, E., Canpolat, Y., Flemisch, F. O., and
Schwalm, M. (2018). Derivation of a Model of Safety
Critical Transitions between Driver and Vehicle in Au-
tomated Driving.
Langlois, S. and Soualmi, B. (2016). Augmented reality
versus classical HUD to take over from automated
driving: An aid to smooth reactions and to anticipate
maneuvers. In 2016 IEEE 19th International Con-
ference on Intelligent Transportation Systems (ITSC).
ISSN: 2153-0017.
Lindemann, P., Muller, N., and Rigolll, G. (2019). Ex-
ploring the Use of Augmented Reality Interfaces for
Driver Assistance in Short-Notice Takeovers. In 2019
IEEE Intelligent Vehicles Symposium (IV). IEEE.
Lorenz, L., Kerschbaum, P., and Schumann, J. (2014). De-
signing take over scenarios for automated driving:
How does augmented reality support the driver to get
back into the loop? Proceedings of the Human Fac-
tors and Ergonomics Society Annual Meeting.
Lu, Z. and de Winter, J. C. (2015). A Review and Frame-
work of Control Authority Transitions in Automated
Driving. Procedia Manufacturing.
Merat, N., Jamson, A. H., Lai, F. C., Daly, M., and Carsten,
O. M. (2014). Transition to manual: Driver behaviour
when resuming control from a highly automated vehi-
cle. Transportation Research Part F: Traffic Psychol-
ogy and Behaviour.
Merat, N., Jamson, A. H., Lai, F. C. H., and Carsten, O.
(2012). Highly Automated Driving, Secondary Task
Performance, and Driver State. Human Factors: The
Journal of the Human Factors and Ergonomics Soci-
ety.
Phan, M. T., Fremont, V., Thouvenin, I., Sallak, M., and
Cherfaoui, V. (2014). Recognizing Driver Awareness
of Pedestrian. In 17th International IEEE Conference
on Intelligent Transportation Systems (ITSC), Qing-
dao, China. IEEE.
Radlmayr, J., Gold, C., Lorenz, L., Farid, M., and Bengler,
K. (2014). How Traffic Situations and Non-Driving
Related Tasks Affect the Take-Over Quality in Highly
Automated Driving. Proceedings of the Human Fac-
tors and Ergonomics Society Annual Meeting.
Sportillo, D., Paljic, A., and Ojeda, L. (2018). Get ready
for automated driving using Virtual Reality. Accident
Analysis & Prevention.
Zeeb, K., Buchner, A., and Schrauf, M. (2015). What
determines the take-over time? An integrated model
approach of driver take-over after automated driving.
Accident Analysis & Prevention.
AMI: Attention based Adaptative Feedback with Augmented Reality to Improve Takeover Performances in Highly Automated Vehicles
107
