
Analysis of the Relationship between Subjective Difficulty of a Task and
the Efforts Put into It using Biometric Information
Katsuko T. Nakahira
a
, Munenori Harada and Muneo Kitajima
b
Nagaoka University of Technology, Nagaoka, Niigata, Japan
Keywords:
Biometric information, Difficulty of a Task, Pupil Diameter, Learning Motivation.
Abstract:
This paper proposes a novel method for analyzing the relationships between the difficulty of tasks and the
effort of learners to accomplish them using biometric information. The biometric information we adopted
was as follows: 1) pupil diameter variation for estimating subjective task difficulty, and 2) eye movements
indicative of answer selection times for assessing subjective efforts and strategies to solve the problems. The
data used in this study are eye movement data obtained in a different study for studying brain activities during
arithmetic calculations in terms of electroencephalography (EEG) data (Suzuki et al., 2021). This study re-
analyzed the eye movement data by introducing the following two variables: 1) the duration times in the
characteristic areas for solving the tasks to understand how the participants strategically retrieved the task
information, and 2) the changes in the sizes of pupil diameter to understand the levels of engagement of
the participants while solving the tasks. This study suggests that the relationships found in these variables
should characterize the participants’ learning attitudes and could be related to confidence and satisfaction
in the attention-relevance-confidence-satisfaction (ARCS) model, indicating the possibility of applying the
results to educational systems.
1 INTRODUCTION
Since the onset of the Coronavirus-2019 pandemic,
opportunities for online learning centered on e-
learning have increased from the perspectives of so-
cial distance and avoidance of crowds. This is also
the case in the context of higher education institu-
tions. Additionally, issues related to learning attitudes
such as the quality of learning and the level on moti-
vation have emerged. The intensive e-learning that is
currently practiced, makes it difficult to motivate stu-
dents to learn and keep the quality of learning at high
levels by the timely and appropriate interventions of
the teachers.
One of the reasons for the difficulty might be the
discrepancy between the difficulty level of the tasks
given to the learner and the learner’s learning abil-
ity. In order for a learner to stay motivated to learn
a subject, it is crucial to have the learner engage in
the task, which has to be at the right level of diffi-
culty for the learner. In other words, the subjective
task difficulty should be at the right level; when it is
a
https://orcid.org/0000-0001-9370-8443
b
https://orcid.org/0000-0002-0310-2796
too easy, the learner would consider the time spent for
solving the task wasteful. On the other hand, if it is
too hard, the learner would give up without gaining
any knowledge from the learning. Learning through
the right task would provide the learner with the sat-
isfaction of task-accomplishment. Even if the learner
fails to solve the problem, s/he would gain useful in-
formation after understanding the correct answer by
gaining knowledge on solving the problem correctly.
In this paper, as a method to solve this discrep-
ancy, we examine the possibility of estimating the ap-
propriateness of the difficulty level of the presented
task from the degree of cognitive load at the time of
task execution, using the task of mental arithmetic ad-
dition and multiplication as an example task. In order
to estimate the degree of matching of the difficulty
level of a given task with the ability of participants,
this paper examines the utility of biometric informa-
tion such as eye movement and pupil diameter during
calculation.
This paper is organized as follows. Section 2
describes the model of assessment of task difficulty
and efforts in solving tasks via biometric information.
Section 3 outlines the previous experiment whose
data we use for this paper. Section 4 describes the
Nakahira, K., Harada, M. and Kitajima, M.
Analysis of the Relationship between Subjective Difficulty of a Task and the Efforts Put into It using Biometric Information.
DOI: 10.5220/0010906800003124
In Proceedings of the 17th Inter national Joint Conference on Computer Vision, Imaging and Computer Graphics Theory and Applications (VISIGRAPP 2022) - Volume 2: HUCAPP, pages
241-248
ISBN: 978-989-758-555-5; ISSN: 2184-4321
Copyright
c
2022 by SCITEPRESS – Science and Technology Publications, Lda. All rights reserved
241
method for analyzing biometric information. Section
5 describes the results of the analysis. Section 6 dis-
cusses the obtained results from the perspective of ap-
plying them for effective education.
2 SUBJECTIVE TASK
DIFFICULTY AND EFFORTS IN
SOLVING TASKS
This section commences with a description of the
method for estimating the degree of subjective dif-
ficulty of tasks by using biometric information in
Section 2.1. It is assumed that the reaction of the
learner at the very moment when s/he observes the
task should be critical to estimating his/her motivation
to engage in the task, and not after s/he spends some
amount of time solving the task. The biometric infor-
mation should reflect his/her unconscious reaction to
the task, which should be dependent on his/her per-
sonal experience and moment by moment situation.
The second topic of this section described in Sec-
tion 2.2 is the amount of effort expended in solv-
ing the task. This is again estimated by using bio-
metric information, more specifically using the eye
movement patterns that should characterize when the
learner confirms that the problem has been solved.
Directly observable behavior such as completion of
entering the answer by using a keyboard could be
used for estimating the above, but the biometric in-
formation should be more accurate than the latter for
estimating it.
2.1 Pupil Diameter: Estimating
Subjective Task Difficulty
There are two types of changes concerning the pupil;
mydriasis (dilation of the pupil) and miosis (contrac-
tion of the pupil of the eye) depending on the amount
of light entering the eye and the mental state. It has
been reported that the relationship between the pupil
diameter and the mental state of a person shows a
large mydriasis with the passage of time when a men-
tal stress load is applied, but shows different changes
depending on the type of stress (Taba et al., 1996).
In addition, it has been reported that when the sub-
ject was shown a video in which the object gradually
appeared, mydriasis had already occurred before the
inspiration or new perception was reported (Suzuki
et al., 2018).
These findings could be used for deriving relation-
ships between the states of efforts and the degree of
task difficulties; the amount of mydriasis is propor-
-3
-2.5
-2
-1.5
-1
-0.5
0
0.5
1
-1 0 1 2 3 4 5
Δ pupil(arb. unit)
duration time (arb. unit)
baseline B
i
pattern I
pattern II
pattern III
P
NPR
(T
NPR
, A
NPR
)
P
max
(T
max
, A
max
)
Figure 1: The relation between duration time and ∆ pupil
diameter.
tional to the degree of task difficulty, i.e., the more
difficult the task becomes, the larger the mydriasis be-
comes due to increased cognitive processing.
Figure 1 schematically shows the relationships be-
tween the changes in pupil diameter and the duration
times. The vertical axis represents the variation of
the pupil diameter denoted as A with reference to the
baseline B
i
where i denotes the index of the partic-
ipant of the experiment. The horizontal axis repre-
sents the duration time t where t = 0 corresponds to
the time when the stimulus was provided. The points
P
NPR
and P
max
characterize the pupil reaction to the
input stimuli; P
NPR
corresponds to so-called “near
pupil response,” and P
max
is the point where the an-
swer to the problem is confirmed.
Figure 1 illustrates three patterns that are differen-
tiated by the task solving situations depending on the
values of A
max
relative to B
i
. The respective partici-
pant’s states would be estimated as follows:
(I) A
max
> B
i
(top); severely unexpected discovery
of solution with intensive thinking.
(II) A
max
∼ B
i
(middle); weak unexpected discov-
ery of solution with moderate thinking.
(III) A
max
< B
i
(bottom); no unexpected discovery
of solution or idle. Gives up to find the candi-
date answer.
2.2 Answer Selection Time for
Assessing Subjective Task Efforts
and Strategies
In arithmetic calculation tasks, there are numer-
ous steps to select the answer. For example,
Lebier (Lebiere, 1999) suggested that there are two
basic strategies to confirm the answer: simple retriev-
ing and calculation answer. After choosing strategy,
participants execute the task. The termination condi-
tion of the arithmetic calculation task is divided into
the case where answer confirmation is possible and
not possible. If answer confirmation is possible, the
HUCAPP 2022 - 6th International Conference on Human Computer Interaction Theory and Applications
242
task is completed by selecting either the correct or in-
correct answer. If answer confirmation is not possible,
the task ends due to giving up on the task.
In the experiment referred in this paper, the arith-
metic calculation task is performed within a fixed time
of t
task
seconds in order to induce the partial strategy
selection time to be performed in a short time or to
give up. The difficulty level L
t
of the task presented
to the partial is set to the following three types in light
of the arithmetic teaching guidelines in Japan:
1. Those that can be solved almost easily within t
task
seconds,
2. Those that are thought to be multi-decomposable
in about t
task
seconds, and
3. Those that are almost unlikely to be solved in t
task
seconds.
For retrieving strategy, the process of selecting an-
swers basically matches the pattern of perception in-
formation and memory information. In this sense, the
answer selection time for the arithmetic calculation
task is dependent on whether the participants’ finish
the pattern matching. If the participant is accustomed
to doing calculations on a regular basis, the pattern
matching will take less time. However, participants
may find it uninteresting because it is a dry task. If
not, since it is difficult for participants to perform pat-
tern matching on the task, they will continue matching
for a long time or give up matching. In any case, the
participant needs to change the strategy from retriev-
ing to calculation, in order to select the right answer.
With regard to calculation strategy, there are mul-
tiple steps for answer confirmation. Since the calcu-
lation strategy is a procedural task, it will take more
time for a participant than a simple search, but it will
feel like an intellectual task.
On the other hand, it is also assumed that the
partial cannot answer confirmation by retrieving or
calculation for the arithmetic calculation task. The
existence of inference, which is a third strategy, is
conceivable so as not to give up answer confirma-
tion easily. In other words, when answer confirma-
tion is possible for some digits, answer confirmation
is performed from the candidate presented based on
that information. In the case of answer confirmation
by inference, answer confirmation needs to be per-
formed only for some digits, and thus can be com-
pleted quickly compared to retrieving and calculation.
From the above, the answer selection time T
c
can be
an index of how the partial selection was performed.
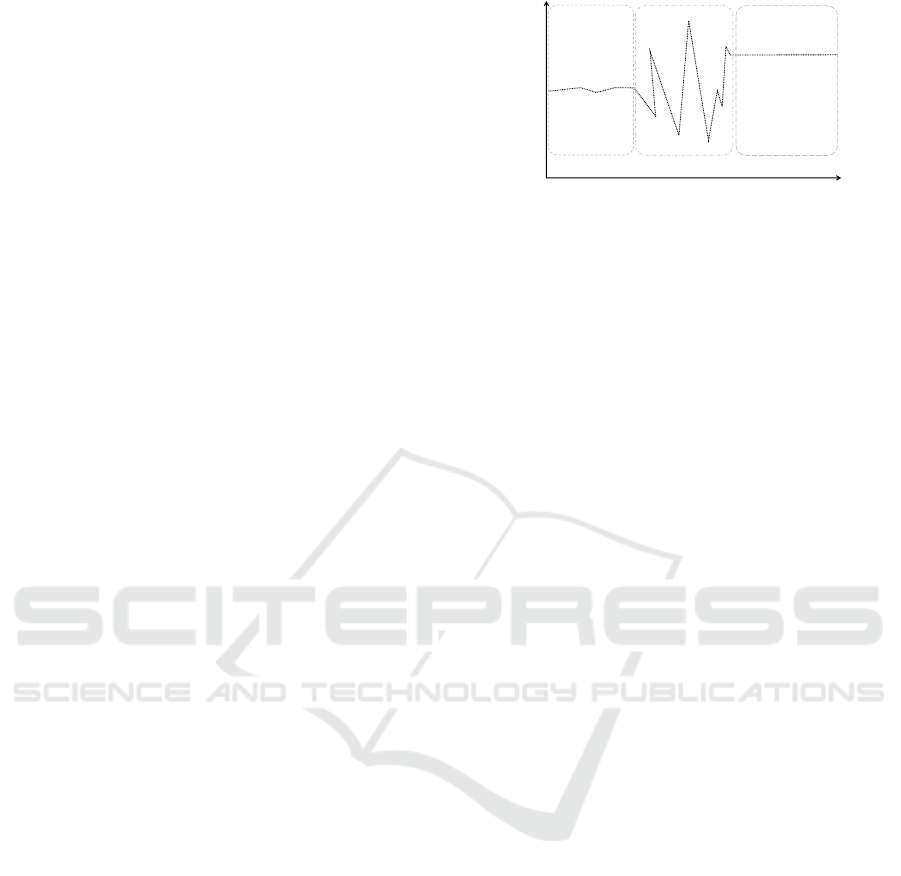
Figure 2 shows the relation between duration time
and eye movement which is represented by AOI. The
participants’ eye movement will be 3 steps:
• watch the given task (Zone A in Figure 2),
Area
Of Interest [arb. Unit]
Duration Time[arb. Unit]
Zone A Zone B Zone C
Figure 2: The relation between duration time and eye move-
ment which represented AOI.
• Work on the task and select the answer (Zone B in
Figure 2),
• stare at the answer (Zone C in Figure 2).
In this paper, T
c
is defined by the boundary Zones
A and B. When participants are watching the given
task, they concentrate on performing the task; this
means that they cannot afford to look away. In a
sense, participants’ eye movements are for engaging
in the specific area. At the time of finishing the given
task, they prepare to select the answer candidate. The
reason why we set T
c
as the boundary Zones of A and
B is that we save time with regard to participants who
finished the task and began to select the answer can-
didate. The relationships between the strategy which
participants selected and T
c
are as follows:
• Pattern D: short time T
c
, Zone B area, and long
time Zone C. Selected retrieving strategy with
high confidential of answer.
• Pattern E: long time T
c
, middle time of Zone B,
and short time Zone C. There are two possibili-
ties. (1) selected calculation strategy with high
confidential of answer, and (2) selected inference
strategy.
• Pattern F: short time T
c
, long time of Zone B, and
no show of Zone C. Gave up to find answer.
Through these consideration, we analyze the re-
lation between ∆A and T
c
, which indicate the partic-
ipants’ condition, and whether they perceive the task
as dry/intellectual issue.
3 SUZUKI ET
AL.’S EXPERIMENT (Suzuki
et al., 2021)
The purpose of this study was to conduct a basic anal-
ysis to estimate the difficulty level of a task for learn-
ers by designing calculation tasks with three difficulty
levels and measuring biometric data of learners while
Analysis of the Relationship between Subjective Difficulty of a Task and the Efforts Put into It using Biometric Information
243
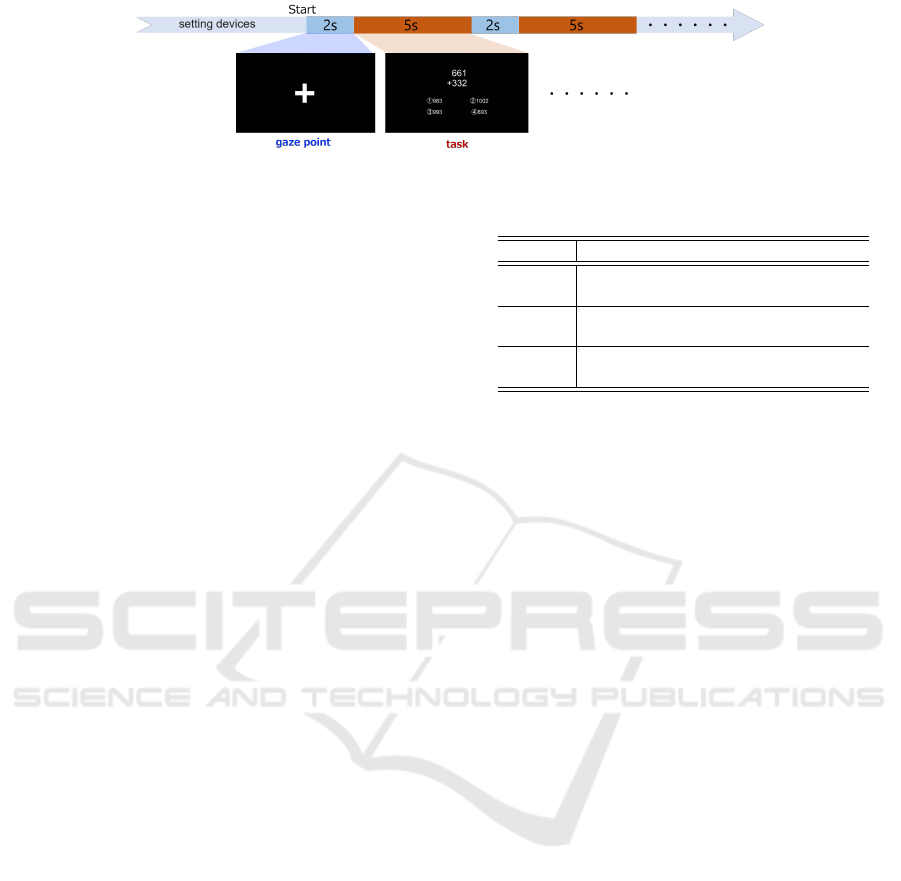
Figure 3: Flow of the experiment.
they were working on the task. This section reviews
the method of the experiment and the main results
concerning the EEG data, which motivated us to con-
duct re-analysis of the pupillary dilation in conjunc-
tion with the times necessary for the participants to
confirm their answers.
3.1 Overview of the Experiment
3.1.1 Equipment
EPOC+ was used for measuring EEG data of the par-
ticipants while engaging in the arithmetic tasks with
the sampling rate of 128 Hz. Tobii Pro Nano was used
for gaze measurement. The sampling rate was 60 Hz.
The monitor used in this experiment was 21.5 inches
with a resolution of 1920 × 1080 pixels. It was set
up so that the distance between the monitor and the
subject was about 57.3 cm. Tobii Pro Lab was used to
conduct the task.
3.1.2 Participants
18 undergraduate and graduate students in their teens
and twenties participated in the experiment. This ex-
periment was approved by the Ergonomic Experiment
Ethics Committee of Nagaoka University of Technol-
ogy.
3.1.3 Procedure
The experimental flow is shown in Figure 3. This ex-
periment was conducted in a cycle in which the gaz-
ing point was displayed at the center of the monitor
for 2,000 msec, followed by the computation task and
answer choices for 5,000 msec.
Three task levels were set for the arithmetic prob-
lems as shown in Table 1 with the following expected
times to solve the problems:
• Normal tasks were expected to be answered in 0.5
sec,
• Easy tasks, less than 0.5 sec, and
• Hard tasks, more than 0.5 sec.
Table 1: Level of calculation task.
Level Contents
Easy Addition of two numbers of three dig-
its without carry-overs
Normal Addition of two numbers of three dig-
its with carry-overs
Hard Multiplication of 3-digit and 2-digit
numbers
The participants were instructed to press a key
once to start the experiment. During the experiment,
they were required to solve arithmetic problems one
by one, and to gaze at one which matched with what
they thought was the answer for the problem, among
the four alternatives.
3.2 Overview of the Main Results
The EEG data for the period of 1500 msec before
and 4500 msec after the presentation of the task
were analyzed by using EEGLAB version 2019.0 and
EEGLAB version 2019.1. The baseline was used for
analysis. Suzuki et al. (Suzuki et al., 2021) specifi-
cally focused on the EEG data known as Fmθ (Yam-
aguchi, 2008) expressed at 67 Hz from the midline of
the frontal lobe. They obtained the frequency spectra
of F3 and F4 channels closest to the midline of the
frontal lobe.
In this experiment, participants responded not by
pressing buttons but by gazing in order to reduce the
effect on the EEG as much as possible. Therefore,
their answer status was analyzed from their gaze data.
The participant calculates the question, then looks for
the number that matches the answer, and stares at the
one with the correct number. The sum of the time
spent gazing at the correct number and the time spent
gazing at the wrong number was calculated.
In the Easy and Normal conditions, the correct and
wrong numbers were clear and the distribution char-
acteristics were similar. The total time spent looking
at the wrong number in one trial was often less than
0.5 seconds, and the task was viewed within 4.5 sec-
onds after presentation. In Hard condition, the distri-
bution of gazing at the wrong number and the correct
number was similar, and it was difficult to determine
the answer chosen by the participant from the gaze
HUCAPP 2022 - 6th International Conference on Human Computer Interaction Theory and Applications
244
data. These results indicate that the correct answer
was given when the gaze was on the correct number
for more than 0.5 sec, a feature observed in the Easy
and Normal. A reading of 0.5 sec or less, but after 4.5
sec, was also considered a correct answer.
4 ANSWER SELECTION AND
PUPILLARY DILATION
4.1 Answer Selection Time
The participant’s task was to mentally calculate the
answer to a given arithmetic problem. The problem
was displayed in the upper center of the screen. The
answer to that question was one of the four choices
given in two rows and two columns at the bottom
of the screen. It was assumed that after seeing the
problem, the participant would complete this task by
deriving an answer using mental arithmetic, finding
a match among the four options, and staring at it.
Based on this task achievement process, we devised
a method to derive the answer selected by the partici-
pant from the recorded eye movement data.
Figure 4: Angle from the center of the answer numbers.
Among the eye tracking data measured by the eye
tracker, we analyzed those wherein the type of eye
movement was “Fixation.” The gaze data, which were
recorded as two-dimensional data using the coordi-
nates of the monitor (x, y), were converted to one-
dimensional data as shown in Figure 4; a gaze point
was represented as its angle θ from the center of the
four answers denoted as (x
0
, y
0
) as follows:
θ = tan
−1
y
0
− y
x − x
0
(−180
◦
≤ θ ≤ 180
◦
) (1)
A participant’s gaze was initially directed to the
question and then on one of the answers s/he chose.
It then directed participants to the area where the
choices for the correct answer were presented. When
the participant’s gaze stayed on the answer area
longer than 100 msec, the entry time was recorded
as the answer selection time.
Figure 5: Difference from the median.
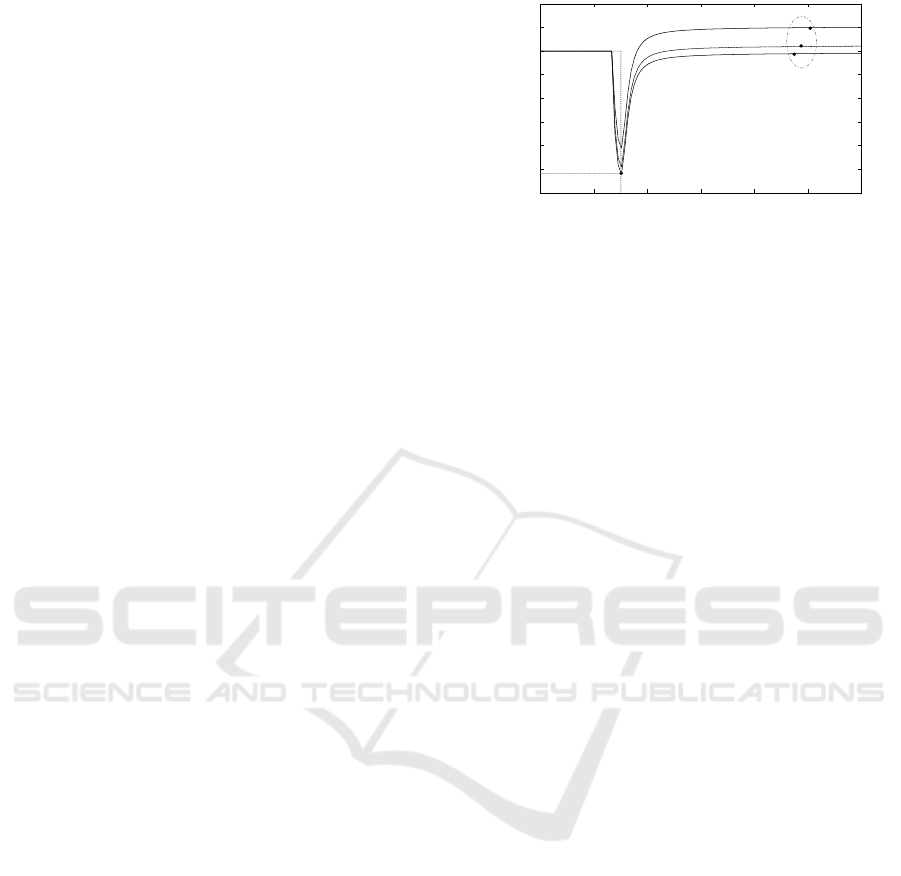
4.2 Pupil Diameter Variation
The pupil diameter data measured by the eye tracker
was analyzed by linear interpolation using the eye
movement type of Fixation. The baseline was defined
as the average pupil diameter during the 500 ms im-
mediately preceding the presentation of the tasks, and
the pupil diameter data were calculated as the varia-
tion from the baseline (Tobii-AB, 2021).
The pupil diameter tended to contract significantly
immediately after the task was presented (between
1∼2 sec). This is thought to be a convergence reac-
tion caused by near vision effect. Therefore, the pupil
diameter variation was defined as the range from the
minimum value during the 1∼2 sec, when the conges-
tion reaction was considered to have occurred, to the
maximum value thereafter.
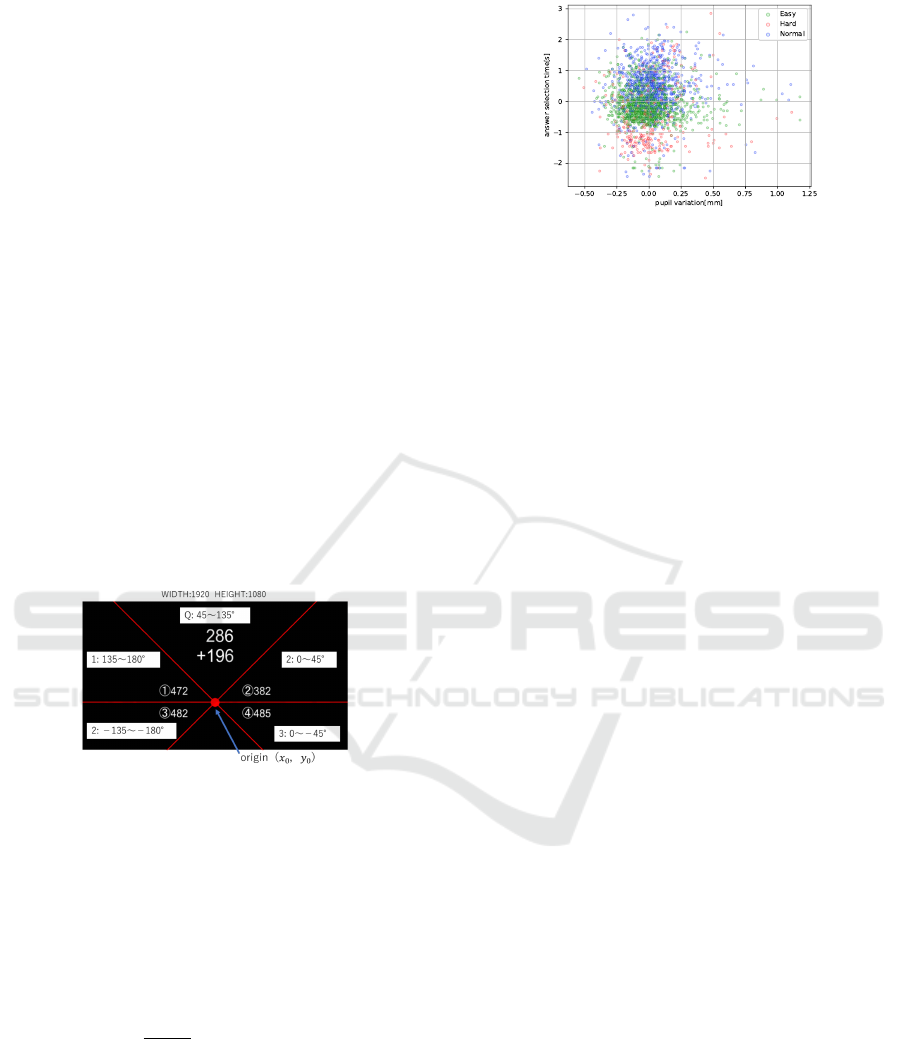
5 RESULT
The answer selection time and the pupil diameter vari-
ation were calculated for tasks of all participants that
were judged to be correct. The median value for
each participant was then calculated, and the differ-
ence between the answer selection time and the pupil
diameter variation for each task and the median value
for each participant was calculated. The results are
shown in Figure 5. Five areas are identified in Figure
5 as follows:
Area 1. Pupil diameter variation is more than average
and answer selection time is above average.
Area 2. Pupil diameter variation is below average and
answer selection time is later than average.
Area 3. Pupil diameter variation is less than average
and answer selection time is below average.
Area 4. Pupil diameter variation is above average and
answer selection time is earlier than average.
Area 5. Belonging to the ellipse with four points as
vertices, where the pupil diameter variation
is ±0.1 mm, and the answer selection time is
±0.6 sec.
Analysis of the Relationship between Subjective Difficulty of a Task and the Efforts Put into It using Biometric Information
245
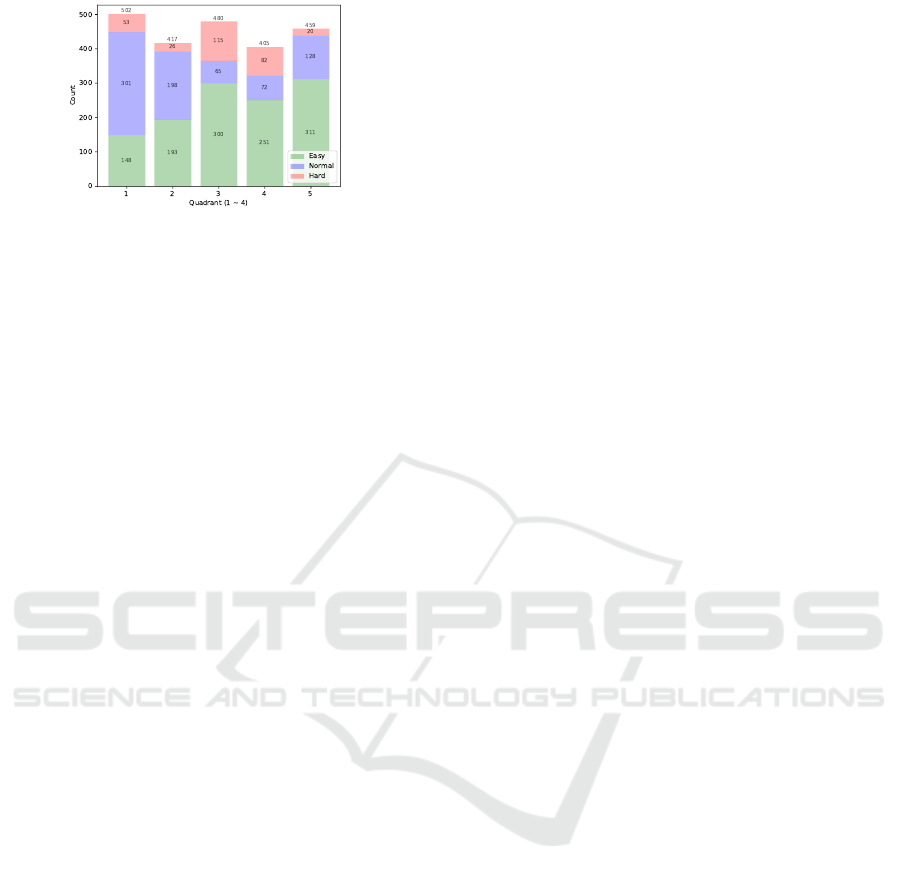
Figure 6: Quantity for each area.
The results of the count are shown in Figure 6.
The number of trials for each condition estimated to
be correct was 1203 for Easy, 764 for Normal, and
296 for Hard. The average values divided by the num-
ber of areas 5 were 240.6 for Easy, 152.8 for Nor-
mal, and 59.2 for Hard. In the Easy condition, Area
5 was the most common area, and Areas 3 and 4
were more common than average. The Easy condi-
tion exists mostly near the median of the participants.
The difficulty level of the problems should have been
higher than that of the Easy condition, so it can be
said that this was the correct attitude to take. In addi-
tion, the change in pupil diameter tended to be larger,
suggesting that the students were concentrating more
on solving the problem than in the other conditions.
In the Hard condition, Area 3 had the most trials and
Area 4 had more trials than the average. Trials judged
to be correct in the Hard condition, moved pupils’
eyes to the answer numbers more quickly than in the
other conditions, suggesting that they were not taking
the task seriously. The degree of change in pupil di-
ameter tended to be less than the average, suggesting
that the participants were not taking the calculation
seriously.
As shown in Figure 7, the results of Suzuki et al.’s
analysis showed high amplitudes in the range of 6 to
7 Hz in the Normal condition, suggesting that Fmθ
could be detected without problems. Pupil diame-
ter variation was also higher in the Normal condition,
suggesting that these two indicators are related.
6 TOWARD APPLICATION TO
EFFECTIVE EDUCATION:
RELATIONSHIP BETWEEN
ARCS MODEL
In this section, we discuss how to apply these results
towards effective education. One of the famous mo-
tivation models is the ARCS model which was pro-
posed by Keller (Keller, 1983; Keller, 1987). Accord-
ing to ARCS model, learner’s motivation is enhanced
by four categories of variables synthesis (Keller,
1987): 1) Attention, 2) Relevance, 3) Confidence, and
4) Satisfaction. Due to its high practicality, the ARCS
model is used in a wide range of fields such as training
design and teaching material development in compa-
nies, including educational places such as universi-
ties.
Based on the ARCS model, we focus on the cat-
egory of confidence and satisfaction. In procedural
tasks, the learners’ behavior can be represented as be-
low. Before the learner cannot learn the procedure,
when the learner is presented a task, firstly they try to
candidate the difficulty of the task. If the task expects
the task to be easy, the learner will think that the task
can be performed without difficulty. If not, the learner
will think that it can be performed with difficulty. We
regard this as the process of “candidate”. On the other
hand, the degree of agreement between the difficulty
level felt when the task is actually completed and the
expected difficulty level is directly related to the satis-
faction level felt by the learner. We regard this as the
process of “assessment”.
Candidates and assessments can be associated
with conflicts and satisfactions in the ARCS model.
“Candidates” predict whether the learner will have
the expectation that he or she will be able to do it,
and as a result, the probability that the task will be
successful. The success of a task is equivalent to the
learner’s successful experience. If the learner’s suc-
cessful experience leads to a psychological reward of
”good to do”, it will in turn lead to the learner’s “sat-
isfaction”.
Table 2 represents the criterion of confidence
or satisfaction. The table represents classifica-
tion the participants’ condition according to the
match/mismatch between the L
t
candidate when the
task is presented and the L
t
assessment after the task is
executed. Let the candidate L
t
be L
t,c
and the assessed
L
t
be L
t,a
. Pattern A and pattern C are cases where
the L
t,c
and L
t,a
do not match. Pattern A is L
t,c
< L
t,a
,
though the candidate wrongly estimates the task-ease
assessment. This is an opportunity to deny one’s abil-
ity, so satisfaction is expected to be low. Pattern C
is L
t,c
> L
t,a
, though the candidate wrongly estimated
the ease of the task. This is an opportunity to feel
the improvement of one’s own ability, and as a result,
satisfaction is expected to increase. Pattern B and pat-
tern D are cases where the L
t,c
and L
t,a
match. Pattern
B shows a successful experience with almost no mo-
tivation. Therefore, participants will only attain low
satisfaction for high confidence, which means it is no
surprise that the task is finished. Pattern D shows the
failure experience that difficult tasks could not be ex-
ecuted after all. Therefore, although the confidence
HUCAPP 2022 - 6th International Conference on Human Computer Interaction Theory and Applications
246
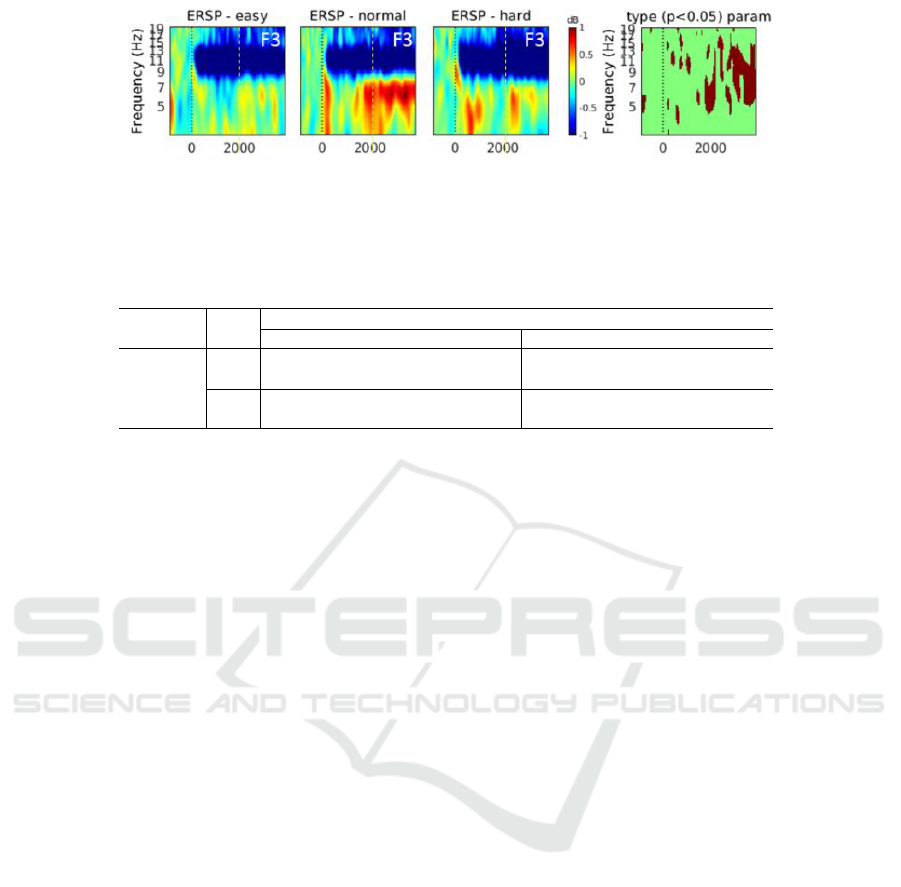
Figure 7: The results of EEG analysis by Suzuki et al. The results of the time-frequency analysis for each condition are
shown, as well as the intervals where a significant difference (without multiple comparison correction) was obtained at the
5% level between the conditions. The color of the figure means that the higher the power compared to the baseline, the redder
the color, and the lower the color, the bluer the color. The horizontal axis of the figure is time (msec) and the vertical axis is
frequency (Hz).
Table 2: Categorization of candidate/assessment difficulty Level and participants’ condition.
assessment
high low
candidate high Pattern D: Pattern C:
feel difficult, give up to solve feel difficult, can solve with ease
low Pattern A: Pattern B:
not motivated, feel difficult to solve not motivated, can solve with ease
is low, there will be no decrease in satisfaction due to
the experience of failure.
One of the similar tasks is the score reading pro-
cess. As shown by Nakahira and Kitajima (Nakahira
and Kitajima, 2017), the reading recognizes and re-
produces the pitch, interval, note value, and motif af-
ter perceiving the representation. Of these, for pitch,
interval, and note value, musical information is ac-
quired while selecting one of the following two strate-
gies. (1) Matching of memorized representation and
perceptual information, (2) Judgment of note type and
note value according to procedure based on partially
memorized reference note.
Participants who are accustomed to score reading,
memorize almost all musical note representations and
use them on a regular basis. Therefore, it is faster to
read the note type and pitch by adopting the strategy
(1). In the case of a complicated score or participants
who are not accustomed to reading notes, it is nec-
essary to adopt strategy (2) to read the pitch, inter-
val, and note value. If the participants adopt strategy
(1), they can understand the score structure in a short
time. From the viewpoint of playing an instrument,
they will think that the score is easy to play. How-
ever, it will often be considered a dry task. When
adopting strategy (2), it takes a long time to under-
stand the structure of the score. But from the view-
point of playing an instrument, it may be difficult to
play. In that case, participants will give up playing the
music or practice playing with the knowledge that it
will take time. In particular, in the case of (2), there
is a possibility that the partial completion can be used
to judge the difficulty level in order to provide music
at a level that does not cause participants to quit.
7 CONCLUSION
In this study, we analyzed the relationship between
the difficulty of arithmetic using pupil diameter data
and eye movement data and the state of work. We
designed a plane view centered on the answer con-
firmation time estimated from the eye movement and
∆A. On the plain, we plotted biometric information
to categorize the condition of the participants corre-
sponding to the 5 areas which set the vicinity of the
origin and the four quadrants for the two axes.
As a result, both T
c
and ∆A were characterized by
the difference in labeled L
t
. The values of both T
c
and
∆A increased in the order of Hard, Easy, and Normal
modes. From the scatter plot, we found that the data
for the low difficulty tasks were most concentrated in
the Areas 3 and 5, the data for standard difficulty tasks
were concentrated in the Areas 1 and 2, and the data
for high difficulty tasks were mostly concentrated in
the Areas 3 and 4. These suggested that both T
c
and
∆A, as biometric information, were suitable quanti-
ties for estimating the states of the participants’ con-
fidence and satisfaction. Based on these results, our
future tasks would be to improve the accuracy of esti-
mation of participants’ conditions for any given tasks.
ACKNOWLEDGEMENTS
This work was partly supported by JSPS KAKENHI
Grant Number 19K12232, 19K12246 and 20H04290.
MH also wants to thank to Nagai N · S Promotion
Foundation For Science of Perception for their finan-
tial support.
Analysis of the Relationship between Subjective Difficulty of a Task and the Efforts Put into It using Biometric Information
247

REFERENCES
Keller, J. M. (1983). Motivational design of instruction.
In Reigeluth, C., editor, Instructional-design theories
and models: An overview of their current status. Hills-
dale, NJ: Lawrence Erlbaum.
Keller, J. M. (1987). Strategies for stimulating the motiva-
tion to learn. Performance + Instruction, 26(8):1–7.
Lebiere, C. (1999). The dynamics of cognition: An ACT-
R model of cognitive arithmetic. Kognitionswis-
senschaft, 8:5–19.
Nakahira, K. and Kitajima, M. (2017). Understanding re-
lationships between reading behavior and difficulty
level of musical score based on cognitive-behavioral
science - competency level evaluation via musical
score reading processes. In Proceedings of the 12th
International Joint Conference on Computer Vision,
Imaging and Computer Graphics Theory and Appli-
cations, volume 2, pages 67–74.
Suzuki, R., Akimoto, Y., and Nakahira, K. T. (2021). Dif-
ficulty estimation based on combined EEG and Eye
tracker measurements (in Japanese). The 83th Na-
tional Convention of IPSJ, pages 181–182.
Suzuki, Y., Minami, T., and Nakauchi, S. (2018). Associ-
ation between pupil dilation and implicit processing
prior to object recognition via insight. Scientific Re-
ports, 8.
Taba, N., Takara, T., and Hoshino, K. (1996). Pupillary
diameter and heart rate under active and passive stress
(in japanese). ITE Technical Report, 20(39):75–79.
Tobii-AB (2021). Are pupil size calcu-
lations possible with tobii eye track-
ers? https://www.tobiipro.com/ja/service-
support/learning-center/eye-tracking-essentials/is-
pupil-size-calculations-possible-with-tobii-eye-
trackers (accessed 2021.06.16).
Yamaguchi, K. (2008). Fmθ and alpha 2 rhythms evoked
by mental activity. Research bulletin of the Faculty of
Humanities, 29(1):67–77.
HUCAPP 2022 - 6th International Conference on Human Computer Interaction Theory and Applications
248
