
Android-based ECG Monitoring System for Atrial Fibrillation
Detection using a BITalino
®
ECG Sensor
Gabriel Saatkamp Lazaretti
1,2 a
, João Paulo Teixeira
1b
, Eduardo Vinicius Kuhn
2c
,
and Pedro Henrique Borghi
3d
1
Research Centre in Digitalization and Intelligent Robotics (CEDRI), Instituto Politécnico de Bragança (IPB), Portugal
2
Federal University of Technology - Paraná (UTFPR), Toledo, Brazil
3
Faculty of Engineering of University of Porto (FEUP), Porto, Portugal
Keywords: Android, Atrial Fibrillation, BITalino, ECG, Smartphone.
Abstract: Cardiac arrhythmias are disorders that affect the rate and/or rhythm of the heartbeats. The diagnosis of most
arrhythmias is made through the analysis of the electrocardiogram (ECG), which consists of a graphical
representation of the electrical activity of the heart. Atrial fibrillation (AF) is the most present type of
arrhythmia in the world population. In this context, this work deals with the implementation of a system for
automatic analysis of ECG signals aiming to identify AF episodes. The system consists of a signal acquisition
step performed by an ECG sensor connected to an acquisition platform. The acquired signal is transmitted via
bluetooth to a smartphone with Android
™
operating system. The signal processing is carried out through an
application developed using the IDE Android
™
Studio. When assessed over signals from the MIT-BIH Atrial
Fibrillation database, the R-wave peak detection algorithm showed mean values of sensitivity and positive
predictivity of 98.99% and 95.95%, respectively. The classification model used is based on a long short-term
memory (LSTM) neural network and had an average accuracy of 94.94% for identifying AF episodes.
1 INTRODUCTION
Cardiovascular diseases (CVDs - cardiovascular
diseases) are one of the main causes of death around
the world. According to data from the world health
organization, it is estimated that about 17.9 million
people died from some type of CVD in 2019, which
represents 32% of the deaths in the world with 85%
of them being from stroke and myocardial infarction
(commonly called heart attack) (World Health
Organization, 2021). In this context, arrhythmias are
disorders that affect the frequency and/or rhythm of
heartbeats (Antzelevitch & Burashnikov, 2011).
Among the various types of arrhythmias, atrial
fibrillation (AF) is the most common. In the European
Union, it is estimated that the number of AF cases in
the adult population over 55 years of age reached 8.8
million in 2010 (Krijthe et al., 2013). Worldwide, this
number reached the 33.5 million mark in the same
a
https://orcid.org/0000-0003-2993-5398
b
https://orcid.org/0000-0002-6679-5702
c
https://orcid.org/0000-0003-0881-4888
d
https://orcid.org/0000-0003-2918-6630
year (Chugh et al., 2014). This predominant
arrhythmia, if not treated, increases the chances of
developing an eventual cardiac arrest (Wang et al.,
2003), dementia (Ott et al., 1997), as well as strokes
(Dulli et al., 2003; Jørgensen et al., 1996; H.-J. Lin et
al., 1996; Marini et al., 2005; Wolf et al., 1991, 1998).
So, since AF is associated with an increased risk of
mortality, it deserves medical attention (Miyasaka et
al., 2007; Stewart et al., 2002).
Developed by Willem Einthoven in 1902
(AlGhatrif & Lindsay, 2012), the electrocardiogram
(ECG), which is a graphical representation of the
heart’s electrical activity, made it possible to observe
variations in the frequency and rhythm of the
heartbeats; thus, the ECG provides a way to visualize
how the electrical system of the heart behaves. In this
context, the 12-lead system is the most widely used
for diagnosing cardiac arrhythmias (Mittal et al.,
2011). Figure 1 shows a typical waveform of a
Lazaretti, G., Teixeira, J., Kuhn, E. and Borghi, P.
Android-based ECG Monitoring System for Atrial Fibrillation Detection using a BITalino
R
ECG Sensor.
DOI: 10.5220/0010905400003123
In Proceedings of the 15th International Joint Conference on Biomedical Engineering Systems and Technologies (BIOSTEC 2022) - Volume 1: BIODEVICES, pages 177-184
ISBN: 978-989-758-552-4; ISSN: 2184-4305
Copyright
c
2022 by SCITEPRESS – Science and Technology Publications, Lda. All rights reserved
177
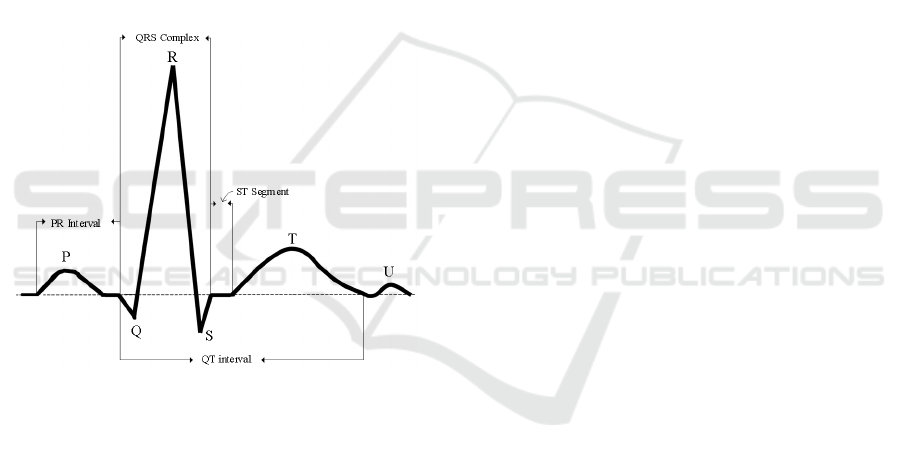
complete cardiac cycle (one beat) in an ECG signal,
consisting of a sequence of waves and complexes
called P wave, QRS complex, T wave and U wave.
The AF occurs due to the generation of multiple
electrical impulses in different regions of the atria
(ectopic foci) which cause irregular muscle cell
stimulation, resulting in ineffective or even non-
existent atrial contraction (fibrillatory behavior). The
main symptoms that may indicate the presence of AF
in the patient are the feeling of weakness, chest pain,
shortness of breath, and palpitations. However, in
some cases, AF can occur without any evident
symptoms (asymptomatically). The main features
observed in an ECG signal for diagnosing AF are:
• Irregular heart rate, i.e., unexpected changes in
the R-R interval (termed RRi) over time; and
• Absence of a clearly distinguishable P wave
which is then replaced by fibrillatory waves (F
waves).
Figure 1: Points and intervals of interest in the electrical
representation of a heartbeat.
2 PROBLEM FORMULATION
The diagnosis of CVDs, as AF, is in general
performed through the analysis of the ECG signal by
a qualified health professional. Nevertheless, due to
the advances of medical technology, computer
systems for automatic ECG analysis have been able
to assist professionals in the diagnoses of pathologies.
The use of computer-aided diagnosis systems
(CADx) becomes especially interesting in the
analysis of ECG recordings with long hours of
duration (Hagiwara et al., 2018). [Such systems
consist in general of four main sequential steps,
namely: 1) Pre-processing; 2) Segmentation;
3) Feature extraction; and 4) Classification.] Note
that, with the development of the Holter monitor in
the 1940s, methods for ambulatory and external
monitoring of the ECG (AECG -Ambulatory External
Electrocardiogram), as described in (Mittal et al.,
2011), have emerged as an important tool to perform
AF diagnosis for the 12-lead ECG.
Considering the processing capacity, portability,
and affordable price of smartphones, researchers are
proposing their use as processing devices in
automatic ECG signal analysis systems for the
diagnosis of cardiac arrhythmias. Specifically for the
detection of AF events, the “ECG Check” device,
developed by Cardiac Designs
®
, and the “Kardia
Mobile”, developed by AliveCor
®
, are examples of
professional devices which use smartphones to detect
the presence of AF events based on a single lead of
the ECG signal. The effectiveness of these devices is
discussed in (Aljuaid et al., 2020; Chan & Choy,
2017; Evans et al., 2017; Garabelli et al., 2017; T.
Hickey et al., 2017).
In this context, the present research work has the
following objectives:
• To acquire a single lead ECG signal using
3-electrode configuration;
• To transmit the signal from the acquisition
device to the processing device using bluetooth
technology;
• To assess the received signal and implement, if
necessary, a pre-processing step to remove
artifacts from the acquired signal;
• To implement a segmentation algorithm for
detecting QRS complex and R-peaks in ECG
signals;
• To extract features from the ECG signal which
will serve as input to the machine learning
model used in the classification step; and
• To implement a classification step, based on a
Long Short-Term Memory (LSTM) neural
network capable of classifying segments of
ECG signal according to their rhythm (normal
rhythm, AF, or another rhythm).
3 ECG SIGNAL ACQUISITION
AND TRANSMISSION
The ECG acquisition step is concerned with the
proper placement of electrodes and the design of a
signal conditioning system used to amplify, filter, and
digitalize the signal. Particularly, the acquisition of
the ECG signal was performed here by a BITalino
®
ECG sensor (using a 3-electrode configuration)
connected to the A1 analog port of the BITalino
®
BIODEVICES 2022 - 15th International Conference on Biomedical Electronics and Devices
178

(r)evolution Core platform, which works with a
rechargeable battery and has bluetooth technology for
transmitting the acquired signals [for details, see
(BITalino, 2021a)].
Considering the nomenclature presented in (Drew
et al., 2004), the electrodes were positioned as
follows: Positive electrode in RA; Negative electrode
on LL; Reference electrode in LA. The acquired ECG
signal is transmitted to the smartphone via bluetooth,
since both the BITalino
®
(r)evolution Core platform
and the smartphone support it. Furthermore,
bluetooth is a consolidated communication protocol
for transmitting information wirelessly over a short
distance requiring low-power consumption.
Moreover, the use of bluetooth protocol in an
Android
™
environment is made easy through some
APIs (Android, 2021). Still, the manufacturer of the
BITalino platform, PLUX - Wireless Biosignals S.A,
provides an API that makes it possible to establish
and manage the bluetooth communication [for details,
see (BITalino, 2021)]. Finally, the smartphone
receives a digital ECG signal with resolution of 10
bits (see specifications of the A1 analog port),
sampled at 100 Hz, and with a limited frequency
range between 0.5 Hz and 40 Hz (which is, to some
extent, enough to deliver a high-quality ECG signal).
In turn, the processing of the ECG signal on the
smartphone is done through 20-second windows, i.e.,
a new window containing the last 20-seconds samples
of the ECG signal is ready to be processed every 20
seconds. It is important to mention that the acquisition
of the signal is done asynchronously in relation to the
processing; so, while a 20-second window is being
processed, another one is being acquired. The first
processing step, carried out over the 20-seconds
window of the acquired signal, involves the use of the
ECG sensor transfer function (BITalino, 2021). After
applying the sensor transfer function, the signal
samples are transformed to values whose amplitude is
within the range of -1.5 mV to 1.5 mV. The signal is
then resampled to 250 Hz (using the “resample”
function of the MATLAB
®
software) to meet the
input conditions of the segmentation step used.
It is worth mentioning that the BITalino device
can acquire the ECG signal with good quality and low
noise level when the measure is done with the user at
rest. On the other hand, the signal obtained while the
user was walking contains several artifacts that end
up mischaracterizing the ECG. For this reason, the
acquisition of the signals considered in this study was
conducted with the user at rest and it was ensured that
there was good contact between the electrodes and the
skin surface at each measurement. Thereby, it was not
necessary to implement any other signal pre-
processing step in the system.
4 R-PEAK DETECTION
ALGORITHM
Figure 2 depicts a block diagram of the implemented
R-wave peak detection algorithm, which is based on
(D. Benitez et al., 2001; Kaur et al., 2019;
Manikandan & Soman, 2012). Although the same
algorithm was used and validated in the work of
(Borghi et al., 2021), some modifications were made
in the original algorithm aiming to process 20-second
windows and to port the code to the C language
through the MATAB Coder
™
application. Basically,
in this algorithm, the ECG signal is first filtered by a
480-order FIR-type bandpass filter, with a passband
between 5Hz and 15Hz, designed using the self-
convolution method of a 60th-order Hamming
window (Kaur et al., 2019). Then, the first-order
derivative of the filtered signal
()
f
n is calculated
through
'( ) ( 1) ( ).d n fn fn=+− (1)
According to (Manikandan & Soman, 2012), signal
differentiation acts as a high-pass filter to reduce
interference from P and T waves. Next,
'( )dn is
normalized as
1
'( )
()
max [ '( ) ]
N
n
dn
dn
dn
=
= (2)
where
N denotes the number of samples
corresponding to a 20-second window of the ECG
signal. The nonlinear Shannon energy (SE)
transformation is applied to
(),dn i.e.,
22
2
() ()log[ ()].
s
En d n d n=− (3)
This transformation aims to rectify and to highlight
the region of the QRS complex, facilitating the
detection of R peaks. The resulting Shannon energy
signal is smoothed by a 38-sample window moving
average filter (approximately, 152.7 ms for a
sampling frequency of 250 Hz). The Hilbert
transform is applied to the smoothed signal
(),
s
n
resulting in
().hn In turn, ()hn is applied to a
rectangular moving average filter with a duration of
625 samples, yielding
'( ).hn Then, we compute
() () '()zn hn h n=− (4)
Android-based ECG Monitoring System for Atrial Fibrillation Detection using a BITalino
R
ECG Sensor
179
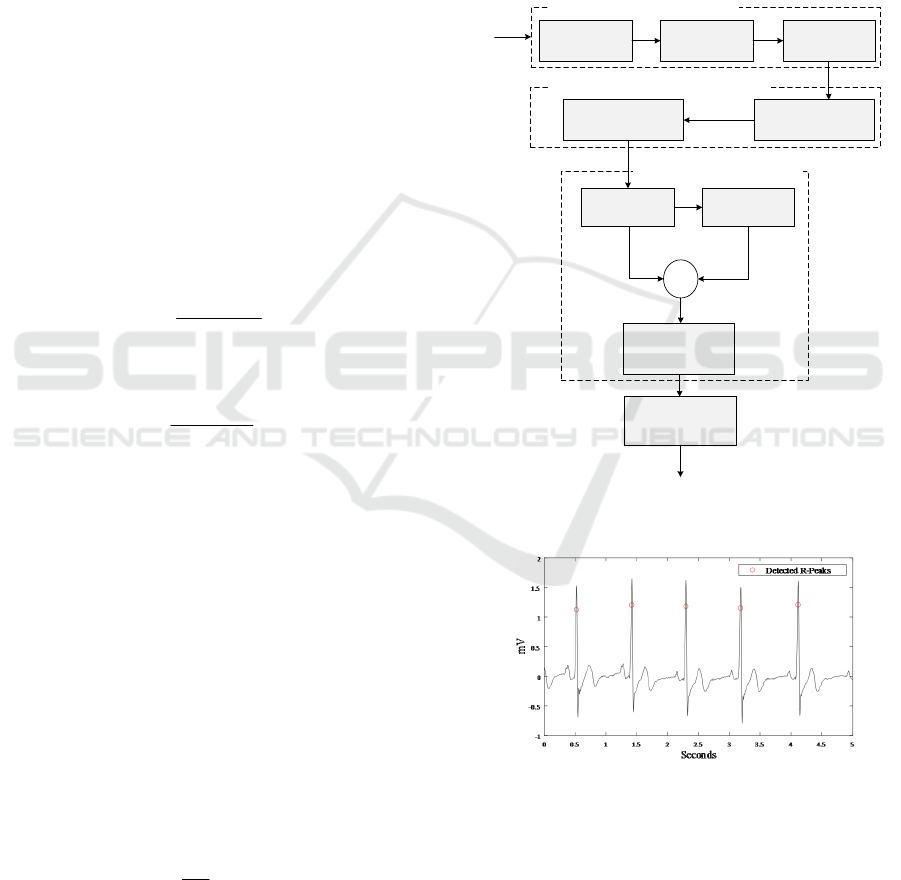
aiming to smooth out the signal and identify the lower
amplitude R-peaks. At the end of this process, a
smoothed odd symmetry signal
()zn is obtained,
where its zero-crossing point corresponds to the peak
of ( ),sn which is a strong candidate for the R-peak
position. Finally, using these candidate points as a
reference, an R-peak position detection is done by
searching for the local maximum near each candidate
point. The algorithm was validated considering the
MIT-BIH Atrial Fibrillation database (Moody &
Mark, 1992), which contains 23 recordings of ECG
signals of 10 hours each taken in patients diagnosed
with AF. Each of these recordings has two ECG
signal leads, sampled at 250 Hz, with 12-bit
resolution and with a bandwidth between 0.1 Hz and
40 Hz. Only the first lead of each recording was used
in the validation of the implemented segmentation
algorithm. The same database was used in the work
of (Borghi et al., 2020, Borghi et al., 2021) for
validating the R-peak detection algorithm, as well as
for validating the classification model.
The performance of the algorithm is shown in
Table 1 in terms of the sensitivity metric, defined as
()
TP
Se
TP FN
=
+
(5)
and positive predictivity metric, given by
()
TP
P
TP FP
+=
+
(6)
where
TP
(True Positive),
FP
(False Positive), and
FN (False Negative) indicate, respectively, the
number of labels that represent a heartbeat, the
number of labels that does not represent a heartbeat,
and the number of beats that were not marked (Luz et
al., 2016). As in (Borghi et al., 2020), it was
considered that the labeling made by the algorithm
regarding the position of the R-peak is correct if
within a context region of 150 ms centered on this
mark (75 ms before and 75 ms after) there is an
original annotation in the database. The algorithm
presents good detection results, with mean values of
Se and P+ equal to 98.99% and 95.95%, respectively.
In (Borghi et al., 2020), the segmentation
algorithm was validated using the measure of
accuracy, calculated for each subject as
100%
b
TP
ACC
N
= (7)
where
b
N represents the total number of beats
marked in the database annotations. The average
accuracy found in (Borghi et al., 2020) is 98.95%,
while the average accuracy found here is 98.99%.
These results are consistent and confirm the
effectiveness of the approach used to port the code
made in MATLAB to C language.
When the algorithm is applied to an ECG signal
acquired by the BITalino platform, the results were
validated through visual inspection. Figure 3 shows the
detection results for a 5-second signal acquired with
the user at rest. Notice that the algorithm can properly
detect the position of R-peaks in ECG signals.
Figure 2: Block diagram of the R-peak detection algorithm
adapted from (Manikandan & Soman, 2012).
Figure 3: R-peaks detected by the segmentation algorithm
with the subject at rest.
5 FEATURE EXTRACTION AND
CLASSIFICATION MODEL
Considering the position of the R-peaks properly
detected, we proceed now to the extraction of features
Bandpass
Filtering
(BPF)
First-Order Forward
Differencing
(FOFD)
Amplitude
Normalization
(AN)
ECG
Linear Digital Filtering
f (n)
d’ (n)
d (n)
s (n)
Peak-Finding Logic
Hilbert
Transformation
Moving Average
Filtering
+
-
Zero Crossing Point
Detection
z (n)
Identification of the
real R-Peak
R-Peak Position
Moving Average
Filtering
Shannon Energy
Computation
Smooth SE Envelope Extraction
BIODEVICES 2022 - 15th International Conference on Biomedical Electronics and Devices
180

Table 1: Performance of the segmentation algorithm over the signals from the MIT-BIH Atrial Fibrillation database.
that will serve as input to the classification model.
Among these features, the interval between two
consecutive R peaks is calculated from
() ( 1)
RRi=
250
nn−−
detec detec
RR
(8)
with vector
()n
detec
R containing the ECG signal
samples referring to the moment of occurrence of the
R-peaks. In a vector
'( ),nseg 60 consecutive RRi
values are stored, thus forming a segment. Each
segment
'( )nseg is then normalized with respect to
its maximum absolute value, i.e.,
60
1
()
() .
max [ ( ) ]
n
n
n
n
=
=
seg'
seg
seg'
(9)
So,
()nse
g
serves as input for the classification
model whose output can be one of the following
categories, namely: normal rhythm, AF rhythm or
other rhythm (see Figure 4). The machine learning
model selected to be used in this work was trained by
(Borghi et al., 2020) to perform heart rhythm
classification and AF event detection, based on a
bidirectional LSTM neural network. Such a model,
which contains 50 nodes in the hidden layer and needs
only the knowledge of RRi, showed an accuracy of
94.94% when validated over the MIT-BIH-Atrial
Fibrillation database in (Borghi et al., 2020). As
discussed in (Borghi et al., 2020), the RRi is the most
significant characteristic to differentiate segments
that present a normal behavior from those that exhibit
AF events. Note that, since the chosen model uses
only 60 RRi values as input features, its
implementation is not computationally expensive,
ratifying its use on a smartphone.
Figure 4: Illustration of the input and possible outputs of the
classification model.
6 ANDROID APPLICATION
When launching the app, the user is asked to activate
the smartphone's bluetooth function. Once the
bluetooth is activated, it is needed to turn on the
BITalino platform and press the “Connect” button on
the smartphone screen. If the BITalino platform is
within the range of bluetooth communication, the
platform name and Media Access Control (MAC)
address will be displayed on the application screen
and, when selecting it, the connection will be
established (see Figure 5). Once the smartphone is
connected to the BITalino platform, a graphical
interface is presented to the user, in which it is
possible to visualize the ECG signal, the connection
status between the smartphone and the BITalino
platform, the name, and MAC address of the
platform. Still, three buttons are visible, one named
“Disconnect” that allows user to disconnect the
platform and smartphone, another named “Find R
Peaks”, and a third one named “Screen for AF”.
When the connection status between the platform and
the smartphone is indicated on the screen as
“CONNECTED”, the user can click on either of the
two processing buttons. Note that the electrodes need
to be properly placed on the body of the user.
SUBJECT Se(%) P+(%) SUBJECT Se(%) P+(%) SUBJECT Se(%) P+(%)
1
98,62 95,24
9
97.79 96,25
18
99,54 96,75
2
99,69 97,1
10
99,58 95,98
19
98,49 96,11
3
99,71 92,03
11
98,49 96,12
20
99,99 97,49
4
98,42 95,02
12
99.93 98,09
21
99,67 96,64
5
99,78 96,55
13
99,83 96,88
22
99,81 96,49
6
99,87 97,35
15
92,64 90,24
23
99,43 97,21
7
99,75 96,37
16
99,6 96,48
8
98,97 94,49
17
99,95 95,84
98,99
Mean P + (% )
95,95
Mean S e (% )
Classification
Model
(LSTM)
{seg[1]; seg[2]; seg[3]; … seg[60]}
Normal Rhythm
AF Rhythm
Other Rhythm
Android-based ECG Monitoring System for Atrial Fibrillation Detection using a BITalino
R
ECG Sensor
181

6.1 Segmentation Functionality
By clicking the “Find R-peaks” button, the
application starts the ECG signal segmentation
function. This function analyzes 60 seconds (3
windows of 20 seconds) of the ECG signal and
detects R-peaks. Meanwhile, it is possible to visualize
in real-time the signal being acquired. The
visualization of the ECG signal on the smartphone
screen is not restricted to the segmentation
functionality. At the end of the measurement, the
application notifies the user about how many beats
were detected and stores the signal and the
annotations regarding the position of the founded R-
peaks in a text file saved in the memory of the
smartphone. This functionality only performs the
segmentation of the ECG signal and does not apply
any classification regarding the rhythm of the
acquired signal.
Figure 5: Graphical interface of the application during the
ECG signal acquisition.
6.2 Quick Check Functionality
By clicking on the “Screen for AF” button, two
options to search for AF episodes are presented to the
user. In the first one, called “Quick check”, the
application will collect one segment with 60 values of
RRi and classify it according to its rhythm. Every 20
seconds, the R-wave peak detection algorithm is
executed and the detected peaks are counted. The
acquisition is interrupted when the system detects the
presence of 61 R-peaks. (The number of 20-second
windows needed depends on the heart rate of the
user.) From these 61 R-peaks, 60 RRi are calculated
to yield a segment which serves as input for the
classification model. The system then classifies the
segment into one of the possible categories (see
Figure 4). At the end of the analysis, the user is
notified with a message that depends on the
classification results. As in the segmentation
functionality, the analyzed ECG signal, the position
of the R-peaks, and the classification results are saved
in a text file in the memory of the smartphone.
6.3 Continuous Monitoring
Functionality
The continuous monitoring function, named
“Monitor”, starts the acquisition of the ECG signal
and segments each new 20-second window available.
Upon detecting the presence of 61 R-peaks, the
application generates a 60 RRi segment, and
classifies it into the 3 possible rhythms (as described
in Figure 4). In this functionality, the acquisition is
not interrupted after the classification of the first
segment, i.e., the system continues acquiring signal
until the user clicks on the “Stop Monitoring” button.
Therefore, this type of monitoring allows collecting
the ECG signal for an indefinite period and
classifying multiple segments, as long as the
bluetooth communication between the platform and
the smartphone is maintained. The construction of
segments is made considering an overlap of about 50
RRi such that each RRi is analyzed more than once in
different segments, reducing the probability of
misclassification. At the end of continuous
monitoring, i.e., when the user clicks on “Stop
Monitoring”, a notification will be presented to the
user regarding the duration of the signal and the
classification results. The acquired signal, the
position of the detected R-peaks, and the results of the
rhythm classification are saved in a text file stored in
the memory of the smartphone. Lastly, it is important
to remark that a MATLAB function (called
“app2mat”) used to read the text file stored in the
memory of the smartphone and a video demonstrating
the use of the developed application are available in
(Lazaretti, G.S. et al., 2021).
7 CONCLUSIONS
A system capable of performing the automatic
analysis of an ECG signal and detecting the presence
of AF episodes was implemented. The application
was developed using the Android
™
Studio IDE and
BIODEVICES 2022 - 15th International Conference on Biomedical Electronics and Devices
182

the processing steps were developed and validated
using MATLAB
®
. The processing functions and
routines were ported to C language through the
MATLAB Coder
™
and integrated into the application
written in Java programming language through the
JNI interface. Note that the implementation
methodology adopted here makes it possible to
implement changes to existing functions and/or to
include new processing functions, which can be done
first using MATLAB
®
. So, this methodology saves
implementation time and allows testing new
processing techniques.
Regarding the acquisition of the signals, it was
verified that the ECG sensor and BITalino platform,
when used with the subject at rest, can deliver to the
smartphone, through the BITalino API, an ECG
signal with good quality. On the other hand, when the
subject is in motion, artifacts were observed in the
acquired signal. Therefore, a pre-processing step
should be implemented aiming the use of this
application in the ambulatory monitoring of patients.
As presented in (Borghi et al., 2020), one of the
most important characteristics for identifying AF
events is the RRi. Despite this aspect, Borghi noted
that the inclusion of information about the P and T
waves of the ECG signal as input characteristics for
the classification model increases the classifier
accuracy (going from 94.94% to 98.17 %). So, the
accuracy of the proposed system could be improved
by replacing the classification model used by another
one that operates also with input characteristics
extracted from P, T and U waves.
In future research works, the application could be
redesigned such that it can operate even when
minimized. Furthermore, adaptations could be made
to include the application in a telemedicine system. In
this sense, the application could then send data and
results to a server, becoming thus available to a health
professional. Still, greater processing capacity can be
exploited and new analysis of the signal could be
carried out using sophisticated algorithms.
New processing functions can be implemented in
the application, since an interesting workflow was
developed that allows adding any function written
using MATLAB. So, the developed application
allows quick implementation and validation of other
ECG signal processing algorithms. Furthermore, it is
possible to evaluate the performance of these
algorithms dealing with real ECG signals acquired by
the BITalino sensor and platform. These
characteristics, along with the integration between the
MATLAB
®
and the Android
™
Studio platform
through the MATLAB Coder
™
and the JNI interface,
are, therefore, the main contributions of this work.
ACKNOWLEDGEMENTS
This work has supported by Fundação para a Ciência
e Tecnologia within the Project Scope:
UIDB/05757/2020, and by the European Regional
Development Fund (ERDF) through the Operational
Programme for Competitiveness and
Internationalization (COMPETE 2020), under
Portugal 2020 in the framework of the NanoID
(NORTE-01-0247-FEDER-046985) Project.
REFERENCES
AlGhatrif, M., & Lindsay, J. (2012). A brief review: history
to understand fundamentals of electrocardiography.
Journal of Community Hospital Internal Medicine
Perspectives, 2(1). https://doi.org/10.3402/jchimp.v2
i1.14383
Aljuaid, M., Marashly, Q., AlDanaf, J., Tawhari, I.,
Barakat, M., Barakat, R., Zobell, B., Cho, W., Chelu,
M. G., & Marrouche, N. F. (2020). Smartphone ECG
monitoring system helps 54 lower emergency room and
clinic visits in post–atrial fibrillation ablation patients.
Clinical Medicine Insights: Cardiology, 14.
https://doi.org/10.1177/1179546820901508
Android. (2021, May 19). Bluetooth overview.
https://developer.android.com/guide/topics/connectivit
y/bluetooth
Antzelevitch, C., & Burashnikov, A. (2011). Overview of
basic mechanisms of cardiac arrhythmia. Cardiac
Electrophysiology Clinics, 3(1), 23–45. https://doi.org/
10.1016/J.CCEP.2010.10.012
Benitez, D., Gaydecki, P. A., Zaidi, A., & Fitzpatrick, A. P.
(2001). The use of the Hilbert transform in ECG signal
analysis. Computers in Biology and Medicine, 31(5).
https://doi.org/10.1016/S0010-4825(01)00009-9
BITalino. (2021a). Documentation. Available at:
https://bitalino.com/documentation
BITalino. (2021b). Custom software. Available at:
https://bitalino.com/downloads/apis
Borghi, P. H., Teixeira, J. P., & Borges, R. C. (2020).
Classificação de episódios de fibrilação atrial por
análise do ECG com redes neuronais artificiais MLP e
LSTM. Master Thesis in Instituto Politécnico de
Bragança.
Borghi, P. H., Teixeira, J. P., & Borges, R. C. (2021). Atrial
fibrillation classification based on MLP networks by
extracting Jitter and Shimmer parameters. Procedia
Computer Science – Elsevier, 181, pp. 931-939.
https://doi.org/10.1016/j.procs.2021.01.249.
Chan, N., & Choy, C. (2017). Screening for atrial
fibrillation in 13 122 Hong Kong citizens with
smartphone electrocardiogram. Heart, 103(1).
https://doi.org/10.1136/heartjnl-2016- 309993
Chugh, S. S., Havmoeller, R., Narayanan, K., Singh, D.,
Rienstra, M., Benjamin, E. J., Gillum, R. F., Kim, Y.-
H., McAnulty, J. H., Zheng, Z.-J., Forouzanfar, M. H.,
Android-based ECG Monitoring System for Atrial Fibrillation Detection using a BITalino
R
ECG Sensor
183

Naghavi, M., Mensah, G. A., Ezzati, M., & Murray, C.
J. L. (2014). Worldwide epidemiology of atrial
fibrillation. Circulation, 129(8). https://doi.org/
10.1161/CIRCULATIONAHA.113.005119
Drew, B. J., Califf, R. M., Funk, M., Kaufman, E. S.,
Krucoff, M. W., Laks, M. M., Macfarlane, P. W.,
Sommargren, C., Swiryn, S., & van Hare, G. F. (2004).
Practice Standards for Electrocardiographic Monitoring
in Hospital Settings. Circulation, 110(17).
https://doi.org/10.1161/01.CIR.0000145144.56673.59
Dulli, D. A., Stanko, H., & Levine, R. L. (2003). Atrial
fibrillation is associated with severe acute ischemic
stroke. Neuroepidemiology, 22(2). https://doi.org/
10.1159/000068743
Evans, G. F., Shirk, A., Muturi, P., & Soliman, E. Z. (2017).
Feasibility of using mobile ECG recording technology
to detect atrial fibrillation in low-resource settings.
Global Heart, 12(4). https://doi.org/10.1016/j.gheart.20
16.12.003
Garabelli, P., Stavrakis, S., & Po, S. (2017). Smartphone-
based arrhythmia monitoring. Current Opinion in
Cardiology, 32(1). https://doi.org/10.1097/HCO.0000
000000000350
Hagiwara, Y., Fujita, H., Oh, S. L., Tan, J. H., Tan, R. S.,
Ciaccio, E. J., & Acharya, U. R. (2018). Computer-
aided diagnosis of atrial fibrillation based on ECG
Signals: A review. Information Sciences, 467.
https://doi.org/10.1016/j.ins.2018.07.063
Jørgensen, H. S., Nakayama, H., Reith, J., Raaschou, H. O.,
& Olsen, T. S. (1996). Acute stroke with atrial
fibrillation: The Copenhagen Stroke Study. Stroke,
27(10). https://doi.org/10.1161/01.STR.27.10.1765
Kaur, A., Agarwal, A., Agarwal, R., & Kumar, S. (2019).
A novel approach to ECG R-Peak detection. Arabian
Journal for Science and Engineering, 44(8).
https://doi.org/10.1007/s13369-018-3557-8
Krijthe, B. P., Kunst, A., Benjamin, E. J., Lip, G. Y. H.,
Franco, O. H., Hofman, A., Witteman, J. C. M.,
Stricker, B. H., & Heeringa, J. (2013). Projections on
the number of individuals with atrial fibrillation in the
European Union, from 2000 to 2060. European Heart
Journal, 34(35). https://doi.org/10.1093/eurheartj/
eht280
Lazaretti, G. S., Kuhn, E. V e Teixeira, J. P. R. (29 October
2021). Illustrative video of the use of the application
and function to read the stored variables [Online].
Available at: http://lapse.td.utfpr.edu.br/downloads/
TCC_Lazaretti_2021.zip
Lin, H.-J., Wolf, P. A., Kelly-Hayes, M., Beiser, A. S.,
Kase, C. S., Benjamin, E. J., & D’A ostino, R. (1996).
Stroke severity in atrial fibrillation. Stroke, 27(10).
https://doi.org/10.1161/01.STR.27.10.1760
Luz, E. J. da S., Schwartz, W. R., Cámara-Chávez, G., &
Menotti, D. (2016). ECG-based heartbeat classification
for arrhythmia detection: A survey. Computer Methods
and Programs in Biomedicine, 127. https://doi.org/
10.1016/j.cmpb.2015.12.008
Manikandan, M. S., & Soman, K. P. (2012). A novel
method for detecting R-peaks in electrocardiogram
(ECG) signal. Biomedical Signal Processing and
Control, 7(2). https://doi.org/10.1016/j.bspc.20
11.03.004
Marini, C., De Santis, F., Sacco, S., Russo, T., Olivieri, L.,
Totaro, R., & Carolei, A. (2005). Contribution of atrial
fibrillation to incidence and outcome of ischemic
stroke. Stroke, 36(6). https://doi.org/10.1161/
01.STR.0000166053.83476.4a
Mittal, S., Movsowitz, C., & Steinberg, J. S. (2011).
Ambulatory external electrocardiographic monitoring.
Journal of the American College of Cardiology, 58(17).
https://doi.org/10.1016/j.jacc.2011.07.026
Miyasaka, Y., Barnes, M. E., Bailey, K. R., Cha, S. S.,
Gersh, B. J., Seward, J. B., & Tsang, T. S. M. (2007).
Mortality trends in patients diagnosed with first atrial
fibrillation. Journal of the American College of
Cardiology, 49(9). https://doi.org/10.1016/j.jacc.20
06.10.062
Moody GB, Mark RG. MIT-BIH Atrial fibrillation
Database 1992. https://doi.org/10.13026/C2MW2D.
Ott, A., Breteler, M. M. B., de Bruyne, M. C., van
Harskamp, F., Grobbee, D. E., & Hofman, A. (1997).
Atrial fibrillation and dementia in a population-based
study. The Rotterdam Study. Stroke, 28(2).
https://doi.org/10.1161/01.STR.28.2.316
Stewart, S., Hart, C. L., Hole, D. J., & McMurray, J. J. V.
(2002). A population-based study of the long-term risks
associated with atrial fibrillation: 20-year follow-up of
the Renfrew/Paisley study. The American Journal of
Medicine, 113(5). https://doi.org/10.1016/S0002-
9343(02)01236-6
T. Hickey, K., B. Biviano, A., Garan, H., Sciacca, R. R.,
Riga, T., Warren, K., Frulla, A. P., Hauser, N. R.,
Wang, D. Y., & Whang, W. (2017). Evaluating the
utility of mHealth ECG heart monitoring for the
detection and management of atrial fibrillation in
clinical practice. Journal of Atrial Fibrillation, 9(5).
https://doi.org/10.4022/jafib.1546
Wang, T. J., Larson, G., Levy, D., Vasan, R. S., Leip, E. P.,
Wolf, P. A., D’Agostino, R. B., Murabito, J. M.,
Kannel, W. B., & Benjamin, E. J. (2003). Temporal
relations of atrial fibrillation and congestive heart
failure and their joint influence on mortality.
Circulation, 107(23). https://doi.org/10.1161/01.CIR.0
000072767.89944.6E
Wolf, P. A., Abbott, R. D., & Kannel, W. B. (1991). Atrial
fibrillation as an independent risk factor for stroke: the
Framingham Study. Stroke, 22(8).
https://doi.org/10.1161/01.STR.22.8.983
Wolf, P. A., Mitchell, J., Baker, C. S., Kannel, W., &
D’Agostino, R. B. (1998). Impact of atrial fibrillation
on mortality, stroke, and medical costs. Archives of
Internal Medicine, 158(3). https://doi.org/10.1001/
archinte.158.3.229
World Health Organization. (2021, June 11).
Cardiovascular diseases (CVDs). https://www.who.int/
news-room/fact-sheets/detail/cardiovascular-diseases-
(cvds)
BIODEVICES 2022 - 15th International Conference on Biomedical Electronics and Devices
184
