
COVID-19 Diagnosis using Single-modality and Joint Fusion Deep
Convolutional Neural Network Models
Sara El-Ateif
a
and Ali Idri
Software Project Management Research Team, ENSIAS, Mohammed V University in Rabat, Morocco
Keywords: Joint Fusion, Multimodality, Deep Convolutional Neural Networks, COVID-19, Computer Tomography,
Chest X-ray.
Abstract: COVID-19 is a recently emerged pneumonia disease with threatening complications that can be avoided by
early diagnosis. Deep learning (DL) multimodality fusion is rapidly becoming state of the art, leading to
enhanced performance in various medical applications such as cognitive impairment diseases and lung cancer.
In this paper, for COVID-19 detection, seven deep learning models (VGG19, DenseNet121, InceptionV3,
InceptionResNetV2, Xception, ResNet50V2, and MobileNetV2) using single-modality and joint fusion were
empirically examined and contrasted in terms of accuracy, area under the curve, sensitivity, specificity,
precision, and F1-score with Scott-Knott Effect Size Difference statistical test and Borda Count voting method.
The empirical evaluations were conducted over two datasets: COVID-19 Radiography Database and COVID-
CT using 5-fold cross validation. Results showed that MobileNetV2 was the best performing and less sensitive
technique on the two datasets using mono-modality with an accuracy value of 78% for Computed
Tomography (CT) and 92% for Chest X-Ray (CXR) modalities. Joint fusion outperformed mono-modality
DL techniques, with MobileNetV2, ResNet50V2 and InceptionResNetV2 joint fusion as the best performing
for COVID-19 diagnosis with an accuracy of 99%. Therefore, we recommend the use of the joint fusion DL
models MobileNetV2, ResNet50V2 and InceptionResNetV2 for the detection of COVID-19. As for mono-
modality, MobileNetV2 was the best in performance and less sensitive model to the two imaging modalities.
1 INTRODUCTION
COVID-19 is a 2019 pneumonia coronavirus disease
that has affected 2.7 million people and caused over
46 000 new deaths as of the week of 19 October 2021
(Weekly epidemiological update on COVID-19 - 19
October 2021, n.d.). The current gold standard for
COVID-19 diagnosis is the reverse transcription–
polymerase chain reaction but it is expensive and its
sensitivity is not satisfactory (Goudouris, 2021).
Other imaging modalities are used : CT that is quite
effective for early diagnosis but expensive and Chest
X-Ray (CXR) that is cost-effective and widely
available but has limited sensitivity in early stage
infection (Aljondi & Alghamdi, 2020). Several
single-modality DL research works have been
conducted that showcase the power of DL in COVID-
19 diagnosis. Additionally, most of these works use
CT and CXR for its diagnosis as found in (Islam et
al., 2021) review. Meanwhile, very few works using
a
https://orcid.org/0000-0003-1475-8851
multimodality fusion have been conducted for
COVID-19 diagnosis (Rahimzadeh & Attar, 2020;
Wu et al., 2020; Xu et al., 2021; Zhang et al., 2021;
Zhou et al., 2021). Multimodality fusion learning
consists of exploiting the complementary information
provided by each modality to improve the
performance of the DL models. Three different fusion
strategies exist: early fusion, joint fusion and late
fusion (S. C. Huang et al., 2020). Early fusion is the
process of joining different input modalities and
feeding the resulting feature vector into a machine
learning (ML) model for training. Joint fusion though,
consists of extracting features from the input
modalities and feeding their joint representation to
another model for further learning. The main
difference with early fusion, is that the loss still gets
propagated to the feature extracting neural network
during training for better feature representation.
Finally, late fusion refers to the process of fusing the
different predictions output from the learning models
160
El-Ateif, S. and Idri, A.
COVID-19 Diagnosis using Single-modality and Joint Fusion Deep Convolutional Neural Network Models.
DOI: 10.5220/0010897100003123
In Proceedings of the 15th International Joint Conference on Biomedical Engineering Systems and Technologies (BIOSTEC 2022) - Volume 2: BIOIMAGING, pages 160-167
ISBN: 978-989-758-552-4; ISSN: 2184-4305
Copyright
c
2022 by SCITEPRESS – Science and Technology Publications, Lda. All rights reserved

of different modalities to provide a final decision. For
COVID-19, (Wu et al., 2020) introduced multi-view
fusion (early fusion) using a modification of
ResNet50 architecture and three-view (axial, coronal
and sagittal views) images of CT. In (Rahimzadeh &
Attar, 2020) they used CXR images to detect COVID-
19, pneumonia and normal cases and proposed a
system that concatenates the features extracted in
parallel by Xception and ResNet50V2 then fed them
to a convolutional neural network (CNN) layer for
further learning (i.e. joint fusion). Recently, (Zhou et
al., 2021) proposed a system that learns the impact of
clinical features using High-order Factorization
Network (HoFN), and processes the CT images using
an attention-based deep convolutional neural network
with pre-trained parameters. Finally, a loss function
is designed to shift deep features of both modality into
the same feature space. Meanwhile, (Zhang et al.,
2021) introduced an end-to-end multiple-input deep
convolutional attention network (MIDCAN) by using
the convolutional block attention module (CBAM)
that can handle CT and CXR images simultaneously
and employs multiple-way data augmentation to
overcome the overfitting problem. Additionally, (Xu
et al., 2021) (late fusion) using CT scans, clinical
information and lab testing results extracted a 10-
feature high-level representation of CT scans using a
customized ResNet. Then they developed three
machine learning models (i.e. k-nearest neighbour,
random forest, and support vector machine (SVM))
for the multinomial classification task. This study
aims to evaluate and compare the performance of
joint fusion DL models with mono-modality DL
models using the most recent and frequent seven DL
techniques (VGG19 (Simonyan & Zisserman, 2014),
ResNet50V2 (He et al., 2016), DenseNet121 (G.
Huang et al., 2017), InceptionV3 (Szegedy et al.,
2016), InceptionResNetV2 (Szegedy et al., 2017),
Xception (Chollet, 2016) and MobileNetV2 (Sandler
et al., 2018)) for COVID-19 classification based on
accuracy, sensitivity, specificity, precision, F1-score,
and area under the curve (AUC) over two datasets:
COVID-19 Radiography Database (COVID-19
Radiography Database | Kaggle, n.d.) and COVID-
CT (Yang et al., 2020). Moreover, we use the Scott-
Knott Effect Size Difference (SK ESD)
(Tantithamthavorn et al., 2019) statistical test to find
the best statistically different groups of DL
techniques with non-negligible differences. While we
use the Borda Count voting method (Emerson, 2013)
to rank the best techniques selected by the SK ESD
test (Elmidaoui et al., 2020). The study explores four
research questions:
(RQ1): What is the overall performance of DL models
using mono-modality in COVID-19
classification? Is there any mono-modality DL
architecture that outperforms the others?
(RQ2): How does a modality impact the diagnostic
performance of a DL architecture?
(RQ3): What is the overall performance of DL models
using joint fusion strategy in COVID-19
classification?
(RQ4): How do joint fusion DL architectures perform
in comparison with mono-modality DL
models?
The rest of the paper is structured as follows.
Section II the data preparation process followed.
Section III describes the experimental process.
Section IV presents and discusses the results. Finally,
Section V highlights the conclusion and future
direction of this study.
2 DATA PREPARATION
We used two datasets to train our models: COVID-19
Radiography Database and COVID-CT. In the
following we provide description of these datasets
and some of the preprocessing performed to prepare
the data for training.
COVID-19 Radiography Database (COVID-19
Radiography Database | Kaggle, n.d.): or COVID19
CXR is a database released by researchers from Qatar
and Dhaka Universities along with their collaborators
from Pakistan and Malaysia. We took 349 CXR
COVID-19 from the 3616 positive cases provided
along with 397 from the 10192 normal ones (i.e. no
chest disease reported) to balance with the COVID-
CT (Yang et al., 2020) dataset available cases.
COVID-CT (Yang et al., 2020): Or COVID19
CT, a dataset containing 349 CT images of COVID-
19 cases and 397 normal cases collected from 216
patients from COVID-19 related papers.
Note that we refer to the COVID19 CT and CXR
datasets as a whole as COVID19 when joining the CT
and CXR modalities. As for preprocessing, the
images of the CT, CXR modalities were resized to
224x224 pixels and preprocessed using the
preprocess input function from the TensorFlow 2.0
library depending on each model. Furthermore, we
applied data augmentation to these modalities during
training but only for the single-modality DL models
and not for the joint fusion DL models. It consisted
of: an horizontal flip, height and width shift of value
0.1, 20° rotation, then shear and zoom of value 0.1.
COVID-19 Diagnosis using Single-modality and Joint Fusion Deep Convolutional Neural Network Models
161

3 EXPERIMENTAL SETUP
This section presents the experimental setup of
followed in this study. First, we go over the
evaluation metrics used to evaluate the DL models.
Second, we define the statistical test Scott Knott ESD
and voting method Borda Count used to cluster the
DL techniques according to their accuracy and to rank
the best SK ESD techniques according to precision,
AUC, sensitivity, specificity and F1-score. Third, we
detail the training and testing process followed to
train single and joint fusion DL models. Fourth, we
explain the experimental process carried out to
generate all of the empirical evaluations. Finally, we
go over the acronyms that were chosen to shorten the
names of the DL methods.
3.1 Evaluation Metrics
In this study, we trained and evaluated the DL
techniques using 5-fold cross validation (CV) and
reported the average of the performance metrics
during the five iterations of each DL technique.
Moreover, we used six metrics to evaluate the
performance of the trained DL models: accuracy,
AUC score, sensitivity, specificity, precision and F1
score. These six metrics are defined by means of
Eqs.1–5 respectively:
Accuracy (A) =
(1)
Sensitivity = Recall (S)=
(2)
Specificity (Sp) =
(3)
Precision (P) =
(4)
F1 = 2
×
(5)
where: TP: diseased case is identified as diseased.
FP: diseased case identified as normal. TN: normal
case identified as normal, and FN: normal identified
as diseased.
3.2 SK ESD Statistical Test and Borda
Count Method
Scott Knott ESD (Elmidaoui et al., 2020): A variant
of the Scott-Knott test, is a multiple comparison
method that uses hierarchical clustering to divide a set
of treatment averages (e.g., means) into statistically
distinct groups with non-negligible differences.
Borda Count (Emerson, 2013): A voting method
used to determine the winner among several
candidates by distributing points to a set of candidates
based on their ranking: 1 point for last choice, 2 points
for the second-to-last choice, and so on until the top
is reached. These point values are totalled, and the
winner is the candidate with the largest total point.
We use this method to figure out the best DL models
based on the five performance metrics, considered as
voters, (i.e. precision, AUC, sensitivity, specificity,
F1-score) with equal weights.
3.3 Training and Testing Processes
We train seven ImageNet pretrained DL models on
the three datasets using both single-modality and joint
fusion approach. The seven models are: VGG19,
Dense-Net121, InceptionV3, InceptionResNetV2,
Xception, ResNet50V2, MobileNetV2. All of these
seven models are CNN based they differ in the
number of layers and are an improvement to their
predecessors. VGG19 (Simonyan & Zisserman,
2014) has 19 hidden layers with 16 convolutional
layers and three fully connected layers. ResNet50V2
(He et al., 2016) a residual network model with 50
layers and a lightweight version of ResNet.
DenseNet121 (G. Huang et al., 2017) is similar to
ResNet but uses dense blocks instead of the residuals
and has 121 layers. InceptionV3 (Szegedy et al.,
2016) and InceptionResNetV2 (Szegedy et al., 2017)
both are part of the Inception family with 42 layers
and 164 layers respectively. Xception (Chollet, 2016)
a 71 layers CNN model that replaces the Inception
modules with depth wise separable convolutions.
Finally MobileNetV2 (Sandler et al., 2018), is a 53
layers CNN designed for mobile devices and based
on inverted residual structure. We first train single
modality models and then we leverage the saved
weights from these models and train the joint fusion
DL models. During training within the 5-fold CV we
split the datasets into 60% for training, 20%
validation and 20% for testing. Additionally, we use
early stopping and reduce learning rate on plateau to
avoid overfitting with a batch size of 32. For the loss
we use binary cross entropy along with binary
accuracy. All of the models are trained using
Colaboratory GPU from Google. The models
implementation comes from the TensorFlow 2.0.
Meanwhile, the performance metrics
implementations are taken from the scikit-learn 1.0
BIOIMAGING 2022 - 9th International Conference on Bioimaging
162

library. Further details about mono-modality and joint
fusion DL models training are provided below.
3.3.1 Mono-modality
We load each model with the ImageNet weights. We
fine-tune VGG-19 as it is the least complex model by
freezing the first 18 layers and unfreezing the 19th
layer for further training. Then we add the
classification network consisting of: Flatten layer,
Dropout (with probability = 0.5), two Dense layers
with 1024 and 256 nodes respectively and ReLU as
activation function and the final output layer with
sigmoid as activation function. For the optimizer we
use Adam with a learning rate of 1e-6. For all of the
models the epoch is set to 100. For the DenseNet121,
InceptionV3, InceptionResNetV2, Xception,
ResNet50V2 and MobileNetV2 no fine-tuning is
performed we simply add the following classification
network: Global average pooling 2D, Dropout (with
probability = 0.5), Dense layer of 1024 nodes and
ReLU as activation function and the final output layer
with sigmoid as activation function. As for the
optimiser we use RMSprop with default parameters.
3.3.2 Joint Fusion
We first load the saved weights from the trained
mono-modality models. Then using the last
convolutional layer from the DL model we extract the
features from each modality (CT and CXR
respectively). Second, we concatenate the resulting
features from each modality into one feature matrix.
After that, we feed the concatenated features into a
simple CNN model containing: Conv 2D layer with
16 filters, kernel size of 2 and ReLU as activation
function. Followed by a Max Pooling 2D layer (pool
size = 2), Flatten layer, Dense layer (16 nodes and
ReLU as activation function) and output layer with
sigmoid as activation function. The optimizer used is
Adam with 1e-3 as the learning rate. The models are
set to train for 10 epochs. This process applies to all
of the seven DL models we trained in mono-modality.
3.4 Empirical Process
Following the methodology of Elmidaoui et al.
(Elmidaoui et al., 2020) we:
1. Assessed the performances of the mono-
modality and joint fusion deep learning models
in terms of accuracy, AUC, precision,
sensitivity, specificity and F1-score using a 5-
fold CV.
2. Clustered the mono-modality and joint fusion
DL techniques using Scott-Knott ESD based on
accuracy to select the best SK ESD cluster.
3. Ranked the mono-modality and joint fusion DL
techniques of the best SK ESD cluster using the
Borda Count method based on the five
performance measures (AUC, precision,
sensitivity, specificity, F1-score) and picked the
top deep learning model(s).
3.4 Abbreviations
The following naming guidelines are intended to
assist the reader and shorten the names of the deep
learning techniques used. For each mono-modality
trained model, we shorten the name of each DL
approach as follows: VGG19 to VG19, DenseNet121
to DN121, InceptionV3 to Iv3, InceptionResNetV2 to
IRv2, Xception to Xcep, Res-Net50V2 to R50v2,
MobileNetV2. When comparing mono-modality DL
models with joint fusion DL models, we add the
acronym "JF" to the models' abbreviations.
4 RESULTS AND DISCUSSION
This section presents and discusses the results of the
empirical evaluations of the seven DL architectures:
VGG19, DenseNet121, InceptionV3,
InceptionResNetV2, Xception, ResNet50V2,
MobileNetV2 with mono-modality and joint fusion
multimodality approaches trained on two datasets:
COVID19 CT and COVID19 CXR. It is structured in
order to address RQ1, RQ2, RQ3 and RQ4 as stated
in the following:
• (RQ1): Six measures were used to assess the
DL models' performance: accuracy, AUC,
sensitivity, specificity, precision, and F1-
score. We use the SK ESD statistical test to
cluster the DL models trained per modality for
each dataset for the mono-modality models.
Then, for each dataset, we choose the best
cluster per modality. In addition, the Borda
Count ranks of the DL models belonging to the
best SK ESD cluster are computed. We
calculate the sum of each DL technique's
derived SK ESD ranks to analyze its
performance across the accessible modalities
(SR). We calculate the sum of the differences
of the rankings (SDR) of each DL approach
across modalities to examine its sensitivity
across the available modalities. This allows
for the greatest and least accurate/sensitive DL
COVID-19 Diagnosis using Single-modality and Joint Fusion Deep Convolutional Neural Network Models
163
approaches to be highlighted based on existing
modalities.
• (RQ2): The impact of each modality on the
diagnosis performance of a DL technique is
evaluated and discussed. To do this, we
clustered all of the modalities and DL
approaches for each dataset using the SK ESD
statistical test based on accuracy values.
Following that, Borda Count was used to rank
the best cluster's modality-technique
combinations.
• (RQ3): As for the joint fusion DL models, we
used the same process as of the mono-
modality models (RQ1) to evaluate and
compare them.
• (RQ4): We perform a comparison between
mono-modality and joint fusion DL models
using SK ESD test and Borda Count based on
the six performance criteria to figure out what
models are best to diagnose COVID-19.
4.1 Evaluating and Comparing
Mono-modality Techniques (RQ1)
Table 1 reports the mean values of the 5-fold CV six
metrics (sensitivity, specificity, precision, F1-score,
AUC and accuracy) of the seven DL techniques using
each modality of the two datasets COVID19 CT and
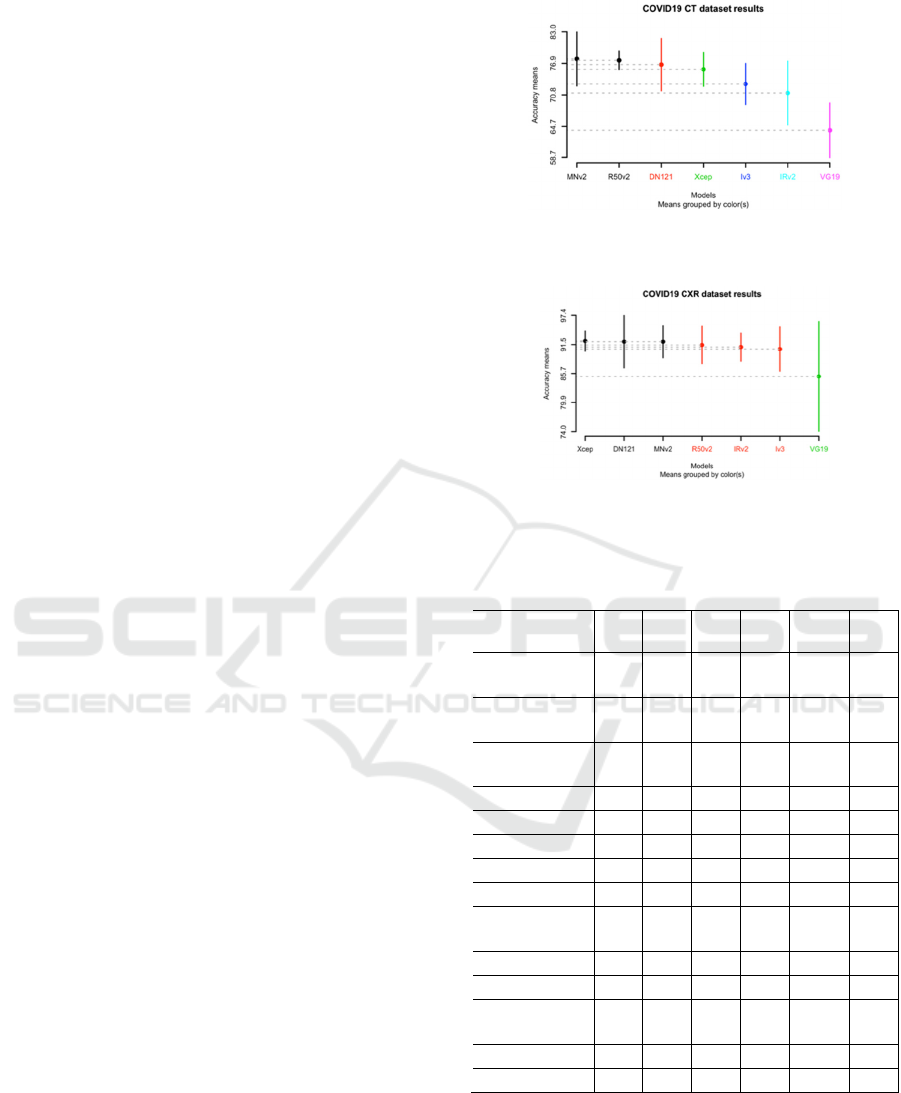
COVID19 CXR. Figure 1 and 2 show the SK ESD
results based on accuracy for COVID19 CT and
COVID19 CXR datasets respectively. Table 2 shows
the Borda Count ranks based on sensitivity,
specificity, precision, F1-score, and AUC of the DL
techniques belonging to the SK ESD best cluster of
the two datasets. Finally, Tables 3 present the ranks
of each DL technique according to each modality and
the values of SR and SDR of COVID19 modalities.
Hereafter, our observations.
Figure 1 and 2 show that: (1) for the CT modality
we obtained six clusters and for the CXR modality we
have only three clusters. (2) The best cluster of the CT
modality contains two models: MobileNetV2
(accuracy = 78%) and ResNet50V2 (accuracy =
77%). (3) The best cluster of the CXR modality has
three models: Xception (accuracy = 92%),
DenseNet121 and MobileNetV2 both with an
accuracy of 92% as shown in Table 1. Meanwhile the
worst model found in the last cluster for both CT and
CXR is VGG19. As for the best ranking models using
the Borda Count method as found in Table 2 are for
CT, ResNet50V2 and for CXR the DenseNet121 and
Xception. To compare the seven DL models
considering the two modalities, Table 3 presents: (1)
the sum of the SK ESD ranks (SR) of each DL model
Figure 1: SK ESD results of mono-modality DL techniques
over the COVID19 CT dataset.
Figure 2: SK ESD results of mono-modality DL techniques
over the COVID19 CXR dataset.
Table 1: Mean metrics results on the test set of the 5-fold
CV for each model on the CT and CXR modalities.
Model/
Modality
S
(%)
Sp
(%)
P
(%)
F1
(%)
AUC
(%)
A
(%)
VG19/
CT
84 39 62 71 62 64
R50V2/
CT
81 76 80 80 78 77
IRv2/
CT
77 64 74 75 71 71
Iv3/
CT
82 64 73 77 73 73
DN121/
CT
88 65 74 81 76 77
Xcep
/CT
78 73 77 78 76 76
MNv2
/CT
86 69 77 81 77 78
VG19/
CXR
93 78 84 88 85 85
R50V2/
CXR
96 86 89 92 91 91
IRv2/
CXR
95 87 89 92 91 91
Iv3/
CXR
95 86 89 92 90 91
DN121/
CXR
97 87 90 93 92 92
Xcep/
CXR
96 88 90 93 92 92
MNv2/
CXR
99 85 88 93 92 92
across the two modalities: for each DL technique and
each modality, a technique has a score equal to its SK
ESD rank. Thereafter, the total score SR of each
technique across the two modalities is the sum of its
individual scores that determines its performance
across modalities (i.e. the lower the total score the
BIOIMAGING 2022 - 9th International Conference on Bioimaging
164
higher is the performance). (2) The sum of the
differences of the ranks (SDR) of each DL technique
across modalities in order to evaluate its sensitivity to
modalities (i.e. the lower the differences of ranks the
lower is its sensitivity). From Table 3, we notice that
MobileNetV2 has the lowest score of SR (SR = 2) and
VGG19 has the highest one (SR = 9). For the total
score SDR, MobileNetV2 has the lowest one (SDR =
0) and was ranked first across both of the two
modalities. Additionally, in second rank we find
DenseNet121 and ResNet50V2 (SR = 3 and SDR =
1). Therefore, we conclude that MobileNetV2 is the
best DL technique in terms of performance and
sensitivity.
Table 2: Borda Count ranking of the mono-modality models
in the best SK ESD cluster for each dataset.
Model/Modality Borda Count rank
R50v2/CT 1
MNv2/CT 2
DN1211/CXR 1
Xcep/CXR 1
MNv2/CXR 2
Table 3: Statistics on SK ESD ranks for the COVID19
modalities.
Model
Scott-Knott
ESD rank
Sum of SK
ESD ranks
(SR)
Sum of SK
ESD ranks
differences
(SDR)
COVID19
CT CXR
Xcep 3 1 4 2
MNv2 1 1 2 0
DN121 2 1 3 1
R50v2 1 2 3 1
Iv3 4 2 6 2
IRv2 5 2 7 3
VG19 6 3 9 3
4.2 Impact of Modalities on the
Performances of DL Techniques
(RQ2)
In this section we evaluate and discuss the impact of
each modality on the diagnosis performance of a DL
technique. To this aim, we use SK ESD statistical test
based on accuracy values to cluster all the
combinations of modalities and DL techniques for
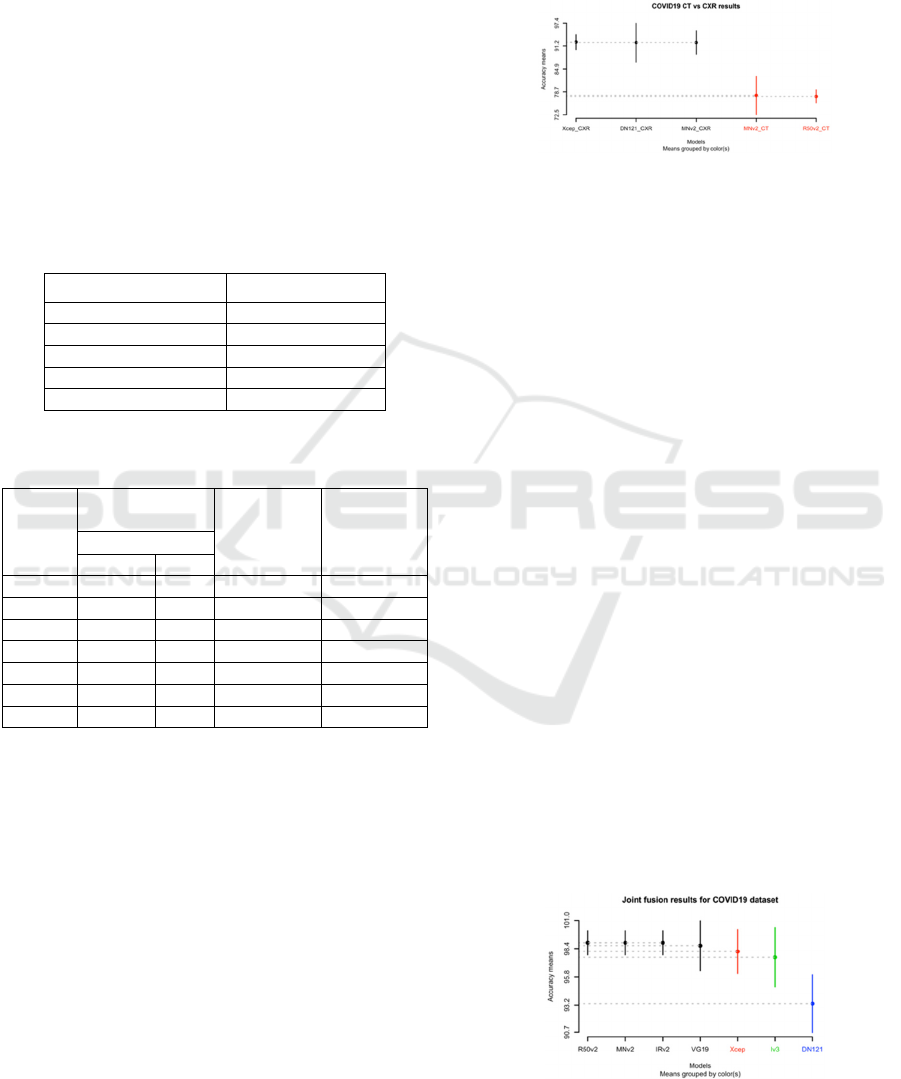
each dataset. Figure 3 shows the SK ESD results
based on accuracy for COVID19. We can see that the
CXR modality was the best to positively impact the
performance of the DL techniques for COVID-19
diagnosis as most of the reported techniques in the
best cluster are using the CXR modality. The models
are Xception, DenseNet121 and MobileNetV2. As
reported in Table 2 and previously the best ranked
model is MobileNetV2. From this, we can conclude
that the diagnostic modality impacting the most
favourably the performance of the DL models for
COVID-19 diagnosis is CXR.
Figure 3: SK ESD results of mono-modality DL techniques
over the COVID19 dataset.
4.3 Evaluation of Joint Fusion DL
Models Performance (RQ3)
This section reports the overall performance of joint
fusion DL techniques in COVID-19 classification.
Table 4 presents the mean values of the 5-fold cross
validation six metrics (sensitivity, specificity,
precision, F1-score, AUC and accuracy) of the seven
joint fusion DL techniques for the COVID19 dataset.
Figure 4 demonstrates the SK ESD results based on
accuracy. Moreover, Table 5 shows the Borda Count
ranks based on sensitivity, specificity, precision, F1-
score, and AUC of the joint fusion DL techniques
belonging to the SK ESD best cluster.
Figure 4 shows that the SK ESD test generated
four clusters and the best one has four joint fusion DL
models: ResNet50V2, MobileNetV2, and
InceptionResNetV2 with an accuracy of 99% and
VGG19 with an accuracy of 99%. As shown in Table
5, apart from VGG19 all of the three joint fusion DL
models (ResNet50V2, MobileNetV2 and
InceptionResNetV2) are ranked as first. Meanwhile,
the model reported in the last cluster is DenseNet121.
To conclude, for COVID-19 diagnosis, the best
joint fusion DL models are MobileNetV2,
ResNet50V2 and InceptionResNetV2 seconded by
VGG19. Furthermore, the worst joint fusion DL
model is DenseNet121.
Figure 4: SK ESD results of joint fusion over the COVID19
dataset.
COVID-19 Diagnosis using Single-modality and Joint Fusion Deep Convolutional Neural Network Models
165
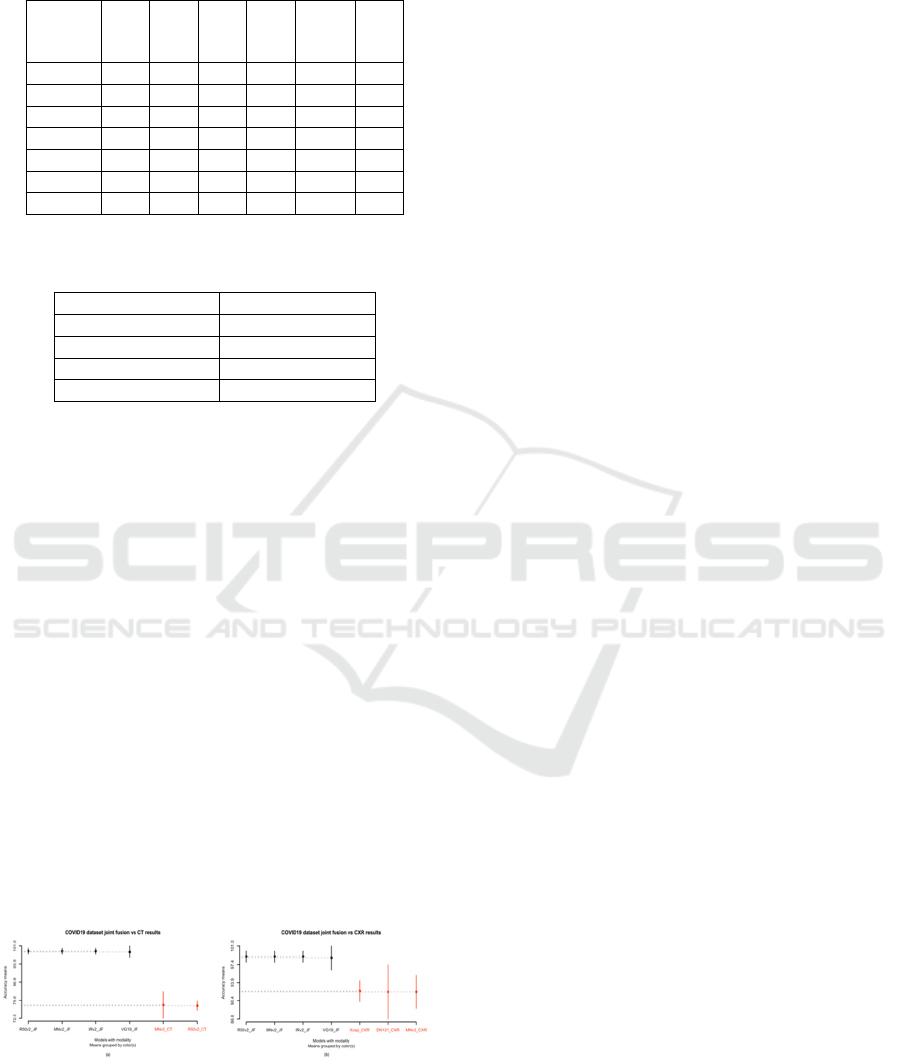
Table 4: Mean metrics results on the test set of the 5-fold
CV for each joint fusion DL model on the COVID19
dataset.
Model
S
(%)
Sp
(%)
P
(%)
F1
(%)
AUC
(%)
A
(%)
VG19 99 99 99 99 99 99
R50V2 99 99 99 99 99 99
IRv2 99 99 99 99 99 99
Iv3 98 98 98 98 98 98
DN121 92 95 96 94 93 93
Xcep 97 100 100 98 98 98
MNv2 98 100 100 99 99 99
Table 5: Borda Count ranking of the joint fusion DL models
belonging to the best clusters of the COVID19 dataset.
Model Borda Count Rank
MobileNetV2 1
ResNet50V2 1
InceptionResNetV2 1
VGG19 2
4.4 Comparison of Mono-modality DL
Techniques and Joint Fusion DL
Techniques (RQ4)
This section compare the performances of mono-
modality DL techniques and joint fusion DL
techniques. To this aim, for each dataset and each
modality, we cluster the best mono-modality DL
techniques (RQ1) and the best joint fusion DL
techniques (RQ3) using the SK ESD test based on
accuracy. Figure 5 (a-b) shows the SK ESD results
for the COVID19 and APTOS19 datasets
respectively. Hereafter, our observations.
The SK ESD test provides two clusters (see Figure
5 (a-b)) for the CT and CXR modalities with four best
joint fusion DL models: ResNet50V2 (accuracy =
96%), MobileNetV2 (accuracy = 96%),
InceptionResNetV2 (accuracy = 96%) and VGG19
(accuracy = 97%). As previously mentioned
ResNet50V2, MobileNetV2, InceptionResNetV2 are
ranked first by the Borda Count method (see Table 5).
Figure 5: Comparison of best joint fusion with best mono-
modality DL techniques on the COVID19 dataset with (a)
the CT and (b) CXR modalities.
5 CONCLUSIONS AND FUTURE
WORK
In this paper, we presented and discussed the results
of an empirical study of seven DL models (VGG19,
DenseNet121, InceptionV3, InceptionResNetV2,
Xception, ResNet50V2, MobileNetV2) trained using
both single and multimodality images using the joint
fusion strategy from three publicly available datasets
(COVID19 CT and COVID19 CXR) for COVID-19
(COVID-19, non-COVID-19) binary classification.
The empirical evaluations were conducted using six
performance metrics, along with SK ESD statistical
test and the Borda Count voting method to asses and
rank the seven single-modality and joint fusion DL
models. The findings of this study in respect to the
research questions were the following:
(RQ1): The best DL model for COVID-19 diagnosis
using the CT and CXR modalities
respectively is the MobileNetV2 model with
an accuracy of 78% for CT and 92% for
CXR as it resulted in optimum scores at the
level of performance and sensitivity.
(RQ2): In all of the reported results, the CXR
modality was found to be the most
favourably impacting on the DL techniques
performance.
(RQ3): The best joint fusion DL models were
MobileNetV2, ResNet50V2 and
InceptionResNetV2 with an accuracy of
99% seconded by VGG19 with an accuracy
of 99%. Additionally, the worst joint fusion
DL model was DenseNet121 (accuracy =
93%) for COVID-19 diagnosis.
(RQ4): Joint fusion DL models outperformed mono-
modality DL models for COVID-19
diagnosis with an accuracy of 99%
(MobileNetV2, ResNet50V2 and
InceptionResNetV2) for joint fusion DL
models; and an accuracy of 77% for CT
(ResNet50V2), 92% (DenseNet121) and
92% (Xception) for CXR.
Future works aim to study the interpretability of
these seven DL models for mono-modality and joint
fusion strategy.
ACKNOWLEDGEMENTS
We thank the Google PhD Fellowship program for
providing support to Sara El-Ateif.
BIOIMAGING 2022 - 9th International Conference on Bioimaging
166

REFERENCES
Aljondi, R., & Alghamdi, S. (2020). Diagnostic value of
imaging modalities for COVID-19: Scoping review.
Journal of Medical Internet Research, 22(8).
https://doi.org/10.2196/19673
Chollet, F. (2016). Xception: Deep Learning with
Depthwise Separable Convolutions. SAE International
Journal of Materials and Manufacturing, 7(3), 1251–
1258.
COVID-19 Radiography Database | Kaggle. (n.d.).
Retrieved November 1, 2021, from https://www.
kaggle.com/tawsifurrahman/covid19-radiography-
database
Elmidaoui, S., Cheikhi, L., Idri, A., & Abran, A. (2020).
Predicting software maintainability using ensemble
techniques and stacked generalization. CEUR
Workshop Proceedings, 2725, 1–16.
Emerson, P. (2013). The original Borda count and partial
voting. Social Choice and Welfare, 40(2), 353–358.
https://doi.org/10.1007/s00355-011-0603-9
Goudouris, E. S. (2021). Laboratory diagnosis of COVID-
19. Jornal de Pediatria, 97(1), 7–12.
https://doi.org/10.1016/j.jped.2020.08.001
He, K., Zhang, X., Ren, S., & Sun, J. (2016). Identity
mappings in deep residual networks. Lecture Notes in
Computer Science (Including Subseries Lecture Notes
in Artificial Intelligence and Lecture Notes in
Bioinformatics), 9908 LNCS, 630–645.
https://doi.org/10.1007/978-3-319-46493-0_38
Huang, G., Liu, Z., Van Der Maaten, L., & Weinberger, K.
Q. (2017). Densely connected convolutional networks.
Proceedings - 30th IEEE Conference on Computer
Vision and Pattern Recognition, CVPR 2017, 2017-
Janua, 2261–2269. https://doi.org/10.1109/CVPR.20
17.243
Huang, S. C., Pareek, A., Seyyedi, S., Banerjee, I., &
Lungren, M. P. (2020). Fusion of medical imaging and
electronic health records using deep learning: a
systematic review and implementation guidelines. Npj
Digital Medicine, 3(1). https://doi.org/10.1038/s41746-
020-00341-z
Islam, M. M., Karray, F., Alhajj, R., & Zeng, J. (2021). A
Review on Deep Learning Techniques for the
Diagnosis of Novel Coronavirus (COVID-19). IEEE
Access, 9, 30551–30572. https://doi.org/10.1109/
ACCESS.2021.3058537
Rahimzadeh, M., & Attar, A. (2020). A modified deep
convolutional neural network for detecting COVID-19
and pneumonia from chest X-ray images based on the
concatenation of Xception and ResNet50V2.
Informatics in Medicine Unlocked, 19, 100360.
https://doi.org/10.1016/j.imu.2020.100360
Sandler, M., Howard, A., Zhu, M., Zhmoginov, A., & Chen,
L. C. (2018). MobileNetV2: Inverted Residuals and
Linear Bottlenecks. Proceedings of the IEEE Computer
Society Conference on Computer Vision and Pattern
Recognition, 4510–4520. https://doi.org/10.1109/
CVPR.2018.00474
Simonyan, K., & Zisserman, A. (2014). Very Deep
Convolutional Networks for Large-Scale Image
Recognition. 3rd International Conference on Learning
Representations, ICLR 2015 - Conference Track
Proceedings, 1–14.
Szegedy, C., Ioffe, S., Vanhoucke, V., & Alemi, A. A.
(2017). Inception-v4, inception-ResNet and the impact
of residual connections on learning. 31st AAAI
Conference on Artificial Intelligence, AAAI 2017,
4278–4284.
Szegedy, C., Vanhoucke, V., Ioffe, S., Shlens, J., & Wojna,
Z. (2016). Rethinking the Inception Architecture for
Computer Vision. Proceedings of the IEEE Computer
Society Conference on Computer Vision and Pattern
Recognition, 2016-Decem, 2818–2826. https://doi.org/
10.1109/CVPR.2016.308
Tantithamthavorn, C., McIntosh, S., Hassan, A. E., &
Matsumoto, K. (2019). The Impact of Automated
Parameter Optimization on Defect Prediction Models.
IEEE Transactions on Software Engineering, 45(7),
683–711. https://doi.org/10.1109/TSE.2018.2794977
Weekly epidemiological update on COVID-19 - 19 October
2021. (n.d.). Retrieved October 31, 2021, from
https://www.who.int/publications/m/item/weekly-
epidemiological-update-on-covid-19---19-october-
2021
Wu, X., Hui, H., Niu, M., Li, L., Wang, L., He, B., Yang,
X., Li, L., Li, H., Tian, J., & Zha, Y. (2020). Deep
learning-based multi-view fusion model for screening
2019 novel coronavirus pneumonia: A multicentre
study. European Journal of Radiology, 128(March), 1–
9. https://doi.org/10.1016/j.ejrad.2020.109041
Xu, M., Ouyang, L., Han, L., Sun, K., Yu, T., Li, Q., Tian,
H., Safarnejad, L., Zhang, H., Gao, Y., Bao, F. S., Chen,
Y., Robinson, P., Ge, Y., Zhu, B., Liu, J., & Chen, S.
(2021). Accurately differentiating between patients
with COVID-19, patients with other viral infections,
and healthy individuals: Multimodal late fusion
learning approach. Journal of Medical Internet
Research, 23(1), 1–17. https://doi.org/10.2196/25535
Yang, X., He, X., Zhao, J., Zhang, Y., Zhang, S., & Xie, P.
(2020). COVID-CT-Dataset: A CT Scan Dataset about
COVID-19. http://arxiv.org/abs/2003.13865
Zhang, Y. D., Zhang, Z., Zhang, X., & Wang, S. H. (2021).
MIDCAN: A multiple input deep convolutional
attention network for Covid-19 diagnosis based on
chest CT and chest X-ray. Pattern Recognition Letters,
150, 8–16. https://doi.org/10.1016/j.patrec.2021.06.021
Zhou, J., Zhang, X., Zhu, Z., Lan, X., Fu, L., Wang, H., &
Wen, H. (2021). Cohesive Multi-modality Feature
Learning and Fusion for COVID-19 Patient Severity
Prediction. IEEE Transactions on Circuits and Systems
for Video Technology
, 1–16. https://doi.org/10.1109/
TCSVT.2021.3063952
COVID-19 Diagnosis using Single-modality and Joint Fusion Deep Convolutional Neural Network Models
167
