
A Machine Learning based Analysis of e-Sports Player Performances in
League of Legends for Winning Prediction based on Player Roles and
Performances
Farnod Bahrololloomi, Sebastian Sauer, Fabio Klonowski, Robin Horst and Ralf D
¨
orner
RheinMain University of Applied Sciences, Wiesbaden, Germany
Robin.Horst@hs-rm.de, Ralf.Doerner@hs-rm.de
Keywords:
Player Modelling, Performance Analysis, Data Science, Computer Games, Electronic Sports (e-sports), League
of Legends, Machine Learning, Winning Prediction.
Abstract:
Predicting the outcome of an electronic sports (e-sports) match is a non-trivial task to which different approaches
can be applied. While the e-sports domain and particularly the Multiplayer Online Battle Arena (MOBA)
genre with League of Legends (LoL) as one of its most successful games is growing tremendously and is
professionalizing, in-depth analysis approaches are demanded by the profession. For example, player and match
analyses can be utilized for training purposes or winning predictions to foster the match preparation of players.
In this paper, we propose two novel performance metrics derived from data of past LoL matches. The first is
based on a Machine Learning (ML) based approach and includes individual player variables of a match. The
second metric is generally based on heuristics derived from the ML approach. We evaluate the second metric
by applying it for winning prediction purposes. Furthermore, we evaluate the importance of different roles of a
LoL team to the outcome of a match and utilize the findings in the winning prediction. Overall, we show that
the influence of a particular role on the match’s outcome is negligible and that the proposed performance metric
based winning prediction could predict the outcome of matches with 86% accuracy.
1 INTRODUCTION
For several years now, the community interested in
electronic sports (e-sports) tournaments has been grow-
ing rapidly with the game League of Legends (LoL)
having a large share. With its high number of players
(called summoners), LoL is one of the most played
Multiplayer Online Battle Arena (MOBA) games.
With the ongoing professionalization of the e-sports
domain also sophisticated match analysis methods are
developed, for example, considering the impact of
player performance on the outcome of a match, mod-
elling players, and profiling and analysis tools to pre-
dict a match’s outcome. These tools can be used by
professional players and coaches for post match analy-
sis to adapt the strategy of future matches as well as by
amateur players to gain quantifiable insight into their
abilities.
In MOBA games, the terms role, position, and
champion are distinguished when it comes to a player
classification. In the example of common five ver-
sus five MOBA games such as LoL, each summoner
selects a champion the summoner plays for the en-
tire game. Most champions fill exactly one role in
the team – in LoL divided into carry (main damage
dealer), support (healing and utility provision), jun-
gler (exploring terrain and concentrating attacks), tank
(front line fighter), and mid lane (pressuring enemies
in the middle of the map) (Eaton et al., 2018). Finally,
the position determines in which part of the map the
summoner will play with the chosen champion during
a match. However, while a champion is fixed for the
entire game and similarly the role, positions are indeed
set at the beginning but may alter during the course of
a match. Furthermore, our goal is the consideration of
the relevance of the different roles in applications in
other fields.
In this paper, we make the following contributions:
1.
We propose two performance metrics for mod-
elling LoL players and differentiate the overall per-
formance within a Machine Learning (ML) based
approach into a set of core variables compared to
other players in the same position. From the ML
approach, we derive a facile second performance
metric based on one variable of the ML model as
a heuristic approach.
68
Bahrololloomi, F., Sauer, S., Klonowski, F., Horst, R. and Dörner, R.
A Machine Learning based Analysis of e-Sports Player Performances in League of Legends for Winning Prediction based on Player Roles and Performances.
DOI: 10.5220/0010895900003124
In Proceedings of the 17th International Joint Conference on Computer Vision, Imaging and Computer Graphics Theory and Applications (VISIGRAPP 2022) - Volume 2: HUCAPP, pages
68-76
ISBN: 978-989-758-555-5; ISSN: 2184-4321
Copyright
c
2022 by SCITEPRESS – Science and Technology Publications, Lda. All rights reserved

2.
We examine the relevance of each player role in
LoL to see if different roles also have different
effects on the outcome of a LoL match.
3.
Finally, we propose a winning prediction ap-
proach that includes both our heuristic perfor-
mance model.
This paper is organized as follows. First, we take a
look at the current state of research in section 2. Then,
in section 3, we describe how we acquired the data
needed for our performance metric calculations and
the winning prediction approaches. Thereafter, the ML
aspects of our work are covered section 4. In section 5
we focus on the performance metric and the player role
impact. The connections between section 3, section 4,
and section 5 are visualized in Figure 1. Finally, we
conclude our work and point out future directions.
2 RELATED WORKS
As LoL is one of the most played MOBA games, there
are already some approaches for winning predictions.
For example, Silva, Pappa, and Chaimowicz (Silva
et al., 2018) conduct a winning prediction based on Re-
current Neural Networks. They use minute-by-minute
match data as a basis and compare the extent to which
the timing of the data within the match affects the ac-
curacy of the winning prediction. They conclude that
an accuracy of up to 83.54% can be achieved with the
Deep Learning methods used when data from the 20th
to 25th minute in the match is used. The further this
time window is moved forward, the less accurate the
winning prediction becomes. Finally, it does not take
the player roles into account and examines what takes
place each minute of the game versus how the overall
performance of the players affects the final outcome.
Harikumar et al. (Ani et al., 2019) investigate
in LoL match prediction distinguishing between Pre-
match Features and Within-match Features, in which
they include features such as Champion, Bans, Sum-
moner, and Spells. Their dataset consists entirely of
matches played by professional players. Using a ran-
dom forest model, this gives them a pre-match accu-
racy of 95.52%, a within-match accuracy of 98.18%,
and a combined accuracy of 99.75%. Furthermore,
Wang et al. (Do et al., 2021) examine whether accurate
winning prediction can be made based on players’ ex-
perience on their chosen champions. Work by Hodge
et al. (Hodge et al., 2019) focus on the MOBA game
Dota 2. They perform real-time match prediction in
professional matches. This can be interesting for spec-
tators to see which team is currently winning. This is
also common in professional chess tournaments. Here,
usually in online broadcasts of professional games, a
live rating of a chess engine like Stockfish is displayed
to allow the viewer to better evaluate the state of the
game and which player currently has an advantageous
position. However, none of these works considers
the aspect of player roles and the extent to which the
individual roles in LoL have a different degree of in-
fluence on the outcome of the game and incorporates
this consideration into their winning prediction.
Instead of predicting a match’s outcome, Khromov
et al. (Khromov et al., 2019) elaborate on predicting a
player’s biometric skill with respect to e-sports (e.g.,
dynamics of key pressings). They utilize biometric-
based features in the example of Counterstrike: Global
Offensive to train an ML model which is able to pre-
dict a player’s skill with the best overall validation
accuracy of 90%. Their work focuses on biometric-
based features, so that the use of in-game data such
as shot accuracy, which weapons bought etc. are not
included in their model.
There are also already existing recent projects in
the field of data visualization and analytics apart from
winning and skill prediction (Eaton et al., 2017; Horst
et al., 2021; Novak et al., 2020; Maymin, 2020; Afonso
et al., 2019). One practical oriented and commonly
utilized tool by LoL player is op.gg (OPGG, 2021).
Here it is possible to look at the processed data of
the individual games. However, no information is
given about how, for example, the achieved kills com-
pare to other players. Similar to the present work, a
performance score is also calculated. However, this
score (called OP score) is not or only very vaguely
explained (‘OP Score is an evaluation system that esti-
mates your in-game performance. Points are awarded
from 0 to 10 depending on your in-game performance.’
(OPGG, 2021)). So the exact composition of the score
is unknown. It is also not possible to get a winning
prediction with different players or to change the data
from one’s own game and check how these changes
could have influenced the outcome of the game.
Another application-oriented example is Moba-
lytic’s (Mobalytics, 2021). This tool also comes up
with a score per player between 0-100 for each aspect
of the game. However, it does not take into account
values such as kills directly, but creates its own metrics
from them such as fighting, farming, and survivability.
Again, being an industry product, it is not explained
how these metrics are composed. Another interesting
aspect in this project is the In-Game Overlay. This
refers to an application that runs in parallel with the
game and displays data about the game and the op-
ponents while the game is still running. Particularly
striking are the attributes assigned to the players, such
as Early Eyes (‘This player averages over 6.66 wards
A Machine Learning based Analysis of e-Sports Player Performances in League of Legends for Winning Prediction based on Player Roles
and Performances
69
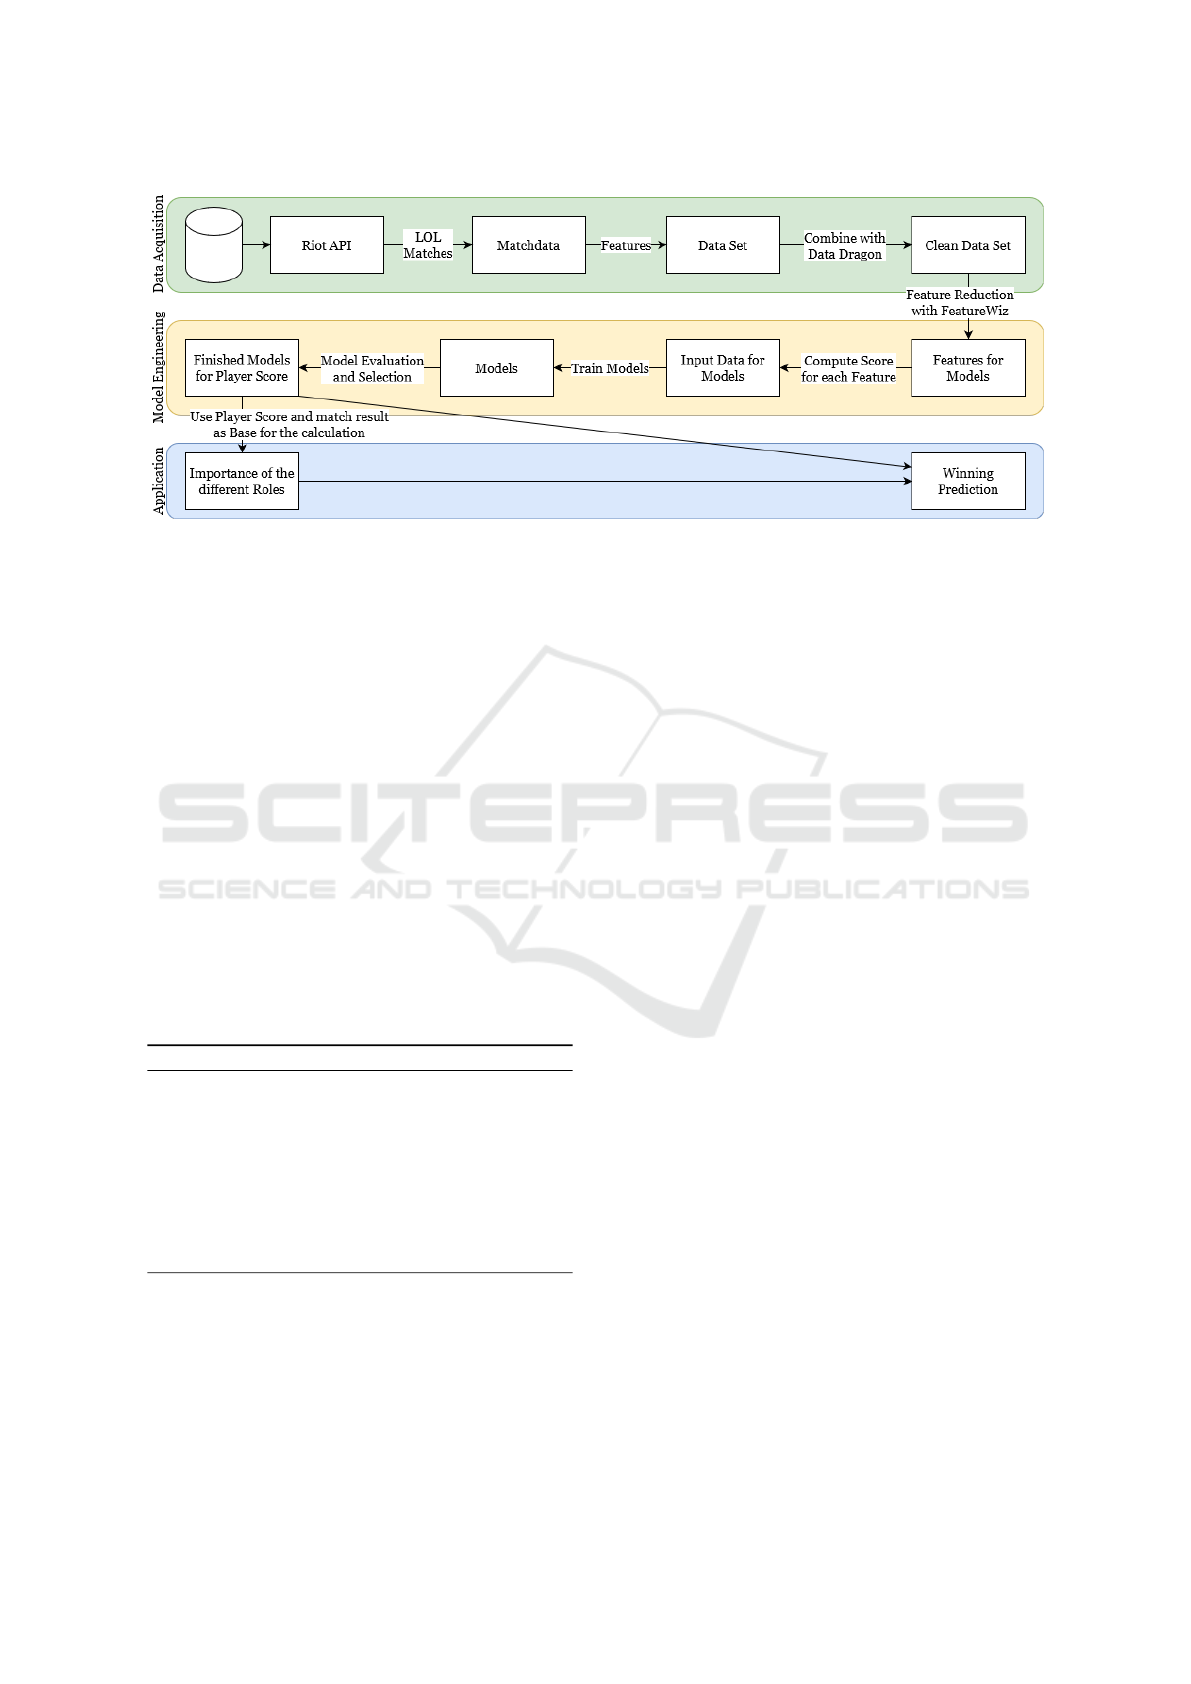
Figure 1: Diagram depicting the application flow, divided into the three sub-areas of Data Acquisition, Model Engineering and
Application.
placed by 15 minutes. They are used to carrying the
load for their team in terms of vision control during
the early game’ (Mobalytics, 2021)). This allows the
player to make an initial assessment of how the oppo-
nents and teammates play.
Finally, our literature research shows that various
work on player performances and winning prediction
in the field of LoL exists. However, the mentioned
work does not take into account the aspect of player
roles in their approaches. Furthermore, existing prod-
ucts for player analysis does not make their perfor-
mance metrics publicly available, so that it is unclear
if these consider player roles or positions at all.
3 DATA ACQUISITION
We propose the following algorithm in pseudocode to
acquire the data for our work:
Algorithm 1: Algorithm used for creating the dataset.
1: procedure R E C U R S I O N (summoner)
2: lastMatches[] =
getLastMatches(summoner)
3: for match in lastMatches do
4: summoners[] =
getSummoners(match)
5: for summoner in summoners do
6: recursion(summoner)
Individual data sets are to be generated for the
respective ranks and regions. To get games from a
certain rank and as a starting value for the recursion, a
player is searched, who is representative for this rank.
The account of the representative player is determined
by his summoner name. From this account the last X
games (exclusively 5v5 ranked solo games in the stan-
dard map ”Summoner’s Rift”) will be queried. Each
game has 10 participants. 5 opponents, 4 teammates
and the chosen player himself. Of the 9 other play-
ers, the last X games are then also determined and
this process can now be repeated as often as desired.
Before that, however, it is checked whether the 9 play-
ers found have already appeared in another game and
whether the game found has already been used be-
fore. Duplicates are sorted out accordingly. With each
run there will probably be several duplicates, because
the match, over which the 9 players were found, is
probably also found within their the last X matches.
Depending on how many of the last matches are re-
trieved and how many times this iteration is repeated,
this quickly results in a large set of matches. In this
project, the last 20 matches were queried and only two
iterations were used.
However, this algorithm only works correctly if
the first player is also representative of his rank. This
means that the player should have been in that rank for
a longer time, so he is not a smurf. A smurf refers to a
player that plays on multiple accounts. His smurfac-
count is usually in a lower rank than his main account.
That means he is playing in a rank he doesn’t belong
in but in a much lower rank. For example, a player
who has an account in the highest rank (challenger)
could create a new account and play in a much lower
rank (e.g. Gold I). Because this player is significantly
better than the typical Gold I player, he will usually
win most of his matches. The matchmaking system
of LoL recognizes this and will put him in a match
mainly with better players after some time. So, for
example, this smurf could be matched into a game that
is otherwise exclusively filled with players from the
Diamond I rank, even though the smurf’s current rank
is only Gold I.
HUCAPP 2022 - 6th International Conference on Human Computer Interaction Theory and Applications
70

Since the LoL matchmaking system usually only
matches players of the same rank into a match, all
matches found this way will also be in roughly the
same rank range. However, if the selected representa-
tive player is now a smurf and in the last games, for
example, was usually matched with players of the Di-
amond I rank, although he himself only has the Gold
I rank, the algorithm will mainly find games from the
Diamond I rank range, and not Gold I.
It is not necessary to manually filter the games by
region, as it is not possible for players from different
regions to play in the same game. Each region has
its own local servers to minimize the delays for each
region. As a result, the games queried are all from the
same region. The resulting datasets were not merged
to analyze the extent to which there may be regional
differences.
4 ML MODEL ENGINEERING
AND ML WINNING
PREDICTION
As explained in section 3, the dataset consists of a
large number of match data, each containing features,
i.e., the statistical values of a summoner from a match.
The effect of which feature was influenced by all other
features and correlated to the other features was deter-
mined by experiments. xpPerMin was thus identified
as the best target feature for model development. Here,
xpPerMin is composed of the player behavior of each
player. This value is calculated as follows:
xpPerMin =
∑
xpPerTimeInterval
number o f time intervals
(1)
The result is an average value. XPs are gained from
many different sources in the game, making them less
dependent on a summoner’s role or position. Since
the score calculation only compares to players in the
same position and role, this value is very useful as a
target feature to judge the quality of a match played.
In addition to this single feature, a combined score can
be created in which all roles and positions are included.
This approach was not considered in the course of our
procedure.
By identifying suitable features for training, a su-
pervised model approach is used to predict the target
features (Soni, 2020). The target features are float val-
ues. Since these are continuous values, the problem at
hand to be solved is a regression problem rather than a
classification problem (Tiwari, 2020).
A total of nine regression models and two ensemble
approaches are examined. The models used in this pa-
per are Gradient Boosting Regressor (GBR), eXtreme
Gradient Boosting Regressor (XGBoost), Categorical
Gradient Boosting Regressor (CatBoost), K-Nearest
Neighbors Regressor (KNNR), epsilon Support Vector
Regressor (SVR), Random Forest Regressor (RFR),
Ridge Regression (Ridge), MultiLayer Perceptron Re-
gression (MLPR). The ensemble approaches are a
Voting Regressor (VotR) and a Bagging Regressor
(BagR).
After the models are trained, the best models are
selected on which hyperparameter optimization is per-
formed using Gridsearch (Pedregosa et al., 2011). This
optimizes the models again and improves their model
goodness of fit. In order to measure the model quality,
the trained models must be evaluated using metrics.
For this the Accuracy, the
R
2
score, the Mean Abso-
lute Error (MAE), the Root Mean Squared Deviation
(RMSD) as well as the Median Absolute Deviation
(MAD) were considered. Once the best model has
been determined using gridsearch and after evalua-
tion, the SHapley Additive exPlanations (SHAP) tool
(Lundberg and Lee, 2017; Lundberg et al., 2020) is
used to try to draw conclusions about which features
had the greatest impact on the model.
We implemented our concepts and acquired the
data initially using the official Riot Games API. Over-
all, we utilized data from 2901 matches. We reduced
the features of the original dataset that the Riot Game
API provides using Featurewiz (AutoViML, 2020)
with respect to a target variable. Through correlation
analysis, 0.81 was determined to be the best threshold
for Featurewiz. We first reduced the dataset of 109
features without considering the target feature in the re-
duction to 91 features by eliminating features that were
either only IDs, empty, or with only little information.
By applying Searching for Uncorrelated List of Vari-
ables (SULOV) methods similar to the Minimum Re-
dundancy Maximum Relevance approach (Peng et al.,
2005), we identified 10 of the features having a cor-
relation higher than 0.81. The remaining 81 features
were passed to the eXtreme Gradient Boosting Regres-
sor (XGBoost) model. The recursive analysis of the
XGBoost model yielded as a result a dataset with the
15 most important features. Figure 2 shows the corre-
lation matrix of the 15 features after running it through
the entire Featurewiz processing.
In the next step, the generated training data set
is passed to the 11 regression models we mentioned
with their base parameters. Then, a hyperparameter
optimization is performed on all ML models. After
that, an evaluation is performed on all ML models
using the metircs Accuracy,
R
2
score, MAE, RMSD,
and MAD. To better assess the stability of the ML
models with respect to the evaluation, the evaluation is
repeated 100 iterations for each model. Then, the mean
A Machine Learning based Analysis of e-Sports Player Performances in League of Legends for Winning Prediction based on Player Roles
and Performances
71
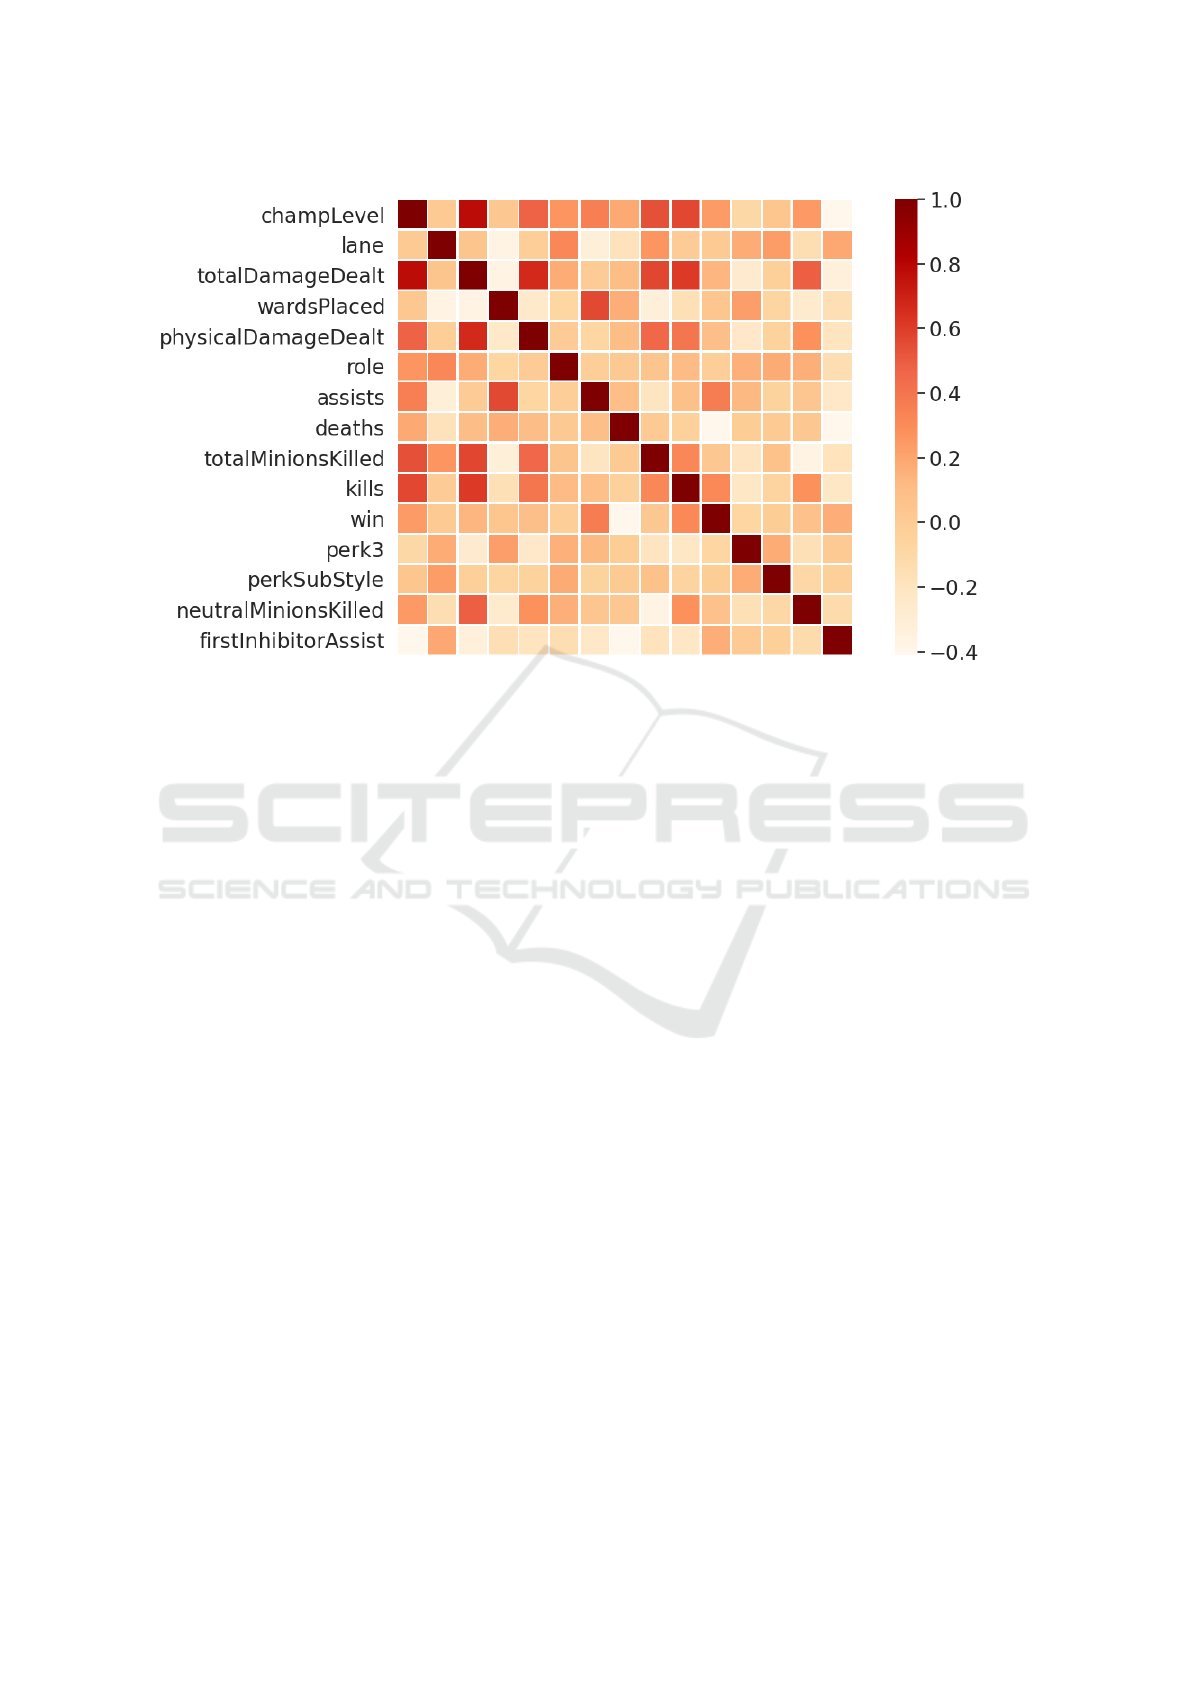
Figure 2: Correlation matrix of the 15 features after applying Featurewiz.
and standard deviation is calculated for each metric.
This process is a modified form of cross validation
and is performed in a data-based manner. After each
iteration, the entire data set is shuffled and the same
ratio is always used to split the data. After the models
have been trained and optimized and the best model
has been identified with the help of the evaluation, the
influence of the respective features on the model result
is determined by a SHAP analysis. Here, the influence
of the features on the training model as well as on the
prediction model is measured.
The accuracy is the difference of the Mean Abso-
lute Percentage Deviation (MAPD) and the number
100 to determine its own percentage error value. With
the normal MAPD metric, it is better when the result
is close to zero. Since the accuracy is calculated as
follows:
Accuracy = 100 − (MAPE · 100) (2)
To obtain a percentage value, the MAPE score was
multiplied by 100. The accuracy is therefore consid-
ered better when it goes towards 100. It is important
to note that the MAPE score does not work with data
that contains zero or large extreme values. This prob-
lem would also apply to accuracy, since it includes the
MAPE score as a sub-metric.
A major advantage of the MAPE score is its robust-
ness to outliers in the data set. The biggest problem
of MAPE is the division operator. If the result to be
predicted goes to zero, no score can be calculated, be-
cause otherwise the denominator goes to zero. Thus,
MAPE is not defined at this point. In addition, the
score can become extremely large for very small val-
ues. In order to get a better estimation about the model
quality and to be able to estimate the results of the Ac-
curacy better, other metrics in addition to the Accuracy
have to be used as comparison.
The second regression metric used to better analyze
model quality is the
R
2
score. All metrics of the
R
2
score are between zero and one. Since the
R
2
score
is a scale-free metric, it does not matter if the values
passed are too large or too small, unlike the MAPE.
An additional advantage of the
R
2
score is the linear
dependence between ground truth and the predicted
value. An
R
2
score of one means that the values are
perfectly linearly dependent on each other, and an
R
2
score of zero means that the values have no linear
dependence.
One problem that can occur with the
R
2
score is
model overfitting. A high
R
2
score is a good metric for
evaluating model quality, but it does not reveal whether
a model is overfitted during training, which can result
in poor generalizability of the ML model. To better as-
sess the risk of overfitting and correct generalization of
the model, the MAE, RMSD and MAD score are still
considered for better assessment of model goodness
of fit.
One advantage of the next metric is its robustness
to outliers. The metrics determined by the MAE score
range between zero and
∞
. Here, it is better if the
values are close to zero. Furthermore, in addition to
the MAE score, the RMSE score of the six ML models
is calculated in the following graph and put in relation
to the MAD score. Also for the RMSE score, the
HUCAPP 2022 - 6th International Conference on Human Computer Interaction Theory and Applications
72

Table 1: Calculation of the mean and standard deviation of the metrics in percent after 100 iterations.
Models Accuracy-% R
2
-% MAE-% RMSD-% MAD-%
XGB 92.7322 ± 0.0865 0.8230 ± 0.0041 29.1193 ± 0.2888 37.2365 ± 0.3554 23.9116 ± 0.3761
CatB 92.6670 ± 0.0897 0.8232 ± 0.0042 29.1286 ± 0.2853 37.2208 ± 0.3552 23.9937 ± 0.3389
GB 92.7351 ± 0.0910 0.8261 ± 0.0043 28.9024 ± 0.2929 36.9134 ± 0.3603 23.6919 ± 0.3453
RF 92.1565 ± 0.0975 0.7962 ± 0.0051 31.1925 ± 0.3318 39.9576 ± 0.4162 25.5352 ± 0.4241
BagR 92.6522 ± 0.0941 0.8229 ± 0.0041 29.1514 ± 0.2885 37.2481 ± 0.3538 24.0091 ± 0.3351
VotR 92.7278 ± 0.0884 0.8250 ± 0.0041 28.9635 ± 0.2910 37.0315 ± 0.3537 23.7511 ± 0.3614
calculated ratios can range between zero and
∞
, with
values towards zero indicating better model quality. In
addition, the direction of the error does not matter for
either metric. A key difference between the RMSE and
MAE scores is that the errors in the RMSE score are
squared before being averaged, giving larger errors a
higher weighting in the calculation of the metric. The
final metric used in the Table 1 to determine model
quality is the MAD score. Just like the MAE and the
RMSE score, the MAD score has robustness to outliers
as long as there are not too many of them. As with the
MAE and the RMSE score, the index range is between
zero and
∞
, where a value towards zero is considered
a good model quality just as with the MAE and the
RMSE score.
In order to better compare the metric results and
thus determine the best ML model for the further steps,
all results were summarized in Table 1. All metric
results were calculated to four decimal places and the
best model was highlighted in green.
In the final phase of model evaluation, all six mod-
els are tested for stability with respect to their accuracy.
As described earlier, this test is used to estimate the
possibility that an ML model happened to give good
results. This is done by calculating the average of
the respective metrics. The results of this analysis are
shown in Table 1.
It can be seen that even when testing the ML mod-
els repeatedly, GradBoosting performs best among all
other ML models in almost every metric.
After selecting the best ML model using various
evaluation techniques, the best model is now inter-
preted using the SHAP analysis tool. Here, the 15
features and their impact on the model result are con-
sidered. Figure 3 shows two summary plots, which
were generated after training (left) and after prediction
(right). It can be seen in both plots that champlelevel
and totalMinionsKilled had the largest impact on the
model result in terms of xpPerMin during the training
as well as the prediction phase. Features are sorted
according to their impact size in descending order of
the sum of SHAP values across the entire sample. The
features with the largest impact are at the top of the
plot and those with the smallest are at the bottom.
Specifically, this means that a high champlevel and
totalMinionsKilled value have the largest impact on
prediction. In the SHAP analysis, the first step is to
remove a feature and compare the subsequent model
result with the originally calculated model result. This
calculates the impact of that feature. Each color-coded
point represents a feature. This distribution is cal-
culated for all features with the entire dataset used.
Additionally, the analysis showed that the feature win
had the lowest impact with respect to the target feature
xpPerMin (Rade
ˇ
ci
´
c, 2020).
Summarizing this section, of the top six ML mod-
els, GradBoost provided the best model results. Also
in the stability analysis from the Table 1, GradBoost
outperformed the other ML models in all metrics by a
slight margin with an accuracy of 92.7%. This means,
based on values we input as features in our ML model
as described, that GradBoost finds a highly accurate
player score, slightly more accurate than discussed
literature based on different data or games (e.g., (Khro-
mov et al., 2019) with Counterstrike: Global Offensive
and biometric-based features).
5 PERFORMANCE METRIC,
PLAYER ROLE IMPACT, AND
WINNING PREDICTION
Besides using our ML approach for calculating data-
driven player scores, we also derive a facile heuristic
performance metric from it that is described in this
section. Then we investigated in the impact of the
different roles concerning the outcome of a match
utilizing this player score. Finally we evaluate our
facile performance metric concept by utilizing it to
predict the outcome of a match.
1. Heuristic Player Scores
We designed our player scores to compare a value
from the performance metric to the values of play-
ers playing the same role at the same position. This
adds up to a total of 25 categories build up from the
permutation of the five roles with the five positions.
This distinction in the calculation of player scores
from the other positions and roles is to prevent
the differences in the various playing styles from
A Machine Learning based Analysis of e-Sports Player Performances in League of Legends for Winning Prediction based on Player Roles
and Performances
73
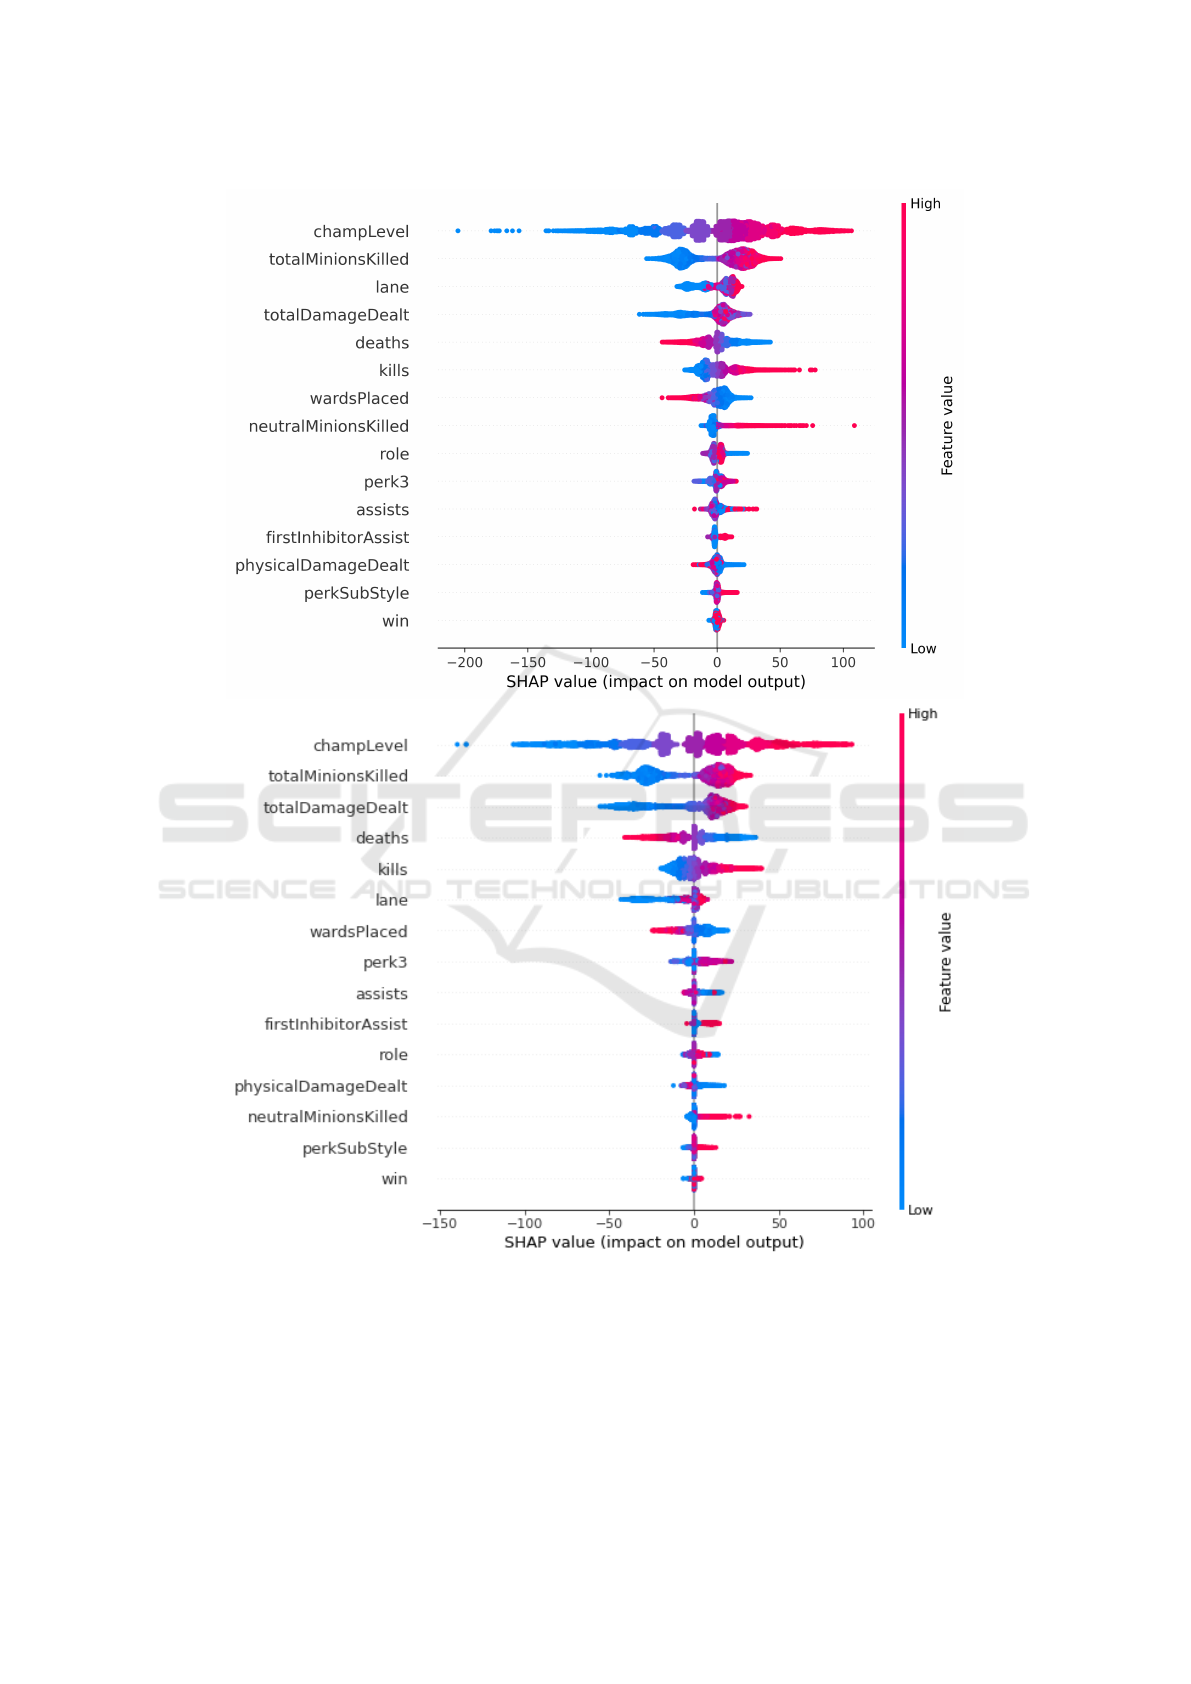
Figure 3: Comparison of SHAP analysis of GradBoost after training (top) and after prediction (bottom).
being negatively reflected in the player scores. For
example, an Carry player usually has a higher kill
score than a support player. Therefore, it would
not be particularly fair to apply the same standard
to both play styles.
Our player score itself represents the percentile
rank of a player’s performance. It therefore indi-
cates the percentage of players in the same posi-
tion and role who were worse than this player. The
player score calculated in this way is intended to
make one’s own performance in a category more
HUCAPP 2022 - 6th International Conference on Human Computer Interaction Theory and Applications
74

comparable than pure numerical values would be.
For practically calculating our score, we can use
match data (e.g., from the official Riot Games API),
then divide the data into the mentioned 25 cate-
gories sorted in ascending order. The index divided
by the length of the data structure thus acts as the
percentile rank that indicates what percentage of
the values are worse than the specified value.
2. Importance of Roles and Winning Prediction
For calculating the importance of the roles, a large
number of already finished matches is considered.
Each of these matches is solved in a way, that for as
many matches as possible the linear optimization
of the sum of the teams’ individual performances
multiplied by the importance of the corresponding
role would predict the correct winner. This is more
clearly illustrated in the following formulas:
t1 = p1 · w1 + p2 · w2 + p3 · w3 + p4 · w4 + p5 · w
(3)
t2 = p6 · w6 + p7 · w7 + p8 · w8 + p9 · w9 + p10 · w10
(4)
Where each p
i
represents the player scores already
given and the w
i
represent the weights of the score
based on the importance of the roles. The formulas
must now be solved so that the weights for each
formula remain the same, but t
1
and t
2
take on
values such that the winning team achieves the
higher total team score as often as possible.
We utilized the proposed calculation of the role
importance with the data of 2901 matches. For
this, the player scores of the target feature (in our
case xpPerMin), are added up within the team.
This way we get the team score. From the team
scores a factor is calculated by subtracting the team
score of the losing team from the team score of the
winning team. This is done for all matches that
serve as a basis for the calculation. The resulting
list of factors is taken as input for the optimization
function. This gives an array of values that best
solve the optimization problem.
The result of the optimization was the following
array:
[0.1996, 0.1995, 0.1995, 0.2005, 0.2006]
The array shows that the differences between the
individual factors of Equation 3 and Equation 4
are only 0.1%. From this, we derive that the
impact of a specific player role within a LoL team
is negligible – there is not a single role that is most
important in a team.
The winning prediction builds on the above appli-
cations, namely the calculation of the player scores
as well as the importance of the roles, in order to
get a program which evaluates a future game with
known player names. For this, the player scores
from the last games of each player are averaged
and the so obtained values of each team are added
up. The team with the higher sum is then the team
that is predicted to have the higher chance of win-
ning.
We determined the number of matches in which
the winning team’s team score is greater than the
losing team’s team score. Based on the considered
data we found that this was true in 86% of the
matches. This shows that even a team can lose
whose sum of individual performances is greater
than that of the opposing team and that the ML
based winning prediction is more accurate.
6 CONCLUSION AND FUTURE
WORK
In this paper, we proposed two performance metrics
that evaluates the overall performance of a player as
well as the individual stats within a match and com-
pares them to the performance of other players. For
this purpose, a data base of 29010 player stats (from
2901 matches) was taken as a basis to be able to rank
performances. Since different roles and different posi-
tions might have different playing styles, this ranking
compared players in the same position with the same
role. A GradBoost-based ML model was found most
suitable for this purpose and was developed, given the
values of the various individual stats. It could deter-
mine a player score with an accuracy of 92.7%.
Furthermore, the impact of the different roles on
the overall result was examined. To do this, 2901 past
games were examined and linear optimization was
used to calculate the factors so that the team total of
player scores would indicate the correct result as often
as possible. However, the factors calculated in this
way showed only a 0.1% difference in role impact on
the overall result. Therefore, we conclude that the
influence of the different roles on the overall result is
negligible and can be omitted in future work.
Based on the knowledge gained from this, a facile
winning prediction was developed that predicts a
match result when ten player names divided into two
teams are entered. For this purpose, the heuristically
derived player scores from the last games are arith-
metically averaged for each player and added up to
a team score. The team with the higher team score
has the higher predicted probability of winning. The
accuracy of this prediction method lies at 86%.
A Machine Learning based Analysis of e-Sports Player Performances in League of Legends for Winning Prediction based on Player Roles
and Performances
75

Future work should elaborate on setting up further
transparent performance metrics for LoL in order to
find the best and unify the use of performance metrics
throughout analysis tools such as op.gg or Mobalytic.
However, future applications for winning predictions
should still utilize ML based solutions. Future work
could utilize both approaches to form interactive train-
ing and assessment tools, particularly for amateur play-
ers which are trying to improve their skill and do not
have resources like expert game and data analysts like
professional players. Furthermore, a performance met-
ric similar to one or both of the metrics presented by
our approach can be applied in all sports where two
teams with players of different roles compete against
each other. This includes other team e-sports games as
well as real world team sports like football, soccer, or
basketball.
REFERENCES
Afonso, A. P., Carmo, M. B., and Moucho, T. (2019). Com-
parison of visualization tools for matches analysis of
a moba game. In 2019 23rd International Conference
Information Visualisation (IV), pages 118–126. IEEE.
Ani, R., Harikumar, V., Devan, A. K., and Deepa, O. (2019).
Victory prediction in league of legends using feature
selection and ensemble methods. In 2019 International
Conference on Intelligent Computing and Control Sys-
tems (ICCS), pages 74–77.
AutoViML (2020). Autoviml/featurewiz: Use advanced
feature engineering strategies and select the best fea-
tures from your data set fast with a single line of code.
https://github.com/AutoViML/featurewiz. Accessed
on: 08.30.2021.
Do, T. D., Wang, S. I., Yu, D. S., McMillian, M. G., and
McMahan, R. P. (2021). Using machine learning to
predict game outcomes based on player-champion ex-
perience in league of legends. The 16th International
Conference on the Foundations of Digital Games.
Eaton, J. A., Mendon
c¸
a, D. J., and Sangster, M.-D. D. (2018).
Attack, damage and carry: Role familiarity and team
performance in league of legends. In Proceedings of
the Human Factors and Ergonomics Society Annual
Meeting, volume 62, pages 130–134. SAGE Publica-
tions Sage CA: Los Angeles, CA.
Eaton, J. A., Sangster, M.-D. D., Renaud, M., Mendonca,
D. J., and Gray, W. D. (2017). Carrying the team: The
importance of one player’s survival for team success
in league of legends. In Proceedings of the Human
Factors and Ergonomics Society Annual Meeting, vol-
ume 61, pages 272–276. SAGE Publications Sage CA:
Los Angeles, CA.
Hodge, V., Devlin, S., Sephton, N., Block, F., Cowling, P.,
and Drachen, A. (2019). Win prediction in multi-player
esports: Live professional match prediction. IEEE
Transactions on Games, pages 1–1.
Horst, R., Lanvers, M., Kacsoh, L. v., and D
¨
orner, R. (2021).
Moba coach: Exploring and analyzing multiplayer on-
line battle arena data. In International Symposium on
Visual Computing, pages 197–209. Springer.
Khromov, N., Korotin, A., Lange, A., Stepanov, A., Burnaev,
E., and Somov, A. (2019). Esports athletes and play-
ers: A comparative study. IEEE Pervasive Computing,
18(3):31–39.
Lundberg, S. M., Erion, G., Chen, H., DeGrave, A., Prutkin,
J. M., Nair, B., Katz, R., Himmelfarb, J., Bansal, N.,
and Lee, S.-I. (2020). From local explanations to global
understanding with explainable ai for trees. Nature
Machine Intelligence, 2(1):2522–5839.
Lundberg, S. M. and Lee, S.-I. (2017). A unified ap-
proach to interpreting model predictions. In Guyon,
I., Luxburg, U. V., Bengio, S., Wallach, H., Fergus,
R., Vishwanathan, S., and Garnett, R., editors, Ad-
vances in Neural Information Processing Systems 30,
pages 4765–4774. Curran Associates, Inc. Accessed
on: 09.01.2021.
Maymin, P. Z. (2020). Smart kills and worthless deaths:
esports analytics for league of legends. Journal of
Quantitative Analysis in Sports, 1(ahead-of-print).
Mobalytics (2021). Mobalytics. https://app.mobalytics.gg/
lol. Accessed on: 09.13.2021.
Novak, A. R., Bennett, K. J., Pluss, M. A., and Fransen, J.
(2020). Performance analysis in esports: modelling
performance at the 2018 league of legends world cham-
pionship. International Journal of Sports Science &
Coaching, 15(5-6):809–817.
OPGG (2021). Op.gg. https://euw.op.gg/. Accessed on:
09.13.2021.
Pedregosa, F., Varoquaux, G., Gramfort, A., Michel, V.,
Thirion, B., Grisel, O., Blondel, M., Prettenhofer, P.,
Weiss, R., Dubourg, V., Vanderplas, J., Passos, A.,
Cournapeau, D., Brucher, M., Perrot, M., and Duch-
esnay, E. (2011). Scikit-learn: Machine learning
in Python. Journal of Machine Learning Research,
12:2825–2830.
Peng, H., Long, F., and Ding, C. (2005). Feature
selection based on mutual information criteria of
max-dependency, max-relevance, and min-redundancy.
IEEE Transactions on pattern analysis and machine
intelligence, 27(8):1226–1238.
Rade
ˇ
ci
´
c, D. (2020). Shap: How to interpret machine learning
models with python. https://towardsdatascience.com/
shap-how-to-interpret-machine-learning-models-
with-python-2323f5af4be9. Accessed on: 09.14.2021.
Silva, A. L. C., Pappa, G. L., and Chaimowicz, L. (2018).
Continuous outcome prediction of league of legends
competitive matches using recurrent neural networks.
In SBC-Proceedings of SBCGames, pages 2179–2259.
Soni, D. (2020). Supervised vs. unsupervised learn-
ing. https://towardsdatascience.com/supervised-vs-
unsupervised-learning-14f68e32ea8d. Accessed on:
08.30.2021.
Tiwari, R. (2020). Regression vs classification in
machine learning: What is the difference?
https://in.springboard.com/blog/regression-vs-
classification-in-machine-learning/. Accessed on:
08.30.2021.
HUCAPP 2022 - 6th International Conference on Human Computer Interaction Theory and Applications
76
