
Context-aware Sleep Analysis with Intraday Steps and Heart Rate
Time Series Data from Consumer Activity Trackers
Zilu Liang
1,2 a
, Huyen Hoang Nhung
1b
, Lauriane Bertrand
3
and Nathan Cleyet-Marrel
3
1
Ubiquitous and Personal Computing Lab, Kyoto University of Advanced Science (KUAS), 621-8555 Kyoto, Japan
2
Institute of Industrial Science, The University of Tokyo, 113-8654 Tokyo, Japan
3
National Institute of Electrical Engineering, Electronics, Computer Science, Hydraulics and Telecommunications
(INP-ENSEEIHT), 31000 Toulouse, France
Keywords: Sleep Tracking, Data Mining, Personal Informatics, Ubiquitous Computing, Wearable Computing.
Abstract: Wearable consumer activity trackers have become a popular tool for longitudinal monitoring of sleep quality.
However, sleep data were routinely visualized in isolation from other contextual information. In this paper,
we proposed a sleep analytics method to identify the associations between sleep quality and the contextual
data that are readily measurable with a single Fitbit device. Different from prior studies that only focused on
the daily aggregation of the contextual factors (e.g., total step counts), our method considers the intraday
temporal patterns of these factors. Time-domain, frequency-domain, and nonlinear features were derived
using the minute-by-minute intraday step and heart rate time series. The results showed that some of the
identified contextual features such as the zero-crossing of steps and the absolute energy of heart rate could
lead to actionable insights. While the nonlinear features—such as the average and longest diagonal line length
derived through the recurrent quantitative analysis of the step time series—may not lead to insights that can
be immediately acted on, they generated new hypotheses for further scientific studies. The results also showed
that when dealing with data of consumer wearables, the individual-level analysis could generate more
personally relevant insight than the cohort-level analysis.
1 INTRODUCTION
Getting enough and quality sleep is critical for
people’s physical and mental health (Buysse, 2014).
While traditional sleep monitoring technologies such
as polysomnography (PSG) and actigraphy were only
available in medical settings, recent advances in
consumer wearable technologies have expanded
sleep monitoring to daily life. Consumer activity
trackers such as Fitbit are affordable, easy to use, and
provide an intuitive user interface for data
visualization. These devices have achieved great
popularity not only among individual users but also
recently in the scientific research community (Peach
et al., 2018; Weatherall et al., 2018). As the latest
models can achieve comparable accuracy against
medical devices, these devices are increasingly used
in research studies to generate new insights into sleep
health (Liang, 2021; Liang & Ploderer, 2020;
Yurkiewicz et al., 2018)
a
https://orcid.org/0000-0002-2328-5016
b
https://orcid.org/0000-0002-5805-2087
Despite their popularity, consumer sleep tracking
technology is yet recognized as an effective tool that
helps people improve their sleep quality. Most sleep
trackers rely on motion-sensing technology
(accelerometer or gyroscope) to gauge how often a
user moves during sleep. Therefore, they may
overestimate or underestimate sleep and wake. For
example, a user wakes up in the middle of the night
but lying still could get an imprecise sleep summary
the next day. Furthermore, a previous study pointed
out ‘not identifying reasons for sleep problems’ and
‘not knowing how to act’ as two main barriers to
improving sleep with consumer activity trackers
(Liang & Ploderer, 2016). From a data science
perspective, addressing these two barriers requires the
analysis of users’ sleep data within their lifestyle
context (Liang, Ploderer, et al., 2016). Despite of
being able to collect multiple streams of behavioural
and physiological data (e.g., steps, heart rate, calorie
expenditure), Fitbit only allows users to visualize
170
Liang, Z., Nhung, H., Bertrand, L. and Cleyet-Marrel, N.
Context-aware Sleep Analysis with Intraday Steps and Heart Rate Time Series Data from Consumer Activity Trackers.
DOI: 10.5220/0010892900003123
In Proceedings of the 15th International Joint Conference on Biomedical Engineering Systems and Technologies (BIOSTEC 2022) - Volume 5: HEALTHINF, pages 170-179
ISBN: 978-989-758-552-4; ISSN: 2184-4305
Copyright
c
2022 by SCITEPRESS – Science and Technology Publications, Lda. All rights reserved
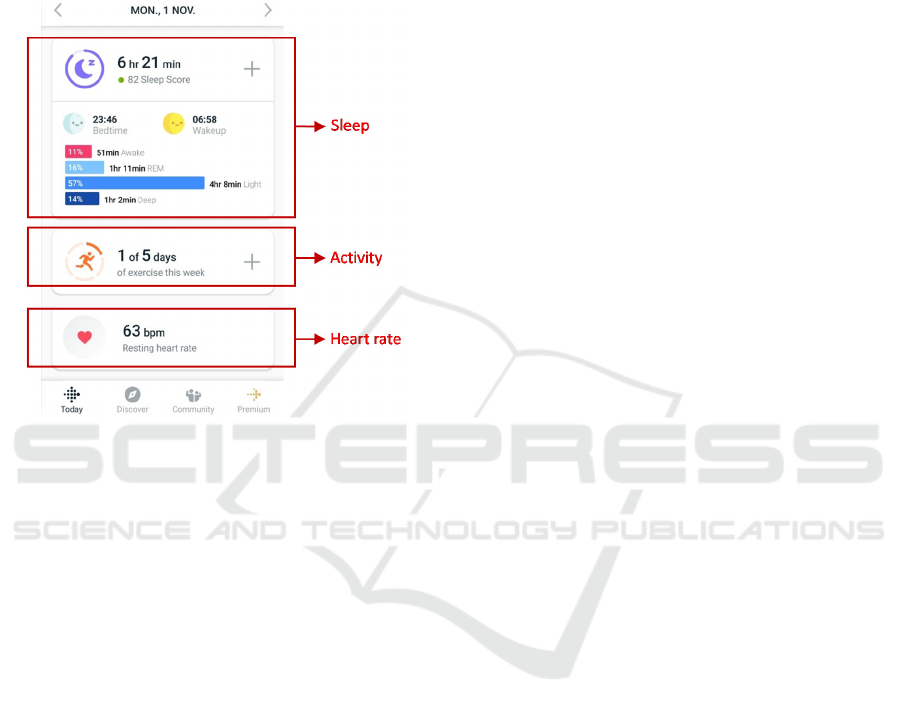
these data separately, leaving it difficult to explore the
relationships among different streams of data. Figure
1 illustrates how sleep data are presented in isolation
from other streams of data that can potentially
provide contextual information. It is worth
mentioning that this problem is not specific to Fitbit
but rather universal to all consumer activity trackers.
Figure 1: A screenshot of the Fitbit dashboard.
On the other hand, several research studies have
attempted to address the above limitation of consumer
activity trackers. In these studies, researchers
developed web and mobile applications that allow
users to explorer the correlations among multiple
streams of health data readily collected with
consumer activity trackers (Bentley et al., 2013;
Daskalova et al., 2016; Kay et al., 2012; Liang,
Ploderer, et al., 2016). Both linear correlation analysis
and data mining techniques have been employed to
identify relationships between sleep and lifestyle
context (Daskalova et al., 2016; Liang, Chapa-
Martell, et al., 2016; Liang, Ploderer, et al., 2016).
Here we coin the term ‘context-aware sleep
computing’ as the umbrella of all the research studies
that attempt to analyse sleep within the context of
users’ lifestyle, physiological and psychological
states, and living environment.
Current context-aware sleep computing research
is limited to the daily aggregation of contextual
factors. Prior studies have only considered the
associations of sleep to the total number of steps,
calories expenditure, or minutes spent in various heart
rate zones in a day (Bentley et al., 2013; Daskalova et
al., 2016; Kay et al., 2012; Liang, Ploderer, et al.,
2016). While daily aggregations provide important
information on day-to-day variability, the intraday
temporal patterns of these factors—which may
potentially correlate to sleep quality at night—were
largely overlooked. This study aims to fill in this gap.
We performed a two-week data collection experiment
with 16 participants using Fitbit Charge 3. The
minute-by-minute time series data of steps and heart
rate were retrieved using a special Fitbit web API that
requires permission from the Fitbit company. Time-
domain, frequency-domain, and nonlinear features
were derived from the time-series data to capture the
intraday temporal patterns of these two factors in
different dimensions. We also proposed an ensemble
feature selection method to identify the important
intraday features that significantly correlate to sleep
quality at night. The contribution of this study is two-
fold.
The proposed context-aware sleep analysis
method bridges a methodological gap in
persona informatics by considering the
intraday temporal patterns of lifestyle factors.
We demonstrated how the proposed method
could help generate not only actionable insights
for individuals, but also interesting research
hypothesis that may inspire further studies in
sleep science.
2 RELATED WORKS
Sleep plays a critical role in human health and has
strong associations with learning, memory, and
metabolism. Many studies have been conducted to
help people understand more about sleep. However,
sleep experiments performed in sleep labs had some
drawbacks since the environment in which sleep
occurs was very different from a bedroom
environment. The findings of these studies might not
be generalized to real situations and result in poor
ecological validity. Recently, the development of
commercial sleep-tracking devices provides
researchers with a tool to track sleep as well as
daytime activities in naturalistic settings. While the
companion apps of these devices only present
different streams of data independently, several
research studies have developed third-party web and
mobile applications that help users to learn about the
relationship between sleep metrics and contextual
factors (Bauer et al., 2012; Bentley et al., 2013; Kay
et al., 2012; Liang, Ploderer, et al., 2016). These
studies have demonstrated both feasibility and merits
in investigating the effects of multiple categories of
factors along with sleep. To collect data without
disturbing participants’ daily activities, many studies
Context-aware Sleep Analysis with Intraday Steps and Heart Rate Time Series Data from Consumer Activity Trackers
171

used wristband activity trackers (Fitbit, Xiaomi Mi
Band) to collect behavioural and lifestyle information
in addition to sleep. Additional sensors were also used
to explore the home sleep environment (Kay et al.,
2012; Liang, Ploderer, et al., 2016; Park et al., 2019;
Wang et al., 2021). (Kay et al., 2012), built up a
system called Lullaby which can be installed in
participants’ bedrooms to capture light, temperature,
noise, and motion signals. Contextual factors varied
from study to study and some of them cannot be
detected automatically, such as consuming caffeine,
nicotine use, relaxation, and food intake. This
problem can be solved by asking the participants to
write down their observations manually (Bauer et al.,
2012; Bentley et al., 2013; Daskalova et al., 2016;
Liang, Ploderer, et al., 2016; Park et al., 2019).
However, missing data is a big challenge since
manual logging did not occur frequently. Apart from
using wristband devices, some studies used available
sensors in smartphones and developed their own
widget so that they can reduce the need for external
devices (Bauer et al., 2012; Daskalova et al., 2016).
Taking advantage of mobile phones, factors like
location, weather, free/busy hours, communication
records can be extracted automatically (Bentley et al.,
2013; Kay et al., 2012; Liang, Ploderer, et al., 2016;
Park et al., 2019; Wang et al., 2021). In these studies,
some participants were amazed by how little they
knew about sleep despite having sleep every day (Kay
et al., 2012). Participants were able to see the links
between sleep hours with emotion and physical
activity for the next day (Bentley et al., 2013).
Studying contextual factors not only benefits healthy
subjects but also contributes to sleep disorder
research. (Park et al., 2019) found that contextual
factors such as calories consumed, walk, distance,
stairs, and active ratio could be useful for predicting
sleep efficiency and ranking the risk level of insomnia
for the next night’s sleep. Some contextual factors
such as age, gender, subjective perception of sleep
quality and heart rate were shown to affect the
accuracy of sleep trackers and were used to develop
more accurate sleep staging algorithms (Liang &
Chapa-Martell, 2019, 2021).
Some limitations exist and demand further work
to improve. First, existing studies have only
considered the daily aggregation of lifestyle
contextual factors, such as the total number of steps,
the total calories expenditure, and the total minutes
spent in each activity intensity zone. The intraday
variability and the temporal patterns were largely
neglected. Second, the data from different
participants were usually merged into one large
dataset for analysis, assuming the homogeneity of the
cohort. While such cohort-level analysis is widely
adopted, it is found that the results are usually not
generalized well to individuals, especially when the
intra-personal variability is larger than the inter-
personal variability (Molenaar, 2004). In this study,
the intraday temporal patterns of the time series data
of steps and heart rate were captured using a diversity
of time-domain, frequency-domain, and nonlinear
features. In addition, we performed contextual-aware
sleep analysis for participants individually to identify
correlations between sleep and lifestyle for each
person. In what follows, we demonstrate the
usefulness of intraday features of the time series data
of lifestyle factors, as well as the importance of a
research paradigm shift from cohort informatics
towards personal informatics.
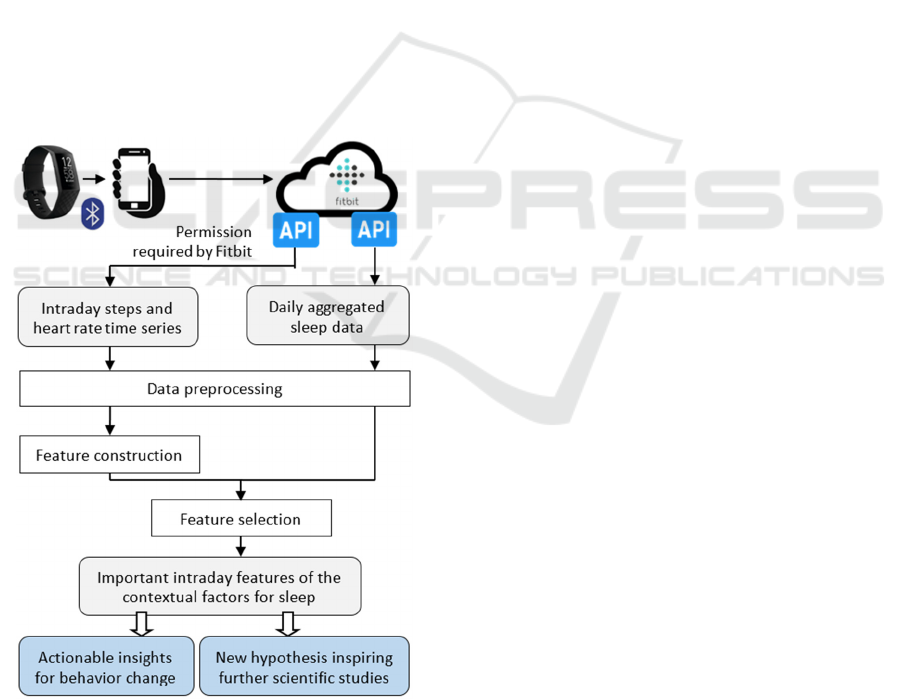
3 METHODS
An overview of the proposed context-aware sleep
analysis is illustrated in Figure 2. All data were
collected using Fitbit Charge 3. We constrained the
contextual factors to steps and heart rate because they
are readily measurable together with sleep data using
a single Fitbit device, which best represents the usage
scenario of consumer activity trackers in real life. In
what follows, we detail the data collection experiment,
data preprocessing, feature construction and the
original feature selection algorithm.
3.1 Data Collection and Retrieval
Due to the lack of high-quality open-access datasets
that serve our purpose, we conducted a 14-day data
collection experiment on our own with 16 participants
using Fitbit Charge 3. The participants were recruited
through personal connections and word of mouth.
Applicants with diagnosed sleep problems were
excluded. The cohort consist of 9 women and 7 men,
with an average age of 30 years. Ethics approval was
obtained from the Ethics Committee of the Kyoto
University of Advanced Science.
We mailed a Fitbit Charge 3 device to each
participant and instructed them to set up the device
and the companion Fitbit app on their smartphones.
The participants were required to log in to the Fitbit
app using a provided email account that our research
assistants created exclusively for the data collection
experiment. The subjects were encouraged to wear
the Fitbit Charge 3 as often as possible and to
synchronize the device daily. Participants who
successfully completed the data collection
experiment were allowed to keep the Fitbit device as
HEALTHINF 2022 - 15th International Conference on Health Informatics
172
a reward, and they were instructed to re-login on their
Fitbit apps using their personal email account, so that
their data would not be synchronized to the
experiment account afterward.
The daily aggregation of sleep data was retrieved
using Fitbit public web API. We selected three sleep
metrics—total sleep time (TST), wake after sleep
onset (WASO), and deep sleep ratio—as indicators of
sleep quality, as prior studies showed that many users
to consumer sleep trackers rely on these metrics to
assess their sleep quality (Bauer et al., 2012; Bentley
et al., 2013; Kay et al., 2012; Liang & Ploderer, 2020;
Liang, Ploderer, et al., 2016). Prior validation studies
found that Fitbit are reasonably accurate in measuring
the daily aggregation of sleep metrics (De Zambotti
et al., 2019; Liang & Chapa-Martell, 2018).
The intraday time series of steps and heart rate
were retrieved using a special Fitbit web API that
requires getting permission from the Fitbit company.
While a third-party service has no limitations in
accessing the aggregated data, permission is needed
to access the intraday time series. Both the steps and
heart rate time series were retrieved at one-minute
resolution.
Figure 2: An overview of the proposed context-aware sleep
analysis method with Fitbit.
3.2 Data Preprocessing
The data preprocessing protocol described below was
performed individually on the dataset of each subject
to handle missing data and to ensure the correct
timestamp match between the contextual data and the
sleep data.
Missing data was an occasional issue when no
sleep stage data was recorded throughout the night, or
no resting heart rate was recorded upon waking up on
a day. The Fitbit API supports the retrieval of two
kinds of sleep data. The ‘stage’ data consist of sleep
stage levels include ‘light’, ‘deep’, ‘rem’, and ‘wake’,
while the ‘classic’ data consist of sleep pattern levels
include ‘asleep’, ‘restless’, and ‘wake’. In other
words, when the sensor did not record sufficient
signals to infer sleep stages of a night, it only roughly
classified sleep and awake. The target sleep metrics
that were related to sleep stages were all filled in with
NAs on nights with no sleep stage information.
Missing heart rate data were set to NA as well.
Afterward, the NAs were imputed with the mean of
the intraday time series.
The contextual data and the sleep data needed to
be matched by date. According to the data scheme of
Fitbit, the sleep data of day N corresponds to the sleep
that ends in the morning of day N (not the sleep that
starts on the night of day N). Hence, the contextual
data of sleep on day N refers to the steps and heart
rate data between the end time of sleep on day N-1
and the start time of sleep on day N. Depending on
whether a user goes to bed before midnight (case 1)
and after midnight (case 2), the sleep start time of day
N could be either on day N-1 (case 1) or on day N
(case 2). The corresponding contextual data that
matched to the sleep on day N hence differed between
case 1 and case 2. In addition, the raw sleep data
retrieved only consist of sleep stages in minutes. We
calculated the ratio of deep sleep (DR) by dividing the
minutes of deep sleep by TST.
3.3 Feature Construction
We derived features from the intraday time series of
steps and heart rate. A full list of derived features is
summarized in Table 1.
The time-domain features were directly derived
from the preprocessed time series data. These features
capture the statistical and morphological
characteristics of the intraday time series data.
Frequency-domain features were derived from the
Fourier transform of the original time series data.
These features capture the spectral characteristics of
the intraday time-series data. Nonlinear features were
Context-aware Sleep Analysis with Intraday Steps and Heart Rate Time Series Data from Consumer Activity Trackers
173

derived after phase space construction by applying
Taken’s time-delay embedding to the time-series data
(Dingwell & Cusumano, 2000). Several nonlinear
dynamic system analytic techniques were applied for
deriving nonlinear features. These techniques
included recurrence quantitative analysis (RQA),
Poincaré plots (PP) (Hoshi et al., 2013), detrended
fluctuation analysis (DFA) (Hardstone et al., 2012),
as well as several measures of entropy (López-Ruiz
et al., 1995). These features capture the chaotic
characteristics and the complexity of the intraday
steps and heart rate time-series. The infinite and
missing values were first unified as ‘NA’ and then
imputed by the mean of the corresponding features.
3.4 Feature Selection
Feature selection is a critical step in identifying the
contextual features that are relevant and have the
strongest predictive power of the target sleep metric
(Guyon & Elisseeff, 2003). Existing feature selection
algorithms fall into three main categories: wrappers,
filters, and embedded methods. Each category has its
merits and demerits. Wrapper methods build a
predictive model to score feature subsets, which
usually provide the best-performing feature set but
are computationally intensive. Filter methods achieve
a trade-off between computational speed and the
usefulness of the feature set. Embedded methods
perform feature selection as part of the model
construction process and the computational
complexity is between the previous two categories. In
this study, we proposed an ensemble feature ranking
and selection method illustrated in Figure 3. The
proposed algorithm leverages six feature selection
algorithms to generate an average importance score
for each feature and performs feature pruning based
on a set of criteria.
As illustrated in Figure 3, the six feature selection
algorithms include one wrapper (i.e., recursive
feature elimination (RFE)), two filters (i.e., F-test and
mutual information (MI)), and three embedded
methods (i.e., multivariate linear regression, Lasso
regression, and Ridge regression). All features were
scaled between [0, 1] before being passed to the
feature selection algorithm. Each algorithm k
generated an importance score
,
for a feature x in
relation to a target sleep metric y. The
,
of all six
algorithms were scaled to the range [0, 1] and then
averaged to generate an average importance score for
feature x in relation to sleep metric y. In the meantime,
the support
,
of feature x in relation to sleep
metric y—defined as the number of algorithms that
generated a scaled
,
above 0.5—was also
computed. Pearson’s correlation coefficient and the
correspondent p-value were calculated to quantify the
linear relationship between feature x and sleep metric
y.
Table 1: Features constructed using Fitbit intraday time
series data.
Category Feature Denotation
Time-
domain
mean mean
median median
standard deviation std
variance variance
peak to peak p2p
maximum max
minimum min
absolute energy absEnergy
mean absolute
difference
meanAbsDiff
zero cross zc
skewness skew
kurtosis kurt
5
th
order moment mmt5th
Frequenc
y-domain
total spectrum totalSpec
maximal spectrum maxSpec
peak ratio peakRatio
Nonlinear recurrence rate recurRate
percent
determinism
det
average diagonal
line length
avgDiagLine
longest diagonal
line length
longestDiagLine
entropy of diagonal
lines lengths
entropyDiagLine
laminarity lam
trapping time trappingTime
longest vertical line
length
longestVertLine
entropy of vertical
lines lengths
entropyVertLine
ratio between
determinism and
recurrence rate
ratioDetRecurRate
ratio between
laminarity and
determinism
ratioLamDet
correlation
dimension
corDim
scaling exponent alpha
scaling exponent
with 50% overlap
alphaOverlap
Hurst exponent hurstExpK
Shannon entropy shannonEn
sample entropy sampEn
permutation entropy permuEn
system complexity sysComplexity
HEALTHINF 2022 - 15th International Conference on Health Informatics
174
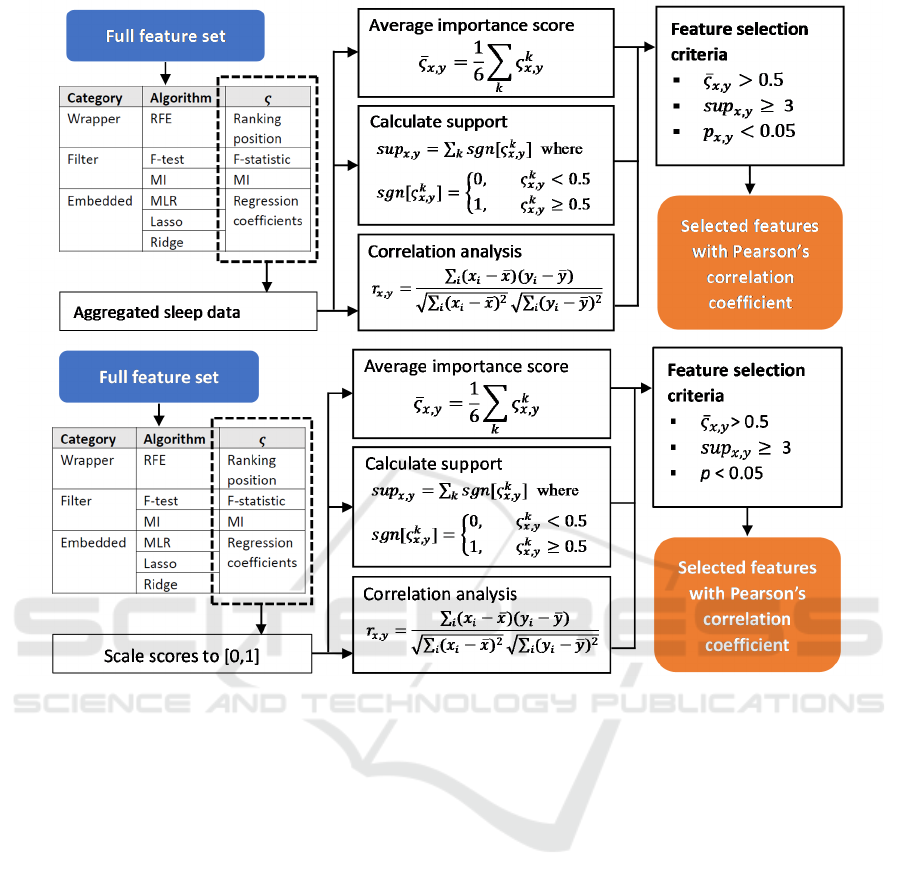
Figure 3: The proposed ensemble method for selecting the most important intraday contextual features in relation to the target
sleep metrics.
Three conditions were defined to select the most
important features: (1) ̅
,
> 0.5, (2)
,
≥ 3, and
(3) p < 0.05. The outputs of the ensemble feature
selection method were the selected contextual
features and the corresponding Pearson’s correlation
coefficients in relation to each sleep metric.
In this study, feature selection was performed at
both the individual level and the cohort level. At the
individual level, the cleaned dataset of each subject
was fed directly into the ensemble feature selection
method. At the cohort level, the datasets of all
subjects were merged before being fed into the
ensemble feature selection method. It is worth noting
that at the cohort level analysis, the repeated measures
correlation was used in place of Pearson’s correlation
to handle the dependence among observations. The
parameter α was set to 0.5 for Lasso and Ridge, and
the RFE was set to stop the search when 5 features
were left. Missing values were removed in a pair-wise
manner in correlation analysis.
4 RESULTS
The contextual features that were significantly
associated with each sleep metrics are shown in
Figure 4~6. The features were selected using the
proposed ensemble method. Red, blue, and grey cells
indicate significantly and positively correlated
important features, significantly and negatively
correlated important features, and unimportant
features, respectively. The shades of red and blue
indicate the strength of correlation. The first column
shows the result at the cohort level, and the
subsequent columns show the result for each subject.
As can be seen from figures 4-6, the identified
correlations exhibit great inter-participant differences,
while no correlation was found between the
contextual and sleep metric for P2 and P9.
Figure 4 shows the identified important
contextual features of TST. At the cohort level,
ratioDetRecurRate was the only contextual feature
Context-aware Sleep Analysis with Intraday Steps and Heart Rate Time Series Data from Consumer Activity Trackers
175
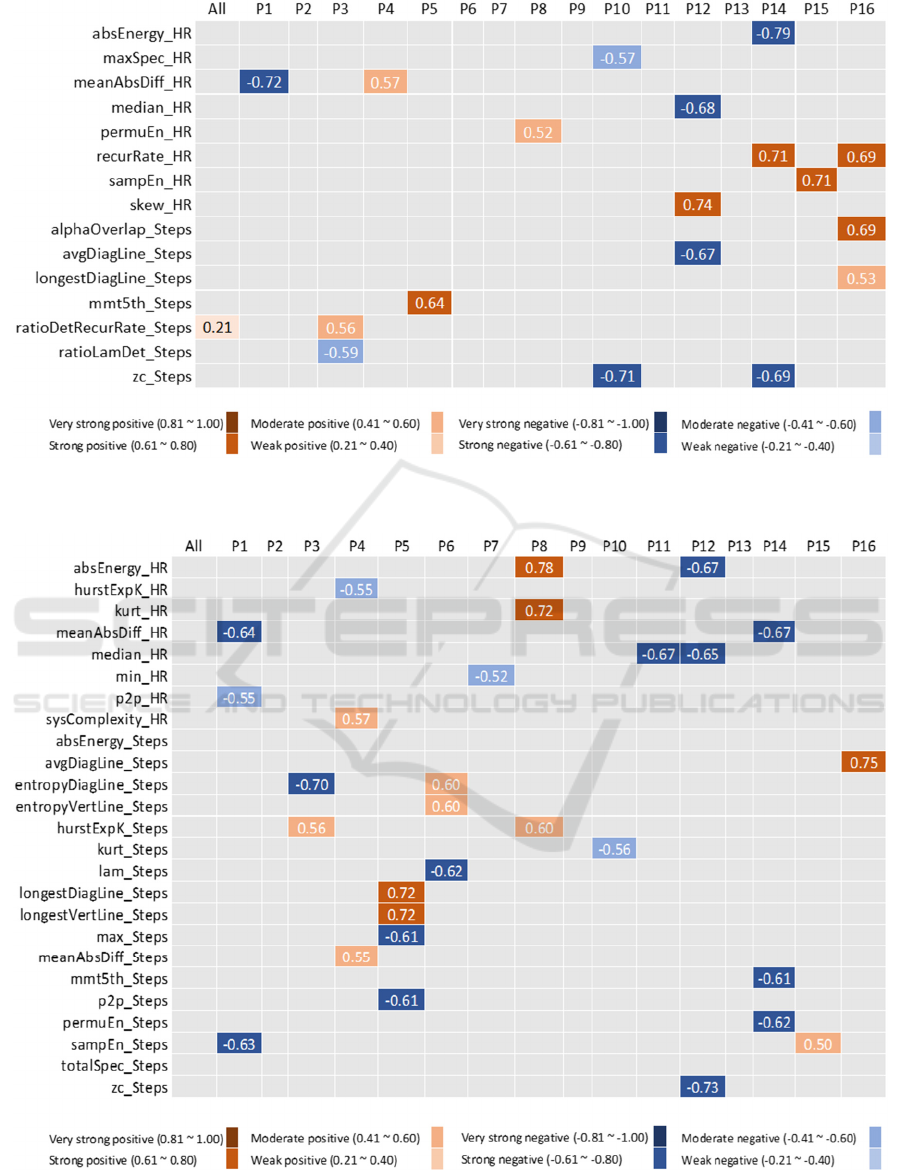
Figure 4: Contextual features that significantly correlate to TST. The value and colour shade of a cell indicate the correlation
coefficient and the correlation strength, respectively.
Figure 5: Contextual features that significantly correlate to WASO. The value and colour shade of a cell indicate the
correlation coefficient and the correlation strength, respectively.
HEALTHINF 2022 - 15th International Conference on Health Informatics
176
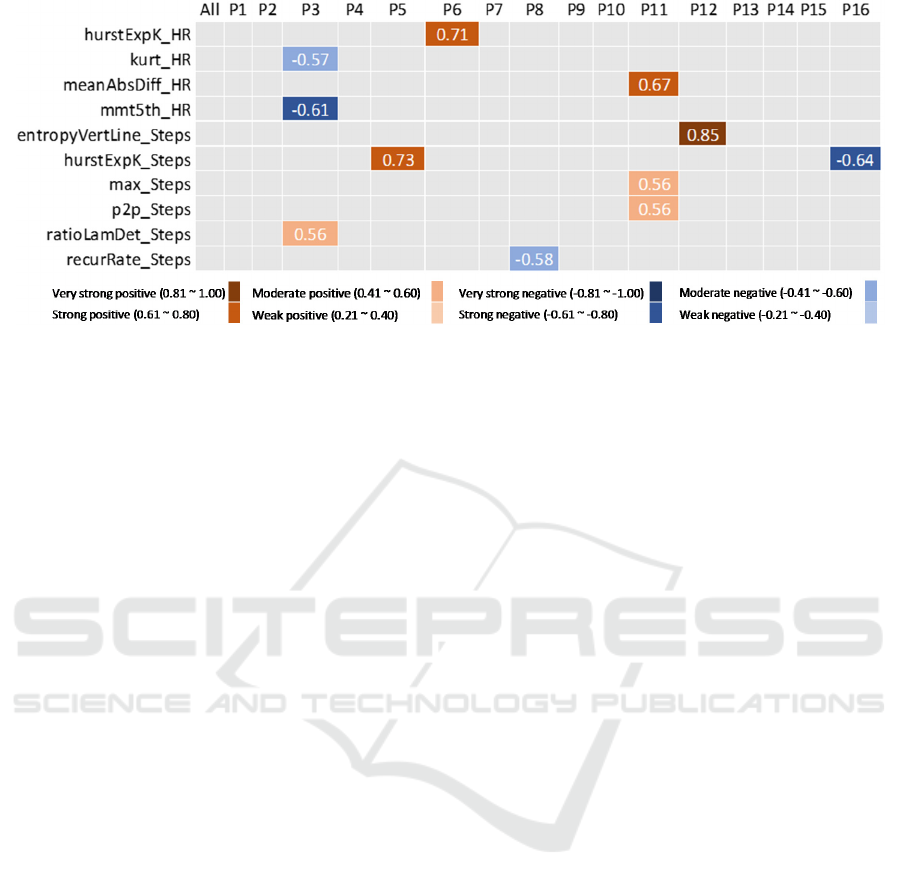
Figure 6: Contextual features that significantly correlate to the deep sleep ratio. The value and colour shade of a cell indicate
the Pearson’s correlation coefficient and the correlation strength, respectively.
that exhibits a significant correlation. This factor was
also an important factor for P3, though the correlation
strength at the cohort level was much lower than that
at the individual level. At the individual level, the
same contextual feature may demonstrate the
opposite correlation direction for different
participants. For example, meanAbsChange_HR was
negatively correlated to TST for P1 (r = -0.72, p =
0.006) but positively correlated to TST for P4 (r =
0.57, p = 0.035). The strongest correlation was found
between absEnergy_HR and TST for P14 (r = -0.79,
p < 0.001). No correlation was found between the
contextual features and TST for P2, P6, P7, P9, and
P11. Figure 5 shows the identified important
contextual features of WASO. At the cohort level, no
factor was significantly correlated to WASO. Similar
to TST, the same contextual feature may demonstrate
opposite correlation direction for different
participants. It is shown that entropyDiagLine_Steps
was a negatively correlated factor for P3 (r = -0.70, p
= 0.008) but a positively correlated factor for P6 (r =
0.60, p = 0.010), and sampEn_Steps was a negatively
correlated factor or P1 (r = -0.63, p = 0.020) but a
positively correlated factor for P15 (r = 0.50, p =
0.020). Significant inter-subject differences were
observed. P4 and P5 had the highest number of
correlated features, while no correlation was found
for P2, P9, and P13.
Figure 6 shows the identified important
contextual features of the deep sleep ratio. No
contextual feature was selected at the cohort level. At
the individual level, no contextual feature was
selected for 9 out of 16 participants. P3 and P11 had
the highest number of selected features for the deep
sleep ratio.
5 DISCUSSIONS
With the burgeon of consumer sleep tracking
technologies, there has been an increasing analytical
need to interpret personal sleep data within a user’s
behavioural and physiological context. In response to
this need, several prior studies have considered the
relationships between sleep and the daily
aggregations of contextual factors (Bauer et al., 2012;
Bentley et al., 2013; Kay et al., 2012; Liang, Ploderer,
et al., 2016), but the intraday temporal patterns of the
contextual factors were largely neglected. In this
study, we directed the focus to the intraday temporal
patterns and characteristics of the heart rate and step
time-series data, which can be readily measured
together with sleep data using consumer activity
trackers such as Fitbit. We derived time-domain,
frequency-domain, and nonlinear features from the
minute-by-minute intraday time series and proposed
an ensemble feature selection method to identify the
most important intraday features that were
significantly associated to target sleep metrics.
This study yielded two principal findings. First,
the intraday temporal patterns of the behavioural and
physiological data collected with consumer activity
trackers encoded valuable contextual information for
sleep analysis. Second, the correlation analysis results
generated at the cohort level are likely to deviate from
the correlations at the individual level.
Some of the identified contextual features could
lead to intuitive interpretations that generated
actionable insights. The zero-crossing of the intraday
step time-series was an important contextual factor at
the individual level for TST and WASO. At the
individual level, it shows that a decrease in zero-
crossing was associated with increased sleep hours
Context-aware Sleep Analysis with Intraday Steps and Heart Rate Time Series Data from Consumer Activity Trackers
177

for P10 and P14, but increased wake time for P12.
Since zero-crossing is an indicator of the noisiness of
a signal (Liang, 2021), it is indicated that P10 and P14
were likely to achieve longer sleep hours by
improving the regularity of their daily physical
activity, while P12 may pursue the opposite to reduce
wake time during sleep. Zero-crossing has been an
important feature in EEG-based automatic sleep
staging (Şen et al., 2014). Our finding suggests that
the zero-crossing of intraday step time series
collected using consumer activity trackers may serve
as a predictor of night sleep, though it requires further
analysis to confirm this hypothesis.
The mean absolute difference of the intraday heart
rate time series was an important contextual factor of
all the target sleep metrics at the individual level. An
increase in the mean absolute difference of the
intraday heart rate was associated with increased TST
for P4, decreased WASO for P1 and P14, and
increased deep sleep ratio for P11. Since being
engaged in more intense physical activity during the
day is linked to the increased mean absolute
difference in heart rate, these participants may
attempt to integrate exercise into daily routines for
better sleep at night.
Contextual factors such as the absolute energy of
the intraday heart rate time series also yielded
actionable insights. An increase in the absolute
energy of the heart rate time series was positively
associated with WASO for P8 but was negatively
associated with WASO for P12. Correspondently, P8
may benefit from spending more time in the low heart
rate zone while P12 may benefit from the opposite.
On the other hand, some of the nonlinear features
may not provide insights that can be immediately
acted on, but they may generate interesting
hypotheses that inspire further scientific studies.
Several selected nonlinear features were derived from
the intraday step time series using recurrence
quantitative analysis (RQA). For example, the
average diagonal line length (negatively associated to
TST for P12 and positively associated to WASO for
P16), the longest diagonal line length (positively
associated to WASO for P5 and to TST for P16), the
entropy of the vertical line length (positively
correlated to WASO P6 and to deep sleep ratio for
P12) were important contextual features of sleep for
certain participants. Chaos-based analysis of human
physiological data has become widely adopted for
diagnosing motor-control and cardiovascular diseases
(Dingwell & Cusumano, 2000; Wu et al., 2009).
Similarly, the nonlinear chaotic features derived from
the intraday personal health data may represent a
promising method for predicting sleep quality or
diagnosing sleep problems in daily life settings.
6 CONCLUSIONS
In this study, we demonstrated the importance of
considering the intraday temporal patterns of steps
and heart rate for context-aware sleep analysis with
personal health data. The statistical, spectral,
morphological, and nonlinear features of the intraday
time series could all provide valuable predictive
information of sleep at night and should be routinely
included in personal informatics analysis. While
some intraday features provided actionable insights
that could guide behaviour change for better sleep,
others may generate interesting hypotheses that
inspire further scientific studies. In the meantime, the
individual-level analysis may be preferred over
cohort-level analysis for generating personalized
insights on sleep health.
ACKNOWLEDGEMENTS
This work was supported by JSPS KAKENHI Grant
Number 16H07469, 19K20141, and 21K17670.
REFERENCES
Bauer, J., Consolvo, S., Greenstein, B., & al., e. (2012).
ShutEye: encouraging awareness of healthy sleep
recommendations with a mobile, peripheral display. In
Proceedings of the SIGCHI Conference on Human
Factors in Computing Systems, Austin, Texas, USA.
Bentley, F., Tollmar, K., Stephenson, P., Levy, L., Jones,
B., Robertson, S., Wilson, J. (2013). Health Mashups:
presenting statistical patterns between wellbeing data
and context in natural language to promote behavior
change. ACM Transactions on Computer-Human
Interaction (TOCHI), 20(5), Article No. 30.
Buysse, D. J. (2014). Buysse DJ. Sleep Health: Can We
Define It? Does It Matter? Sleep . 2014;37(1):9-17.
doi:10.5665/sleep.3298. Sleep, 37(1), 9-17.
Daskalova, N., Metaxa-Kakavouli, D., Tran, A., et al.
(2016). SleepCoacher: A Personalized Automated Self-
Experimentation System for Sleep Recommendations.
In Proceedings of the 29th Annual Symposium on User
Interface Software and Technology, Tokyo, Japan.
De Zambotti, M., Cellini, N., Goldstone, A., Colrain, I., &
Baker, F. (2019). Wearable sleep technology in clinical
and research settings. Med Sci Sports Exerc, 51(7),
1538-1557.
HEALTHINF 2022 - 15th International Conference on Health Informatics
178

Dingwell, J. B., & Cusumano, J. (2000). Nonlinear time
series analysis of normal and pathological human
walking. Chaos, 10(4), 848-863.
Guyon, I., & Elisseeff, A. (2003). An introduction to
variable and feature selection. J. Mach. Learn. Res.,
3(JMLR.org), 1157-1182.
Hardstone, R., Poil, S.-S., Schiavone, G., Jansen, R.,
Nikulin, V. V., Mansvelder, H. D., & Linkenkaer-
Hansen, K. (2012). Detrended fluctuation analysis: a
scale-free view on neuronal oscillations. Frontiers in
Physiology, 3, 450.
Hoshi, R. A., Pastre, C. M., Vanderlei, L. C. M., & Godoy,
M. F. (2013). Poincaré plot indexes of heart rate
variability: relationships with other nonlinear variables.
Auton Neurosci., 177(2), 271-274.
Kay, M., Choe, E. K., Shepherd, J., & al., e. (2012).
Lullaby: a capture & access system for understanding
the sleep environment. In Proceedings of the 2012 ACM
Conference on Ubiquitous Computing, Pittsburgh,
Pennsylvania.
Liang, Z. (2021). What does sleeping brain tell about stress?
A pilot fNIRS study into stress-related cortical
hemodynamic features during sleep. Frontiers in
Computer Science.
Liang, Z., & Chapa-Martell, M. A. (2018). Validity of
consumer activity wristbands and wearable EEG for
measuring overall sleep parameters and sleep structure
in free-living conditions. Journal of Healthcare
Informatics Research, 1-27.
Liang, Z., & Chapa-Martell, M. A. (2019). Accuracy of
Fitbit wristbands in measuring sleep stage transitions
and the effect of user-specific factors. JMIR Mhealth
Uhealth, 7(6), e13384.
Liang, Z., & Chapa-Martell, M. A. (2021). A Multi-level
classification approach for sleep stage prediction with
processed data derived from consumer wearable
activity trackers. Frontiers in Digital Health, 3,
665946.
Liang, Z., Chapa-Martell, M. A., & Nishimura, T. (2016).
Mining hidden correlations between sleep and lifestyle
factors from quantified-self data. In Proceedings of the
2016 ACM International Joint Conference on
Pervasive and Ubiquitous Computing: Adjunct,
Heidelberg, Germany.
Liang, Z., & Ploderer, B. (2016). Sleep tracking in the real
world: a qualitative study into barriers for improving
sleep. In Proceedings of the 28th Australian
Conference on Computer-Human Interaction,
Launceston, Tasmania, Australia.
Liang, Z., & Ploderer, B. (2020). “How Does Fitbit
Measure Brainwaves”: A Qualitative Study into the
Credibility of Sleep-tracking Technologies. Proc. ACM
Interact. Mob. Wearable Ubiquitous Technol., 4(1),
Article 17.
Liang, Z., Ploderer, B., Liu, W., Nagata, Y., Bailey, J.,
Kulik, L., & Li, Y. (2016). SleepExplorer: a
visualization tool to make sense of correlations between
personal sleep data and contextual factors. Personal
Ubiquitous Comput., 20(6): 985-1000.
López-Ruiz , R., Mancini , H. L., & Calbet , X. (1995).
A statistical measure of complexity. Physics Letters A,
209(5-6), 321-326.
Molenaar, P. C. M. (2004). A manifesto on psychologyas
idiographic science: bringing the person back into
scientific psychology, this time forever. Measurement
Interdisciplinary Research and Perspectives, 2(4): 201-
218.
Park, S., Li, C.-T., Han, S., Hsu, C., Lee, S. W., & Cha, M.
(2019). Learning sleep quality from daily logs. In
Proceedings of the 25th ACM SIGKDD Conference on
Knowledge Discovery and Data Mining, USA.
Peach, H. D., Gaultney, J. F., & Ruggiero, A. R. (2018).
Direct and indirect associations of sleep knowledge and
attitudes with objective and subjective sleep duration
and quality via sleep hygiene. The Journal of Primary
Prevention, 39(6), 555-570.
Wang, C., Lizardo, O., & Hachen, D. S. (2021). Using Fitbit
data to examine factors that afftect daily activity levels
of college students. PLOS ONE 16(1): e0244747.
Weatherall, J., Paprocki, Y., Meyer, T. M., Kudel, I., &
Witt, E. A. (2018). Sleep tracking and exercise in
patients with type 2 diabetes mellitus (step-D): pilot
study to determine correlations between Fitbit data and
patient-reported outcomes. JMIR Mhealth Uhealth,
6(6), e131.
Wu, G.-Q., Arzeno, N. M., Shen, L.-L., Tang, D.-K.,
Zheng, D.-A., Zhao, N.-Q., Poon, C.-S. (2009). Chaotic
Signatures of Heart Rate Variability and Its Power
Spectrum in Health, Aging and Heart Failure. PLOS
ONE 4(2): e4323.
Yurkiewicz, I. R., Simon, P., Liedtke, M., Dahl, G., &
Dunn, T. (2018). Effect of Fitbit and iPad wearable
technology in health-related quality of life in adolescent
and young adult cancer patients. Journal of Adolescent
and Young Adult Oncology, 7(5), 579-583.
Şen, B., Peker, M., Çavuşoğlu, A., & Çelebi, F. V. (2014).
A Comparative Study on Classification of Sleep Stage
Based on EEG Signals Using Feature Selection and
Classification Algorithms. Journal of Medical Systems,
38(3), 18.
Context-aware Sleep Analysis with Intraday Steps and Heart Rate Time Series Data from Consumer Activity Trackers
179
