
A New Method to Determine Systolic Blood Pressure Indirectly Aided
by Parallel Recording of ECG and PPG
Péter Nagy
a
and Ákos Jobbágy
b
Department of Measurement and Information Systems, Faculty of Electrical Engineering and Informatics,
University of Technology and Economics, Magyar tudósok körútja 2, Budapest, Hungary
Keywords: Blood Pressure Measurement, ECG, Photoplethysmography.
Abstract: Raised blood pressure severely increases the risk of lethal cardiovascular diseases. Home monitoring of blood
pressure is vital in early detection and treatment of hypertonia. Accuracy of indirect blood pressure
measurement methods is sensitive to many physiological factors that are difficult to measure or control. The
accuracy can be improved by using further sensors. In this paper, we propose a new method for the estimation
of systolic blood pressure based on cuff pressure, ECG and photoplethysmographic (PPG) signals. PPG is
measured without hardware filtering keeping the DC-component and avoiding the problem of distorting the
signal. The proposed method was validated by applying it to healthy senior and healthy young adults at rest
and by making a measurement series containing mild physical exercise for healthy young adults. Results of
the tests clearly show the supremacy of the new method to conventional oscillometric procedure.
1 INTRODUCTION
Hypertension is a major cardiovascular risk factor and
the leading cause of death and disability-adjusted life-
years worldwide (Carey & Whelton, 2018). Early
detection and appropriate management of
hypertension is based on blood pressure (BP)
measurement, which is conventionally carried out by
a healthcare professional in the office. However, out-
of-office BP measurement has been shown to provide
more reliable estimation of the average BP of an
individual over time (Stergiou & Bliziotis, 2011).
Home BP monitoring allows the detection of white-
coat hypertension and masked hypertension and
contrary to ambulatory BP monitoring; it does not
require expensive instrumentation. For home BP
monitoring, automated oscillometric devices are
currently recommended, because they are non-
invasive, easy to use and cheap devices, requiring
little training compared to auscultatory devices
(Stergiou et al., 2018). Despite its widespread use and
many advantages, the oscillometric method has also
major limitations. First of all, the classic method
basically measures the mean arterial pressure (MAP),
systolic blood pressure (SBP) and diastolic blood
a
https://orcid.org/0000-0003-1902-0469
b
https://orcid.org/0000-0001-6569-6000
pressure (DBP) values are only calculated
(Drzewiecki, Hood & Apple, 1994). The accuracy of
the calculated SBP and DBP values is sensitive to
several physiological factors including pulse
pressure, anatomical position, elasticity and size of
the measured artery and properties of the surrounding
tissue (Tholl, Forstner & Anlauf, 2004). Increased
arterial stiffness generally impairs the accuracy of
oscillometric blood pressure measurement (van
Popele et al., 2000). Since the introduction of the
oscillometric method, several improved algorithms
have been published including amplitude- and slope-
based methods, model-based algorithms, methods
based on neural networks and machine learning and
the exploitation of extra sensor signals enabling the
calculation of the pulse wave transit time (PWTT).
Forouzanfar et al. presented a review article about the
BP measurement based on oscillometric algorithms
(Forouzanfar et al., 2015). Alghamdi et al. gave an
overview of BP measurement methods based on
machine learning and proposed a classification-based
BP estimation method (Alghamdi et al., 2020).
Despite the major progress in this field, oscillometric
BP measurement techniques still have limitations as
highlighted in (Alghamdi et al., 2020; Forouzanfar et
Nagy, P. and Jobbágy, Á.
A New Method to Determine Systolic Blood Pressure Indirectly Aided by Parallel Recording of ECG and PPG.
DOI: 10.5220/0010891400003123
In Proceedings of the 15th International Joint Conference on Biomedical Engineering Systems and Technologies (BIOSTEC 2022) - Volume 4: BIOSIGNALS, pages 221-227
ISBN: 978-989-758-552-4; ISSN: 2184-4305
Copyright
c
2022 by SCITEPRESS – Science and Technology Publications, Lda. All rights reserved
221

al., 2015). In the present paper, we focus on the
improvement of the accuracy of cuff-based indirect
SBP estimation. We propose an algorithm for the
detection of the time instant when cuff pressure (CP)
is equal to the maximum arterial pressure (supposed
to be equal to SBP) both during inflation and during
deflation of the cuff using photoplethysmography
(PPG) and the ECG signal. Results of the application
of the algorithm for recordings of healthy senior
adults and healthy young adults are also reported. The
paper does not deal with the application of PPG in
cuffless estimation of blood pressure, where the
research aim is different.
2 MATERIALS AND METHODS
2.1 SBP Estimation Aided by the PPG
Signal
PPG is an optical technique for the measurement of
cardiac-induced pulsatile changes in tissue blood
volume (Elgendi, 2012). Monitoring PPG during BP
measurement helps estimate SBP. If the PPG sensor
is placed on a finger of the same arm as the cuff is
wrapped, the occlusion of the brachial artery by the
cuff influences the PPG waveform. When CP exceeds
SBP, the brachial artery is completely occluded
during the whole heart cycle, and the pulsation in the
PPG signal disappears. During deflation, the
pulsation in the PPG signal reappears when CP falls
below SBP. Accurate designation of the time instants
corresponding to the disappearance and reappearance
of PPG pulsation is not straightforward, especially if
the signal-to-noise ratio is unfavorable. In some
studies, the authors designated these disappearance
and reappearance instants by visual inspection
(Jönsson, Laurent, Skau & Lindberg, 2005; Nitzan et
al., 2005; Nitzan et al., 2013). Visual inspection may
be appropriate for research purposes, but for devices
used in healthcare, automated methods are required.
Lubin et al. considered PPG pulses absent if the value
of the AC signal amplitude was lower than 20 % of
its maximum value (Lubin, Vray & Bonnet, 2020).
Nitzan et al. investigated both the disappearance and
reappearance of PPG pulsation. They considered PPG
pulses to disappear if the value of the maximal
derivative was lower than 1% of the mean initial
maximal derivative. For the detection of the
reappearance of the pulsation, the PPG curve was
divided into time segments corresponding to heart
cycles. Two parameters were calculated in each
segment: an area parameter, which is related to the
pulse waveform and the cross-correlation of the
signal in each segment with the signal in the
neighboring segments. The authors considered PPG
pulses to reappear if the calculated values of the area
and the cross-correlation parameters met certain
detection criteria. The authors measured PPG on the
two index fingers and used both signals for the
calculation of parameters (Nitzan, Patron, Glik &
Weiss, 2009). We have found that the 1% threshold
value of the maximal derivative could be applied to
the recordings only after high-order filtering of the
PPG signal. However, high-order filtering distorts the
signal, which is a potential source of error especially
when the derivative of the signal is small. Therefore,
we did not utilize the derivative of the PPG signal to
detect the disappearance of pulsation. Our proposed
method is new in incorporating both the amplitude
information in AC signal and the correlation between
subsequent heart cycles of the PPG curve, and in
utilizing the DC component of the PPG signal. The
ECG signal recorded in parallel with PPG gives
valuable information when the PPG amplitude is
small.
2.2 New SBP Estimation Method Aided
by the DC-coupled PPG Signal and
the ECG Signal
Our proposed method designates the disappearance
and reappearance of the pulsation in the PPG signal
by applying similar operations independently both
during inflation and deflation. The method is based
on parallel recording of three signals, the CP of the
cuff wrapped around the upper left arm, the PPG
measured on the left index fingertip and the ECG in
Einthoven II-lead. The algorithm consists of three
stages.
At the beginning of the first stage, the PPG signal
is bandpass filtered between 0.5-8 Hz and inverted so
that upward signal corresponds to higher blood
volume in the fingertip. After that, the difference
between the maximum and minimum points of the
PPG signal (AC amplitude) is calculated in a sliding
window. The window length was empirically
determined and set to 500 ms. This window length is
long enough to include the whole systolic upstroke
segment of the PPG curve even in case of low heart
rate. Next, the algorithm locates the intervals both for
inflation (Intinfl) and for deflation (Intdefl) where the
sliding window AC amplitude is permanently below
10 percent of its maximum value.
In the final step of the first stage of the algorithm,
the point is searched for where the sliding window
AC amplitude falls below a threshold level. The
threshold levels are calculated as fractions of the
BIOSIGNALS 2022 - 15th International Conference on Bio-inspired Systems and Signal Processing
222

average AC amplitude over Intinfl and Intdefl. As a
result, a short interval is allotted both for inflation and
for deflation, where the CP equals the maximum BP.
In the second stage of the algorithm, the first local
maximum and local minimum are searched for in the
bandpass filtered PPG signal that are at the beginning
of the search intervals for inflation and deflation.
These points are designated by t
PPGmax_infl
, t
PPGmin_infl
(and t
PPGmax_defl
, t
PPGmin_defl
for deflation). Two more
local maxima are localized preceding t
PPGmax_infl
(in
case of deflation following t
PPGmax_defl
), in order to
delineate two adjacent heart cycles that are required
for correlation calculation. Heart cycles are
delineated based on local maxima; three successive
local maxima enable the delineation of two heart
cycles. For the localization of PPG local maxima and
minima, the ECG signal is also used, as minima and
maxima are searched for within the time interval
between corresponding neighboring R-peaks. After
the identification of heart cycles, the correlation
coefficient (CC) is calculated between the two
adjacent heart cycles in the PPG signal, similarly to
(Nitzan et al., 2009). The shorter heart cycle is
stretched by interpolation in order to have two heart
cycles of equal length. Besides the correlation
coefficient, PWTT is calculated between the
corresponding R-peak in the ECG signal and
t
PPGmin_infl
(t
PPGmin_defl
for deflation). If CC is larger
than 0.85 and PWTT is between 100-500 ms, then a
valid PPG pulse belongs to t
PPGmax_infl
and t
PPGmin_infl
(or t
PPGmax_defl
and t
PPGmin_defl
in case of deflation).
Otherwise the supposed two adjacent heart cycles do
not exist, the pattern is considered to be noise. In case
of a valid PPG pulse, t
PPGmax_infl
and t
PPGmin_infl
are
moved to the corresponding points in the following
heart cycle; CC and PWTT are also recalculated. In
case of noise, t
PPGmax_infl
and t
PPGmin_infl
are moved to
the corresponding points in the preceding heart cycle;
CC and PWTT are also recalculated. The procedure
continues until the first heart cycle when change in
PPG is considered noise in the direction of following
heart cycles, or valid pulse in the direction of
preceding heart cycles. If one heart cycle is
considered as noise, the algorithm examines the
following two heart cycles and the preceding heart
cycle, calculates CC between all possible pairings of
heart cycles and takes the maximum of these CC
values. This step is necessary to identify irregular or
noisy heart cycles (at most two consecutive heart
cycles) that are followed by at least one valid pulse.
The outputs of the second stage t
stage2_infl_max
and
t
stage2_infl_min
are the time instants when the PPG signal
has local maximum and local minimum during the
last heart cycle that results in pulsation. In case of
deflation, the direction of moving t
PPGmax_defl
and
t
PPGmin_defl
is inverted compared to inflation, the first
heart cycle resulting in pulsation is searched for and
the outputs of the second stage are called t
stage2_defl_max
and t
stage2_defl_min
.
Figure 1: Typical DC-coupled PPG signal (solid line) and
the corresponding CP signal (dotted line). Left vertical line:
estimated time instant where CP exceeds SBP during
inflation. Right vertical line: estimated time instant where
CP falls below SBP during deflation.
In the third stage of the algorithm, DC level of the
PPG signal is also considered. Instead of the bandpass
filtered PPG signal, the lowpass filtered signal is
used; the cutoff-frequency of the filtering is 8 Hz. A
typical DC-coupled PPG signal and the CP signal
recorded in parallel are plotted in Fig. 1.
There is an upward trend in the DC level during
inflation and then the DC level starts falling when CP
is close to SBP during inflation (left vertical line).
The falling trend ends, and the DC level starts rising
again when CP is close to SBP during deflation (right
vertical line). The algorithm detects the points in the
DC-coupled PPG signal, where the trend changes as
possible candidates of time instants when CP equals
SBP during inflation and deflation. These points are
denoted by t
PPG_DC_SBP_infl
and t
PPG_DC_SBP_defl
. Then,
t
stage2_infl_max
is compared to t
PPG_DC_SBP_infl
and
t
stage2_defl_min
is compared to t
PPG_DC_SBP_defl
, because the
trend change corresponds to a local maximum during
inflation and a local minimum during deflation. If
t
stage2_infl_max
is located following t
PPG_DC_SBP_infl
, then
t
PPG_DC_SBP_infl
is rejected because a valid PPG pulse
was found following it. In that case, t
stage2_infl_max
and
t
stage2_infl_min
are considered and the time instant of the
next local minimum in the bandpass filtered PPG
signal is extrapolated. This time instant is denoted by
t
xtrp_infl
. The extrapolation is based on the length of the
previous heart cycle. The time instant where CP
0 10203040
Time (s
)
50
100
150
200
250
300
PPG DC value (a.u.)
40
60
80
100
120
140
160
180
Cuff Pressure (mmHg)
t
PPG_DC_SBP_defl
t
PPG_DC_SBP_infl
A New Method to Determine Systolic Blood Pressure Indirectly Aided by Parallel Recording of ECG and PPG
223
exceeds SBP is estimated as the midpoint between
t
stage2_infl_max
and t
xtrp_infl
. If t
stage2_infl_max
is located
preceding t
PPG_DC_SBP_infl
, then a distinction is made
depending on whether the distance of the two points
is larger than the corresponding heart period (the
length of the heart cycle) or not. If the distance is
larger, then t
PPG_DC_SBP_infl
is rejected because it is
more than one heart cycle away from the last found
valid PPG local maximum. In that case, t
stage2_infl_max
and t
stage2_infl_min
are considered, t
xtrp_infl
is designated
and the time instant where CP exceeds SBP is
estimated as the midpoint between t
stage2_infl_max
and
t
xtrp_infl
. If the distance between t
stage2_infl_max
and
t
PPG_DC_SBP_infl
is smaller than one heart period, then
t
PPG_DC_SBP_infl
is accepted as the estimate of the time
instant where CP exceeds SBP. In case of deflation,
if t
stage2_defl_min
is located preceding t
PPG_DC_SBP_defl
, or
the distance between the two time instants is larger
than one heart period, then extrapolation is done
similarly to inflation, but in the opposite direction.
The time instant where CP falls below SBP is
estimated as the midpoint between the extrapolated
local maximum in the bandpass filtered PPG signal
and t
stage2_defl_min
. If t
stage2_defl_min
is located following
t
PPG_DC_SBP_defl
, and the distance between the two time
instants is smaller than one heart period, then
t
PPG_DC_SBP_defl
is accepted as the estimate of the time
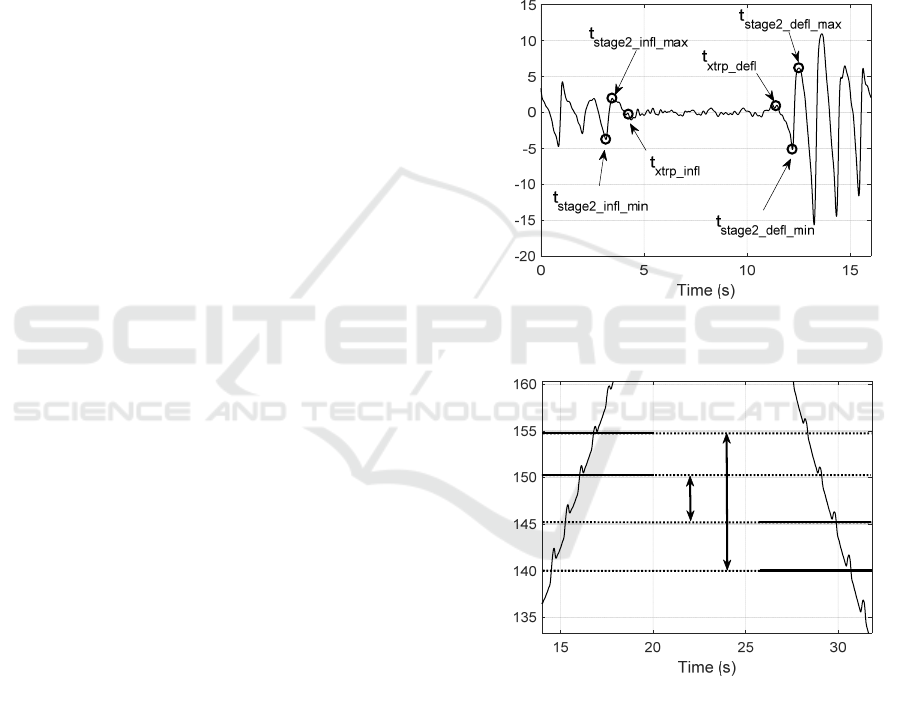
instant where CP falls below SBP. Characteristic
points designated by the algorithm in the bandpass
filtered PPG signal are illustrated in Fig. 2.
Our proposed method aims to estimate SBP with
a temporal resolution better than one heart cycle. This
means that not only heart cycles in the PPG signal are
categorized as valid PPG pulse or noise, but also the
moment when CP equals SBP is searched for within
one heart cycle. If the temporal resolution of SBP
detection is only one heart cycle, the error of the
estimated SBP difference between inflation and
deflation can be high, as demonstrated in Fig. 3.
In the given example, if it is not known, where the
time instant corresponding to SBP is located within
one heart cycle, the estimated SBP difference
between inflation and deflation can be between 5-15
mmHg.
2.3 Data Acquisition
The proposed method was tested on recordings taken
by a home health monitoring device (Nagy &
Jobbágy, 2018). The device contains an inflatable
cuff with two control valves, and it is able to keep cuff
pressure at a constant value. The device also measures
ECG in Einthoven II-lead and PPG at the fingertip
with a sampling frequency of 1 kHz. A transmission-
type PPG sensor is used to reduce the effect of motion
artifacts. The device contains no hardware filters for
ECG and PPG, in order to record undistorted signals.
As a result, DC-coupled PPG signal can be measured.
The device inflates the cuff with approximately 6
mmHg/s speed to 170 mmHg, then deflates the cuff
with the same speed. Deflation is stopped at 60
mmHg for 10 seconds. When 40 mmHg is reached
during deflation, CP changes abruptly to 0 mmHg.
(The CP=constant section makes possible the analysis
and compensation of breathing. Our results in this
field are not reported in this paper.)
Figure 2: Illustration of characteristic points designated by
the algorithm in the bandpass filtered PPG signal.
Figure 3: CP signal during inflation and deflation close to
SBP. If the temporal resolution of SBP detection is one
heart cycle, the error of the estimated SBP difference
between inflation and deflation can be high.
2.4 Tested Persons
5 healthy senior persons (age 55-64 years, 2 females,
3 males) and 13 healthy young persons (age 19-35
years, 6 females, 7 males) participated in the
measurement series reported in this paper. All tested
persons gave their informed consent. The research
PPG AC value (a.u.)
Cuff Pressure (mmHg)
BIOSIGNALS 2022 - 15th International Conference on Bio-inspired Systems and Signal Processing
224

was performed in accordance with the Declaration of
Helsinki and the study protocol was approved by the
Scientific and Research Committee of the Hungarian
Medical Research Council (SE RKEB 46/2020).
2.5 Measurement Protocol
In order to validate the proposed new algorithm, three
measurement series were used.
SBP values calculated by the algorithm are
denoted by SBP
infl
during inflation and SBP
defl
during
deflation. We denote the difference between SBP
infl
and SBP
defl
by ΔSBP as defined in (1).
ΔSBP = SBP
infl
–
SBP
defl
(1
)
The first measurement series assessed the effect
of physical stress on ΔSBP. Each person performed
20 squat jumps. 8 healthy young adults participated
in the measurement series. For each person, one
measurement was recorded by the home health
monitoring device before the exercise and
immediately after the exercise, in sitting position.
The second test series compared the ΔSBP
between seniors and young adults, measurements of
5 healthy seniors and 5 healthy young adults were
analyzed. All measurements were recorded in resting
state of the tested person, in sitting position. 3
measurements were recorded for each person.
The third measurement series aimed at testing the
within-subject variability of ΔSBP, measurements of
4 healthy young adults were analyzed. All
measurements were recorded in resting state of the
tested person, in sitting position. 8 measurements
were recorded for each person.
3 RESULTS
Table 1 – 3 show results for the effect of physical
stress, ΔSBP difference between seniors and young
adults and within-subject variability, respectively.
The proposed algorithm gives a good estimate of
SBP
infl
and SBP
defl
. The reference SBP
infl
and SBP
defl
values (used as gold standards) were determined by
visual evaluation: the CP value when pulsation in
PPG disappears or reappears. Based on the ECG R
peak position we could restrict the range within every
heartbeat where pulsation in PPG can be present. This
helps especially when the signal-to-noise ratio is low.
50 recordings were selected for visual analysis to
evaluate the accuracy of the algorithm including 5
recordings after physical exercise, 15 recordings from
healthy seniors and 30 recordings from healthy young
subjects.
Table 1: The effect of physical stress.
Person
Identifier
a
ΔSBP
(
mmH
g)
Before
exercise
After
exercise
Change
Y1 4.4 -2.8 -7.2
Y2 7.1 5.6 -1.5
Y3 -4.2 9.3 13.5
Y4 3.7 -1.3 -5.0
Y5 11.9 12.7 0.8
Y6 1.7 -0.8 -2.5
Y7 7.1 4.8 -2.3
Y8 -3.8 4.3 8.1
Y1 4.4 -2.8 -7.2
Y2 7.1 5.6 -1.5
a. Eight healthy young subjects.
Table 2: Senior-young group average.
Group
a
ΔSBP
(
mmH
g)
Mean
b
Min Max
Senio
r
-1.2 -11.5 10.6
Young 4.1 -5.0 11.6
a. Five senior healthy subjects, five young healthy
subjects.
b. Three measurements taken for each subject, sitting
position, resting state.
Table 3: Within-subject variability.
Person
Identifier
a
ΔSBP
(
mmH
g)
Mean
b
Min Max
Y9 5.1 -0.1 8.2
Y10 5.8 -5.0 14.2
Y11 8.3 -0.1 13.4
Y12 7.0 -3.3 15.2
a. Four young healthy subjects.
b. Eight measurements taken for each subject, sitting
position, resting state.
4 DISCUSSION
The values determined by the suggested new
algorithm are within a narrow range around the gold
standard. The mean value and standard deviation of
the difference between values determined by the
algorithm and the gold standard was -0.7 ± 1.5 mmHg
for SBP
infl
and -0.3 ± 1.8 mmHg for SBP
defl
. In 88 %
of the 50 examined recordings, the absolute error of
the algorithm compared to the gold standard is below
3 mmHg. Considering the 6 mmHg/s speed of
inflation and deflation, this corresponds to a temporal
resolution much better than one heart cycle. The
proposed new algorithm assures better than usual
resolution in SBP determination. This is necessary for
the
appropriate evaluation of the three measurement
A New Method to Determine Systolic Blood Pressure Indirectly Aided by Parallel Recording of ECG and PPG
225

series.
CP values corresponding to time instants when CP
is supposed to be equal to SBP indicated by the PPG
signal may considerably differ during inflation and
deflation. Both for seniors and for young adults, the
largest absolute difference found was more than 10
mmHg. This difference cannot be evaluated using the
usual indirect BP measurement methods. The method
proposed in this paper assures the necessary
resolution and accuracy.
The effect of physical stress on ΔSBP showed
large variability among individuals, in both
magnitude and direction. The change in ΔSBP was
negative for 5 persons and positive for 3 persons, with
the smallest absolute value of 0.8 mmHg and the
largest absolute value of 13.5 mmHg. Sign of ΔSBP
changed for five persons because of exercise.
Interestingly, the person showing the largest ΔSBP
value before exercise (Y5) showed the smallest
change in ΔSBP because of exercise. ΔSBP gives
information basically on the circulation in the upper
arm.
Group-level comparison of senior and young
adults revealed negative mean ΔSBP value for seniors
and positive mean ΔSBP value for young adults.
Although negative ΔSBP values appeared also for
young individuals, this result suggests that people
with increased arterial stiffness tend to produce more
negative ΔSBP values.
ΔSBP values showed high within-subject
variability (more than 8 mmHg difference of the
minimum and maximum values) for all four tested
persons although the mean ΔSBP was higher than 5
mmHg for each of them. This result shows that one
single measurement of ΔSBP may not be sufficient to
estimate the state of the cardiovascular system of a
tested person.
DC level of the PPG signal contains valuable
information aiding SBP estimation. However, valid
pulses were found following t
PPG_DC_SBP_infl
and
preceding t
PPG_DC_SBP_defl
in some cases suggesting
that the DC level of PPG is influenced by more
factors. Occlusion of the artery by the cuff is a
dominant factor as DC level shows a rising trend
during inflation in all cases.
We compared our results with the work of Zheng
et al. who investigated the mechanical behavior of the
brachial artery during cuff inflation and deflation
(Zheng, Pan & Murray, 2013). The authors compared
SBP, DBP and MAP values measured during
inflation and deflation of the cuff by manual
auscultatory and automated oscillometric methods.
SBP from inflation was found to be statistically
significantly lower than SBP from deflation,
measured by both the manual and the automated
method. This result was not justified by our
measurements. The difference in SBP during inflation
and deflation was studied also by other researchers
(Fabian et al., 2016).
SBP
infl
and SBP
defl
are close to each other.
Comparing them needs a measurement method with
good resolution. In this regard, the method we
propose outperforms other methods. It finds the
disappearance and reappearance of the PPG signal
with better time resolution than a heartbeat while
other methods can detect these fiducial points with
heartbeat resolution only.
5 CONCLUSIONS
Accurate indirect BP measurement is the cornerstone
of the detection and management of hypertension. In
this paper, we proposed a new method for the
estimation of SBP using CP, ECG and DC-coupled
PPG signals. It eliminates the most severe device
dependent limitation associated with indirect BP
measurement, thus our method offers more accurate
non-invasive estimation than the presently available
other methods even in the case of arrhythmia. In the
near future, the algorithm will be applied to patients
with Left Ventricular Assist Device, LVAD. The non-
invasive blood pressure measurement of these
patients is important but cumbersome, requiring
special expertise. Our proposed method is applicable
for them also at home, without medical expert.
ACKNOWLEDGEMENTS
The research reported in this paper and carried out at
the Budapest University of Technology and
Economics was supported by the “TKP2020,
National Challenges Program” of the National
Research Development and Innovation Office (BME
NC TKP2020).
REFERENCES
Alghamdi, A. S., et al. (2020). A novel blood pressure
estimation method based on the classification of
oscillometric waveforms using machine-learning
methods. Applied Acoustics, 164(5), 107279.
Carey, R. M. & Whelton, P. K. (2018). Prevention,
detection, evaluation, and management of high blood
pressure in adults: synopsis of the 2017 American
College of Cardiology/American Heart Association
BIOSIGNALS 2022 - 15th International Conference on Bio-inspired Systems and Signal Processing
226

Hypertension Guideline. Annals of Internal Medicine,
168(5), 351-358.
Drzewiecki, G., Hood, R. & Apple, H. (1994). Theory of
the oscillometric maximum and the systolic and
diastolic detection ratios. Annals of Biomedical
Engineering, 22(1), 88-95.
Elgendi, M. (2012). On the analysis of fingertip
photoplethysmogram signals. Current Cardiology
Reviews, 8(1), 14-25.
Fabian, V., Havlik, J., Dvorak, J., Kremen, V., Sajgalik, P.,
Bellamy, V., Schirger J.A., Sovka P. & Johnson, B. D.
(2016). Differences in mean arterial pressure of young
and elderly people measured by oscilometry during
inflation and deflation of the arm cuff. Biomedical
Engineering/Biomedizinische Technik, 61(6), 611-621.
Forouzanfar, M., et al. (2015). Oscillometric blood pressure
estimation: past, present, and future. IEEE Reviews in
Biomedical Engineering, 8, 44-63.
Jönsson, B., Laurent, C., Skau, T. & Lindberg, L. G. (2005).
A new probe for ankle systolic pressure measurement
using photoplethysmography (PPG). Annals of
Biomedical Engineering, 33(2), 232-239.
Lubin, M., Vray, D. & Bonnet, S. (2020). Blood pressure
measurement by coupling an external pressure and
photo-plethysmographic signals. In 2020 42nd Annual
International Conference of the IEEE Engineering in
Medicine and Biology Society (EMBC). IEEE.
Nagy, P., & Jobbágy, Á. (2018). Personalization of the
oscillometric blood-pressure measurement. In World
Congress on Medical Physics and Biomedical
Engineering 2018. Springer.
Nitzan, M., et al. (2005). Effects of external pressure on
arteries distal to the cuff during sphygmomanometry.
IEEE Transactions on Biomedical Engineering, 52(6),
1120-1127.
Nitzan, M., Patron, A., Glik, Z. & Weiss, A. T. (2009).
Automatic noninvasive measurement of systolic blood
pressure using photoplethysmography. Biomedical
Engineering Online, 8(1), 1-8.
Nitzan, M., et al. (2013). Comparison of systolic blood
pressure values obtained by photoplethysmography and
by Korotkoff sounds. Sensors, 13(11), 14797-14812.
Stergiou, G. S. & Bliziotis, I. A. (2011). Home blood
pressure monitoring in the diagnosis and treatment of
hypertension: a systematic review. American Journal of
Hypertension, 24(2), 123-134.
Stergiou, G. S., et al. (2018). Home blood pressure
monitoring in the 21st century. The Journal of Clinical
Hypertension, 20(7), 1116-1121.
Tholl, U., Forstner, K. & Anlauf, M. (2004). Measuring
blood pressure: pitfalls and recommendations.
Nephrology Dialysis Transplantation, 19(4), 766-770.
van Popele, N. M., et al. (2000). Arterial stiffness as
underlying mechanism of disagreement between an
oscillometric blood pressure monitor and a
sphygmomanometer. Hypertension, 36(4), 484-488.
Zheng, D., Pan, F. & Murray, A. (2013). Effect of
mechanical behaviour of the brachial artery on blood
pressure measurement during both cuff inflation and
cuff deflation. Blood Pressure Monitoring, 18(5), 265-
271.
A New Method to Determine Systolic Blood Pressure Indirectly Aided by Parallel Recording of ECG and PPG
227
