
Understanding Public Opinion on using Hydroxychloroquine for
COVID-19 Treatment via Social Media
Thuy T. Do
1
, Du Nguyen
2
, Anh Le
3
, Anh Nguyen
4
, Dong Nguyen
4
, Nga Hoang
5
, Uyen Le
6
and Tuan Tran
6,∗
1
Dept. of Computer Science, UMass Boston, MA. U.S.A.
2
Dept.of Nursing, Metropolitan State University of Denver, U.S.A
3
Independent Researcher, Vietnam
4
SaolaSoft Inc., Denver, CO, U.S.A.
5
University of Colorado Boulder, Boulder, CO, U.S.A.
6
California Northstate University, Elk Grove, CA, U.S.A.
nga.hoang-1@corolado.edu, {uyen.le, tuan.tran}@cnsu.edu
Keywords:
Covid-19, Hydroxychloroquine, Sentiment Analysis, Text Mining.
Abstract:
Hydroxychloroquine (HCQ) is used to prevent or treat malaria caused by mosquito bites. Recently, the drug
has been suggested to treat COVID-19, but that has not been supported by scientific evidence. The informa-
tion regarding the drug efficacy has flooded social networks, posting potential threats to the community by
perverting their perceptions of the drug efficacy. This paper studies the reactions of social network users on
the recommendation of using HCQ for COVID-19 treatment by analyzing the reaction patterns and sentiment
of the tweets. We collected 164,016 tweets from February to December 2020 and used a text mining approach
to identify social reaction patterns and opinion change over time. Our descriptive analysis identified an irreg-
ularity of the users’ reaction patterns associated tightly with the social and news feeds on the development
of HCQ and COVID-19 treatment. The study linked the tweets and Google search frequencies to reveal the
viewpoints of local communities on the use of HCQ for COVID-19 treatment across different states. Further,
our tweet sentiment analysis reveals that public opinion changed significantly over time regarding the recom-
mendation of using HCQ for COVID-19 treatment. The data showed that high support in the early dates but
it significantly declined in October. Finally, using the manual classification of 4,850 tweets by humans as our
benchmark, our sentiment analysis showed that the Google Cloud Natural Language algorithm outperformed
the Valence Aware Dictionary and sEntiment Reasoner in classifying tweets, especially in the sarcastic tweet
group.
1 INTRODUCTION
Hydroxychloroquine (HCQ) is known as a medica-
tion to treat and prevent malaria. It is also used for
the treatment of rheumatoid arthritis, lupus, and por-
phyria cutanea tarda (Mutlu et al., 2020). During the
spreading of COVID-19 viruses in 2020, there was
some discussion on the effectiveness of using HCQ
in treating COVID-19 in some cases (Mutlu et al.,
2020). However, there were no clinical trials with a
sufficiently large cohort to provide concrete evidence
on the effectiveness of the drug on COVID-19 treat-
ment. Despite lacking scientific evidence on the ef-
∗
Corresponding author
ficacy of the drug, using HCQ for COVID-19 treat-
ment (or H4C for short) quickly became a hot topic
dominating social media and news. All clinical tri-
als conducted during 2020 found that the drug was
ineffective and might cause severe side effects for
COVID-19 patients (Mutlu et al., 2020). This mis-
leading information may put pressure on healthcare
systems and society. On one hand, high demand for
the drug may be escalated, making it unavailable for
prescribed patients. Moreover, COVID-19 patients
use the drug for treatment may result in severe side ef-
fects that could overload the healthcare systems. Un-
derstanding the viewpoints of the community on H4C
would help the public health policymakers to develop
Do, T., Nguyen, D., Le, A., Nguyen, A., Nguyen, D., Hoang, N., Le, U. and Tran, T.
Understanding Public Opinion on using Hydroxychloroquine for COVID-19 Treatment via Social Media.
DOI: 10.5220/0010884200003123
In Proceedings of the 15th International Joint Conference on Biomedical Engineering Systems and Technologies (BIOSTEC 2022) - Volume 5: HEALTHINF, pages 631-639
ISBN: 978-989-758-552-4; ISSN: 2184-4305
Copyright
c
2022 by SCITEPRESS – Science and Technology Publications, Lda. All rights reserved
631

preventive measures and policy to guide and provide
safety to society.
Current tools such as web-based questionnaire
surveys or phone interviews to collect the data from
the community are time-consuming, labor-intensive,
and costly. Moreover, the long delays of data gather-
ing can make the time-critical decisions suffered. It
is important to develop an effective method to collect
data and extract the opinions of society. In this study,
we proposed to utilize social media to accomplish this
goal.
By October 2020, Twitter has more than 47 mil-
lion accounts from the US with 56 percent males and
44 percent females (updated on 10/10/2020) (Twitter,
2020). Real-time monitoring of public health based
on data from social media is promising. In addition,
thanks to the availability of APIs and services, col-
lecting data from social media platforms is straight-
forward. In this study, we analyzed the tweets posted
on Twitter to understand the opinions of social me-
dia users, and society in general, on the use of HCQ
for COVID-19 treatment. We conducted both descrip-
tive analysis and sentiment analysis to reveal the hid-
den reaction patterns and the shifting of their per-
ceptions on H4C over time. We linked the tweets
and Google keyword search frequencies to shed light
on the hidden information of the users’ opinions on
the topic in the space domain. We also evaluated
and compared the performance of the state-of-the-
art sentiment analysis tools including Google Cloud
Natural Language API (GCNL) and Valence Aware
Dictionary and Sentiment Reasoner Python library
(VADER) on the tweets as well.
There is some existing work studying online dis-
cussions on hydroxychloroquine for COVID-19 treat-
ment. The authors in (Hamamsy and Bonneau, 2020)
calculated the number of tweets mentioning this drug
per day from Feb 28 to May 22, 2020, on Twitter
to reveal the patterns. They also computed the av-
erage sentiment per day to understand the opinions of
users on the topic. They found that peaks of reac-
tions on HCQ posts appeared after the days’ Trump
promoted HCQ on social media. In another study
(Xue et al., 2020), the authors analyzed Twitter dis-
cussions and emotions using a machine learning ap-
proach. In this study, a tweet was classified into one
of the eight classes of emotions and one of the thir-
teen topics to understand the users’ opinions. Data
showed that “anticipation” was the most dominant
theme while “surprise” is the least across all 13 topics.
Furthermore, the authors in (Niburski and Niburski,
2020) studied the impact of Trump’s promotion of
HCQ for COVID-19 patients by analyzing social me-
dia content. It’s reported that the frequencies substan-
tially increased after Trump’s discussions about HCQ.
However, all of these studies limited their findings in a
very short period ((Niburski and Niburski, 2020) has
only 2 months) and that may not be sufficient to re-
veal the changing of the opinions associated with the
development of the pandemic.
Our work expands the existing frameworks by col-
lecting a more complete dataset spanning in much
longer time duration (10 months). In addition, we
conducted both descriptive analysis and sentiment
analysis of the tweets to understand the opinions of
users over time. To the best of our knowledge, we
are one of the first studies to link tweets, Google key-
word search frequencies, and data from the Centers
for Disease Control and Prevention (CDC) to reveal
the users’ reaction patterns on H4C. Finally, we con-
ducted a manual classification of 4,850 tweet senti-
ments to evaluate and compare the existing state-of-
the-art sentiment analysis tools including GCNL and
VADER. In summary, our contributions in this study
include:
1. More Complete Dataset: We collected 164,016
HCQ related tweets from February to December
of 2020 in our study. The collected data provides
a more complete picture of society’s perspectives
on the use of HCQ for COVID-19 treatment. This
is one of the most complete datasets on the topic
that has been collected so far.
2. Identifying Reactions Patterns in both Time
and Space Domains: We conducted both descrip-
tive and sentiment analysis in both time and space
domains to reveal the reaction patterns of both
online and geographically local communities on
H4C.
3. Linking Multiple Data Sources to Reveal Hid-
den Reaction Patterns: We also linked data from
Twitter, Google, and CDC to identify reaction pat-
terns and the relationship between “listening” (re-
actions on Twitter) and “doing” (search queries
on Google) and “did” (purchased drug, CDC re-
ports).
4. Conducting Manual Classifier: In this study, we
manually classified 4,850 tweets associated with
important events of the HCQ and COVID-19 de-
velopments to evaluate and compare the existing
sentiment analysis tools. To our best knowledge,
this is one of the largest US-based users datasets
of tweets regarding COVID-19 and HCQ. We plan
to share this dataset with the research community
upon completion of this project.
The remainder of the paper is as follows. In Section
II, we present our system architecture and data pro-
cessing workflow. In Section III, we describe our data
HEALTHINF 2022 - 15th International Conference on Health Informatics
632

analysis methodology. We then describe the research
results and discussions in Section IV. Finally, we pro-
vide some concluding remarks and future directions
in Section V.
2 SYSTEM ARCHITECTURE
AND DATA PROCESSING
WORKFLOW
Our system architecture and data processing work-
flow is illustrated in Fig. 1. The system consists of
two main components:
• Data Collection: The first component of the sys-
tem is “Data collection”. In this process, we used
different techniques to collect data from Twitter,
Google Trend, and the Centers for Disease Con-
trol and Prevention (CDC) database.
– Twitter API: To collect related tweets on Twit-
ter (Twitter, 2020), we developed a Python
script that connected to the Twitter API to
search for related tweets. We used “hydrox-
ychloroquine” as the keyword, duration from
February 2020 to December 2020 as time pe-
riod, and the U.S. as the location for our query.
The retrieved objects of the query were in the
JSON format that includes metadata of the
tweets consisting of the text of tweets, tweets’
time stamp, reactions (e.g., “love”, “favorite”),
etc.
– Google Trend: We also queried Google Trend
platform (Google, 2020b) to collect data of key-
word search regarding hydroxychloroquine as
well. We used the same keyword, time dura-
tion, and location as specified in the query used
on Twitter. The retrieved data consists of search
scores and time stamps of the search volumes in
different states. We should emphasize that the
search scores were normalized, ranging from
0 (no search queries) to 100 (maximum search
queries).
– CDC Prescribing Patterns: We also collected
prescribing patterns of hydroxychloroquine and
chloroquine from the database of CDC between
January and June of 2019 and 2020 (Bull-
Otterson et al., 2020). We used prescribing data
of both drugs as they are clinical equivalence in
treatment.
All the collected data from the sources are stored
locally in our data warehouse using MongoDB.
• Data Preprocessing and Sentiment Analysis:
The second component of our system architecture
is the “Data pre-processing and sentiment analy-
sis”.
– Data Query and Pre-processing: Text min-
ing on social media is challenging due to un-
structured and noisy data (Salloum et al., 2017).
Thus, before analyzing the data for patterns
and text sentiment, we filtered out noise using
database query and data pre-processing.
*
MongoDB Query: We queried our local
database to extract related tweets and con-
verted the retrieved tweets into a table format
where each row represents a tweet and each
column represents an attribute of the tweet
(e.g., text, timestamp, etc.). A sample of the
tweets is illustrated in Fig. 2 with highlighted
search keyword and sentiment words.
*
Data Pre-processing: Next, we developed R
and Python scripts to pre-process the tweets
before feeding the data to the algorithms for
performing descriptive analysis and sentiment
analysis. The following procedures are per-
formed in our pre-processing step:
· Remove non-English Tweets: In the first step,
we remove all tweets having the keyword but
written in different languages. This is to en-
sure the count of tweet frequencies and their
sentiments consistent. We use the Python
package “Enchant” (Enchant, 2021) to detect
and delete words of tweets not in English.
· Remove Duplication, Punctuation, URLs,
HTML Tags and Entities (e.g., &): In
this step, we used a search and lookup script
written in Python to remove all punctua-
tions, URLs, HTML tags, and entities (e.g.,
&) which do not contribute to the senti-
ment of the tweets. In addition, we compared
the ID and time stamp to remove duplicated
tweets in this step as well. This is to prevent
spurious sentiment scores due to the duplica-
tion of tweets.
· Word Lemmatisation and Stop-word Re-
moval: In addition, we converted words
from different forms to their root forms.
For instance, “happier/Happier”, “happi-
est/Happiest” and “happily/Happily” are
converted to its original form “happy”. In
other words, word lemmatization is a text
normalization that reduces the redundant di-
mensionality of the text. This step is impor-
tant to ensure the accuracy of our sentiment
analysis in the next step. We also performed
stop-word removal at this step as well. Stop-
words are commonly used words but not
contributing to the sentiment of a sentence
Understanding Public Opinion on using Hydroxychloroquine for COVID-19 Treatment via Social Media
633
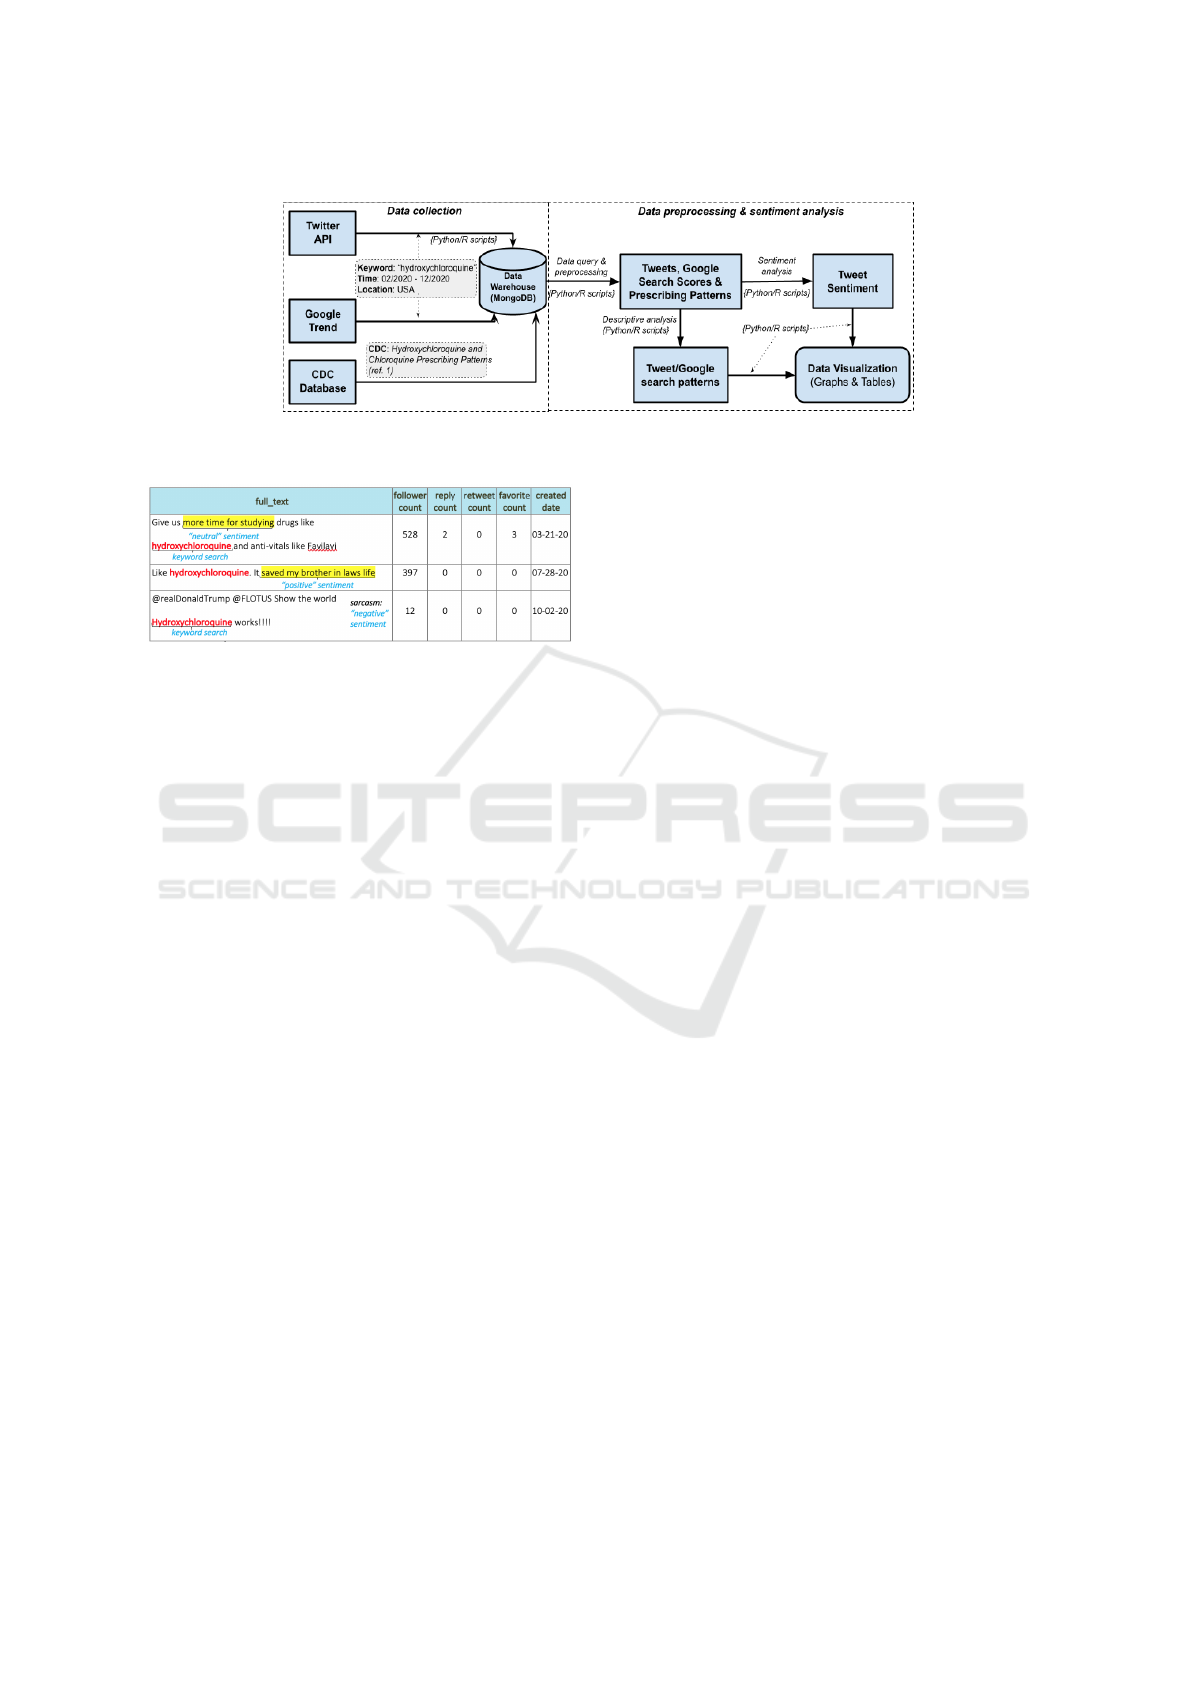
Figure 1: System architecture for data collection and analysis.
Figure 2: Samples of tweets.
(e.g, “the”, “a/an”, “of”, etc.). We adopted
the well-known Natural Language Toolkit
(NLTK) (NLTK, 2020) for text lemmatiza-
tion and stop-word removal.
· Emojis and Emoticons Conversion: Finally,
we observed that the collected data consisted
of several tweets with emojis and emoticons
(Pavalanathan and Eisenstein, 2015) embed-
ded in the text. Without pre-processing these
emojis and emoticons, the sentiment analysis
may not be accurate or might be interpreted
in opposite meaning. For example, tweet
“just used hydroxychloroquine, feeling :-)“.
Removing the smiley face “:)” emoticon,
the sentiment of the tweet should be “neu-
tral”. On the other hand, if we converted it
to “happy”, the actual meaning of the emoti-
con here, the sentiment of the tweet changed
to “positive”. We developed a Python script
that used a lookup table described in (Guibon
et al., 2015) to convert all emojis and emoti-
cons for all tweets.
– Descriptive Analysis, Sentiment Analysis
and Data Visualization: The pre-processed
data is fed into two algorithms for descriptive
analysis and sentiment analysis (more detail is
described in the next section). The outputs
of these two algorithms are gathered and dis-
played in the forms of graphs and tables de-
scribed in Section 4.
3 DATA ANALYSIS
METHODOLOGY
Our data analysis methodology consists of two parts.
• Descriptive Analysis: First, we perform data de-
scriptive analysis by visualizing the pre-processed
data to observe the trend and patterns of the tweets
and Google keyword search over time. We also
used the prescription orders collected from the
CDC to observe the purchase patterns of the drug.
• Sentiment Analysis: Second, we perform senti-
ment analysis of the tweets to reveal the opinion
of the users on H4C. We should emphasize that
extracting sentiment of noisy tweets is challeng-
ing due to the short texts and embedded emojis
and emoticons (Hussein, 2018). To quantify the
users’ opinion on support or against the use of
“hydroxychloroquine” for COVID-19 treatment,
tweets are classified into three categories: Posi-
tive (Pos) (a supporting opinion), Negative (Neg)
(an opposition), and Neutral (Neu) (neither sup-
port nor against, general statement of using the
drug). In this analysis, our goal is two folds:
(1) revealing the opinion of users on H4C, and
(2) comparing the sentiment classification perfor-
mance of existing well-known sentiment analy-
sis tools, i.e., VADER and Google Cloud Natural
Language API.
– Manual Sentiment Classifier (MSC): In MSC,
five undergrad students spent total 50 hours
to read and classify tweets in different cate-
gories (“Pos”, “Neg”, or “Neu”). Due to
the large size of the collected dataset (164,016
tweets), we proportionally randomly selected
4,850 tweets posted in five important dates as-
sociated with the highest numbers of tweets
sent on Twitter, including March 21, April 06,
May 19, July 28, and October 02 (see Fig. 3 and
Fig. 4 for detail). We adopted guidelines for
classification task from (Mutlu et al., 2020). To
HEALTHINF 2022 - 15th International Conference on Health Informatics
634
ensure the consistency of tweet classification
across all the students, we did pre-training on
interpreting the meaning of tweets, especially
tweets with sarcastic meaning. For example,
the tweet “Just give Trump hydroxychloroquine
and send him on his way. You know the mir-
acle cure” is identified as sarcasm because it
was created on the day Trump was tested pos-
itive with COVID-19, October 02. As a result,
this tweet should be interpreted as “Neg” as the
user implied that HCQ did not work on treating
COVID-19. In addition, the second round of
cross-checking and group discussion were per-
formed for tweets where the first student could
not determine their meanings. The manually
classified dataset is published on Github.
1
– Valence Aware Dictionary and sEntiment Rea-
soner (VADER): The second technique used to
classify tweets was the VADER Python library
(Hutto and Gilbert, 2014). VADER is a lexi-
con and rule-based sentiment analysis program
that was particularly attuned to analyzing social
media text. It implemented 7,500 lexical fea-
tures with validated valence scores on the scale
from -4 (extremely negative ) to 4 (extremely
positive), with the midpoint 0 as neutral. As
an example, the valence score for “great” is
3.1, “summer” is 0, and “horrible” is −2.5.
VADER calculates a sentiment metric consist-
ing of four elements: Positive, Negative, Neu-
tral, and Compound. The first three elements
represent the proportion of the text that falls
into those categories, ranging from 0 to 1, in-
clusively. The final compound score (ComS) is
the sum of all of the lexicon ratings and normal-
ized to a range between -1 (most negative) and
1 (most positive). Mathematically, the ComS is
computed by
ComS =
x
√
x
2
+ α
, (1)
where x =
∑
n
i=1
s(w
i
), s(w
i
) is the valence score
of i
th
word in the text, n is the total number
of words in the text; and α is the normaliza-
tion constant (default value is 15). We no-
tice that due to the noise of the media content,
we adopted the thresholds proposed in (Guibon
et al., 2015)(Pano and Kashef, 2020) where a
tweet is classified as “Pos”, “Neu”, “Neg” if
its ComS ≥ 0.05, 0.05> ComS > -0.05, ComS
≤-0.05, respectively.
– Google Cloud Natural Language API (GCNL):
Our third technique is the well-known ad-
1
https://github.com/thuydt02/HCQ Tweet Dataset
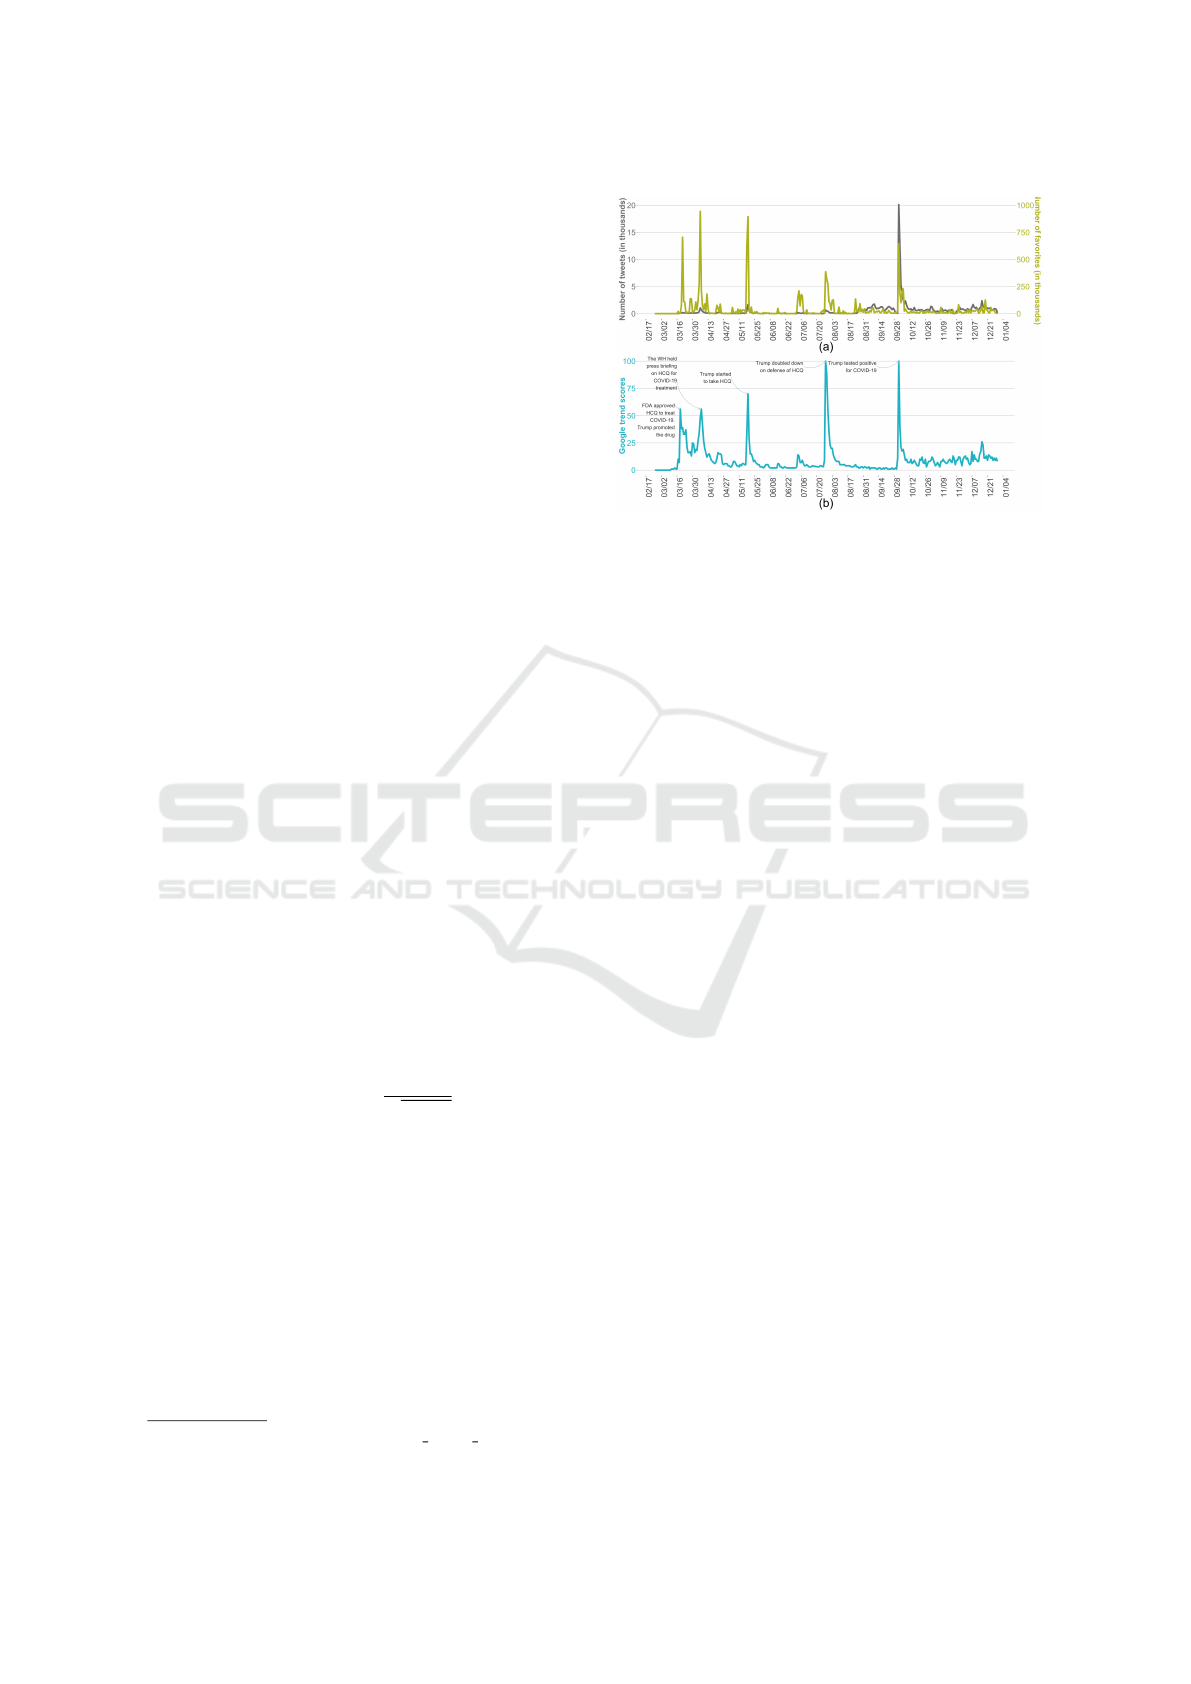
Figure 3: Abnormal online users’ reaction patterns in the
time domain. (a) Number of tweets, favorites on Twitter,
(b) Google keyword search score.
vanced machine learning Google Cloud Natu-
ral Language API (Google, 2020a) which has a
pre-trained model for sentiment analysis, called
“analyzeSentiment”. It identifies the prevailing
emotional opinion within the text, especially to
determine a writer’s attitude as positive, nega-
tive, or neutral. The sentiment metric by ana-
lyzeSentiment has two factors: score (GScore)
and magnitude (GMag). Similarly the ComS
of VADER, GScore is calculated to determine
the sentiment polarity of the text with its range
from -1.0 (most negative) to 1.0 (most positive).
On the other hand, the GMag is used to repre-
sent the overall strength of emotion of the text,
ranging from 0.0 to +inf. Unlike score, GMag
is not normalized; each expression of emotion
within the text contributes to the text’s magni-
tude. Thus, longer text blocks will likely have
greater magnitudes. We use the same thresh-
old defined in VADER to classify the classes of
the tweets. We expected that GCNL with an
advanced machine learning algorithm should
perform well in understanding the tweets to
identify the users’ opinions on using HCQ for
COVID-19 treatment.
4 RESULTS AND DISCUSSION
4.1 Descriptive Analysis
We first identify the trend of the reactions of online
users via tweets and Google keyword search frequen-
cies. We hope that the reaction patterns may shed
some light on how social media users react in re-
sponse to the information feeds regarding using HCQ
Understanding Public Opinion on using Hydroxychloroquine for COVID-19 Treatment via Social Media
635
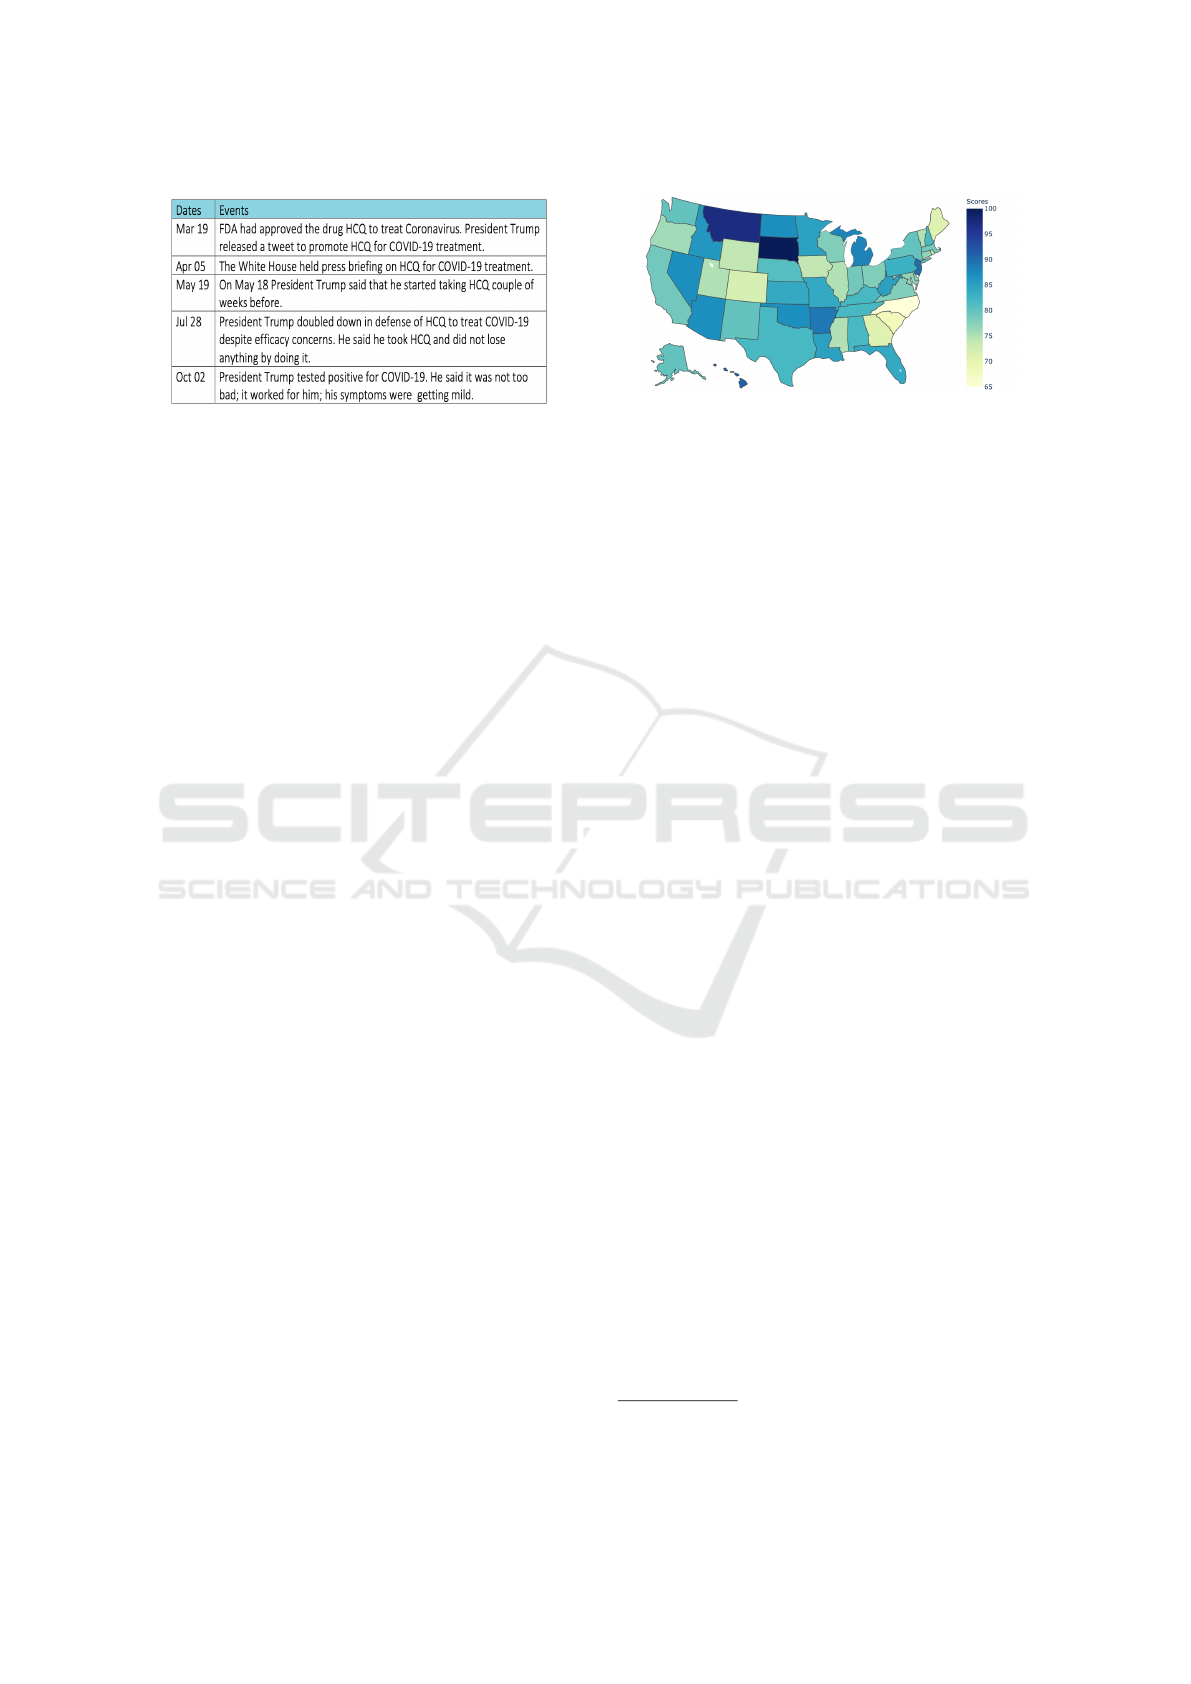
Figure 4: Social and news events related to using HCQ for
COVID-19 treatment.
for treating COVID-19.
4.1.1 Unexpected Patterns of Users’ Reactions
We first plot the reactions of users on Twitter and
Google search platform in the time domain in Fig.
3(a) and (b), respectively. Our data shows unex-
pected patterns on both of the platforms with reac-
tion spikes that occurred on only some specific dates
and instantly diminished right after these peaks. The
observed pattern is unexpected and it revealed inter-
esting patterns in how online users react to news and
social media feeds. Intuitively, we expected the reac-
tions to maintain at some levels for a longer duration.
We also would like to emphasize that the reaction pat-
terns perfectly align in the time domain between the
Twitter and Google platforms. That sheds light on
the hidden link between ”listening” on social media
(feeds on Twitter and news) and ”taking actions” on
searching for information (on Google).
4.1.2 Revealing Emerging Society Interests
From the observed data patterns from the tweet and
Google keyword search frequencies, we further ex-
plored to understand the ”spike” reaction patterns of
the online users. We identified five social and news
feeds listed in Fig. 4 that helped to explain the pat-
terns of the social media users’ reactions. Further-
more, the data showed that October 02 had the high-
est number of reactions with 20,124 tweets, about
12 times higher than other dates which had about
1,663 or fewer posts on average. This abnormality
reveals the current interest of the society - COVID-19
treatment and controversial statements by President
Trump who was announced being positive to COVID-
19 on that day.
4.1.3 Online Users’ Reaction in the Space
Domain
We are also interested in how the online users’ re-
actions to the information and news feed of using
Figure 5: Google Trend keyword search scores by states.
HCQ for treating COVID-19 in the space domain.
The Google Trend keyword search frequencies across
different states are illustrated in Fig. 5. As we ob-
served, the midwest and mountain states of the U.S
had the most keyword search frequencies. Particu-
larly, South Dakota and Montana were the two states
with the highest keyword search frequencies. The
data can be interpreted as there were higher degrees
of interest from the communities geographically lo-
cated in these areas regarding H4C. It also sheds light
on how the local public health policy was conducted
(e.g., South Dakota was one of the first states to test
HCQ on COVID-19 treatment) and the political view-
points of the communities in respect to their parties
regarding their opinions on using HCQ for COVID-
19 treatment. This is one of the first studies that reveal
this hidden link using social media data.
4.1.4 Linking Social Media Reactions to the
Drug Purchase Actions
Our Twitter and Goodle data showed hidden patterns
of how social media users reacted to HCQ. However,
it’s not clear if the public actually purchased the drugs
for COVID-19 treatment. To answer this question, we
collected data of the prescriptions of hydroxychloro-
quine/chloroquine from January to June in 2019 and
2020 from the Centers of Disease Control and Pre-
vention (CDC) (Bull-Otterson et al., 2020)
2
. We ob-
served a significant increase (i.e., about 10 times in
March 2020 and 6 times in April) in the number of
prescriptions for the drug in 2020 compared to that of
2019. This data shows clear evidence that the pub-
lic took action on purchasing the drug for treatment
consideration. Interestingly, we also observed some
decline in the number of routine and non-routine pre-
scriptions in the following months. This can be ex-
plained by the new evidence and studies showing
that the medication was not effective in COVID-19
treatment(Bull-Otterson et al., 2020).
2
Prescription data from June to Dec were not available
so it was absent from our plot.
HEALTHINF 2022 - 15th International Conference on Health Informatics
636
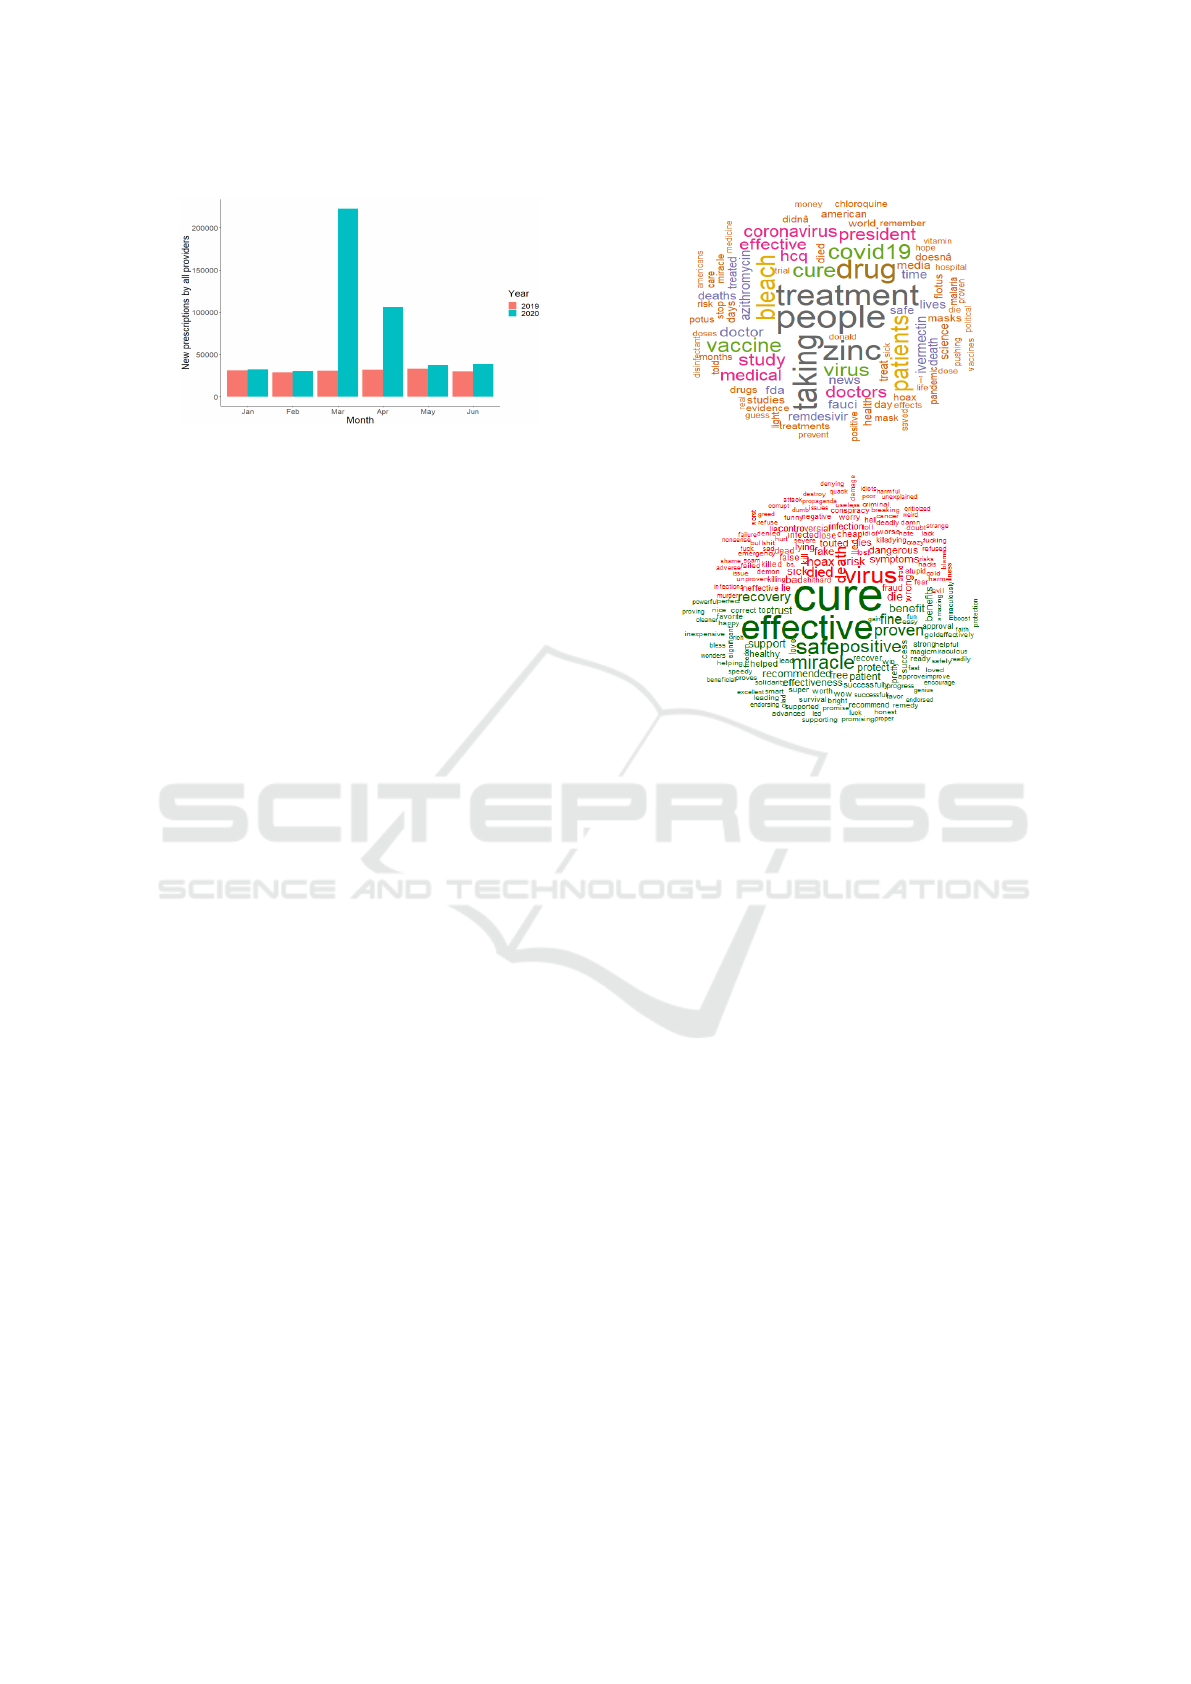
Figure 6: New prescriptions by all providers (routine, pri-
mary care and nonroutine.
4.2 Sentiment Analysis
The descriptive analysis in the previous subsection re-
vealed some big picture of how social media users
reacted to news feeds on using HCQ for COVID-19
treatment. However, the descriptive analysis did not
provide sufficient information to answer the follow-
ing questions: (1) What was the overall opinion
of social media users on using HCQ for COVID-19
treatment? (2) How did the degree of support/against
change over time? (3) Do the existing sentiment anal-
ysis tools work well on the noisy dataset? In this sub-
section we performed sentiment analysis of the tweets
to shed light on the hidden information in the tweets
to find the answers for these above questions.
4.2.1 Extracting Opinions via Word Frequencies
We first investigate the word frequencies of the tweets
to reveal the crowd opinion as a whole. The word-
cloud of the tweets is plotted in Fig. 7. As we ob-
served in Fig. 7(a), “treatment”, “taking”, “cure”
were standing out as the most frequently used words
in the tweets. This can be interpreted as, in general,
social media users supported the recommendation of
using HCQ for COVID-19 treatment. Additionally,
in Fig. 7(b), we plotted the wordcloud associated
with the sentiment of the words. Particularly, we used
the “bing” lexicon (Ding et al., 2008) to classify the
words into the positive and negative classes. As a re-
sult, the neutral words are excluded from the data. In-
terestingly, we observe that positive words (the lower
half in green color) dominated the negative words,
and “cure” is the most frequently used word in the
positive sentiment class.
4.2.2 Quantifying the Change of Opinions
Next, we investigate how the opinions of the social
media users shifted over time by quantifying the shift
of positive and negative sentiment tweets over time.
We focus on five important events that we identified
(a)
(b)
Figure 7: Wordcloud of the tweets. (a) Most frequently
used words, (b) Positive vs. negative words using ”Bing”
lexicon.
in the Descriptive Analysis that associated with the
most numbers of reactions from the users. To en-
sure the conclusion drawn from this step reliable, we
only considered the 4,850 tweets randomly selected
from these dates using a manual sentiment classifier
(MSC). Fig. 8 shows the ratio of positive sentiment
tweets to negative sentiment tweets over time. Gen-
erally speaking, we see the opinion of users shifted
from less support in March (the ratio is less than 1)
to more support in April and July (the ratio is greater
than 1). We also observed that the negative opinion
dominated in May and October. This might be due to
the tweets sent out on these dates more related to an
individual, Donald J. Trump, than the use of HCQ for
COVID-19 treatment. It’s an interesting data pattern
for further investigation in the future.
4.2.3 Sentiment Classification Comparison
Finally, we evaluate the performance of GCNL and
VADER algorithms which are efficient in process-
ing large datasets by comparing their sentiment clas-
sification accuracy with the MSC. Particularly, we
used 4,850 randomly selected tweets from the five
events with the most number of reactions for our
comparison. The sentiment classifications of GCNL
and VADER are illustrated in Fig. 9. Here the
Understanding Public Opinion on using Hydroxychloroquine for COVID-19 Treatment via Social Media
637
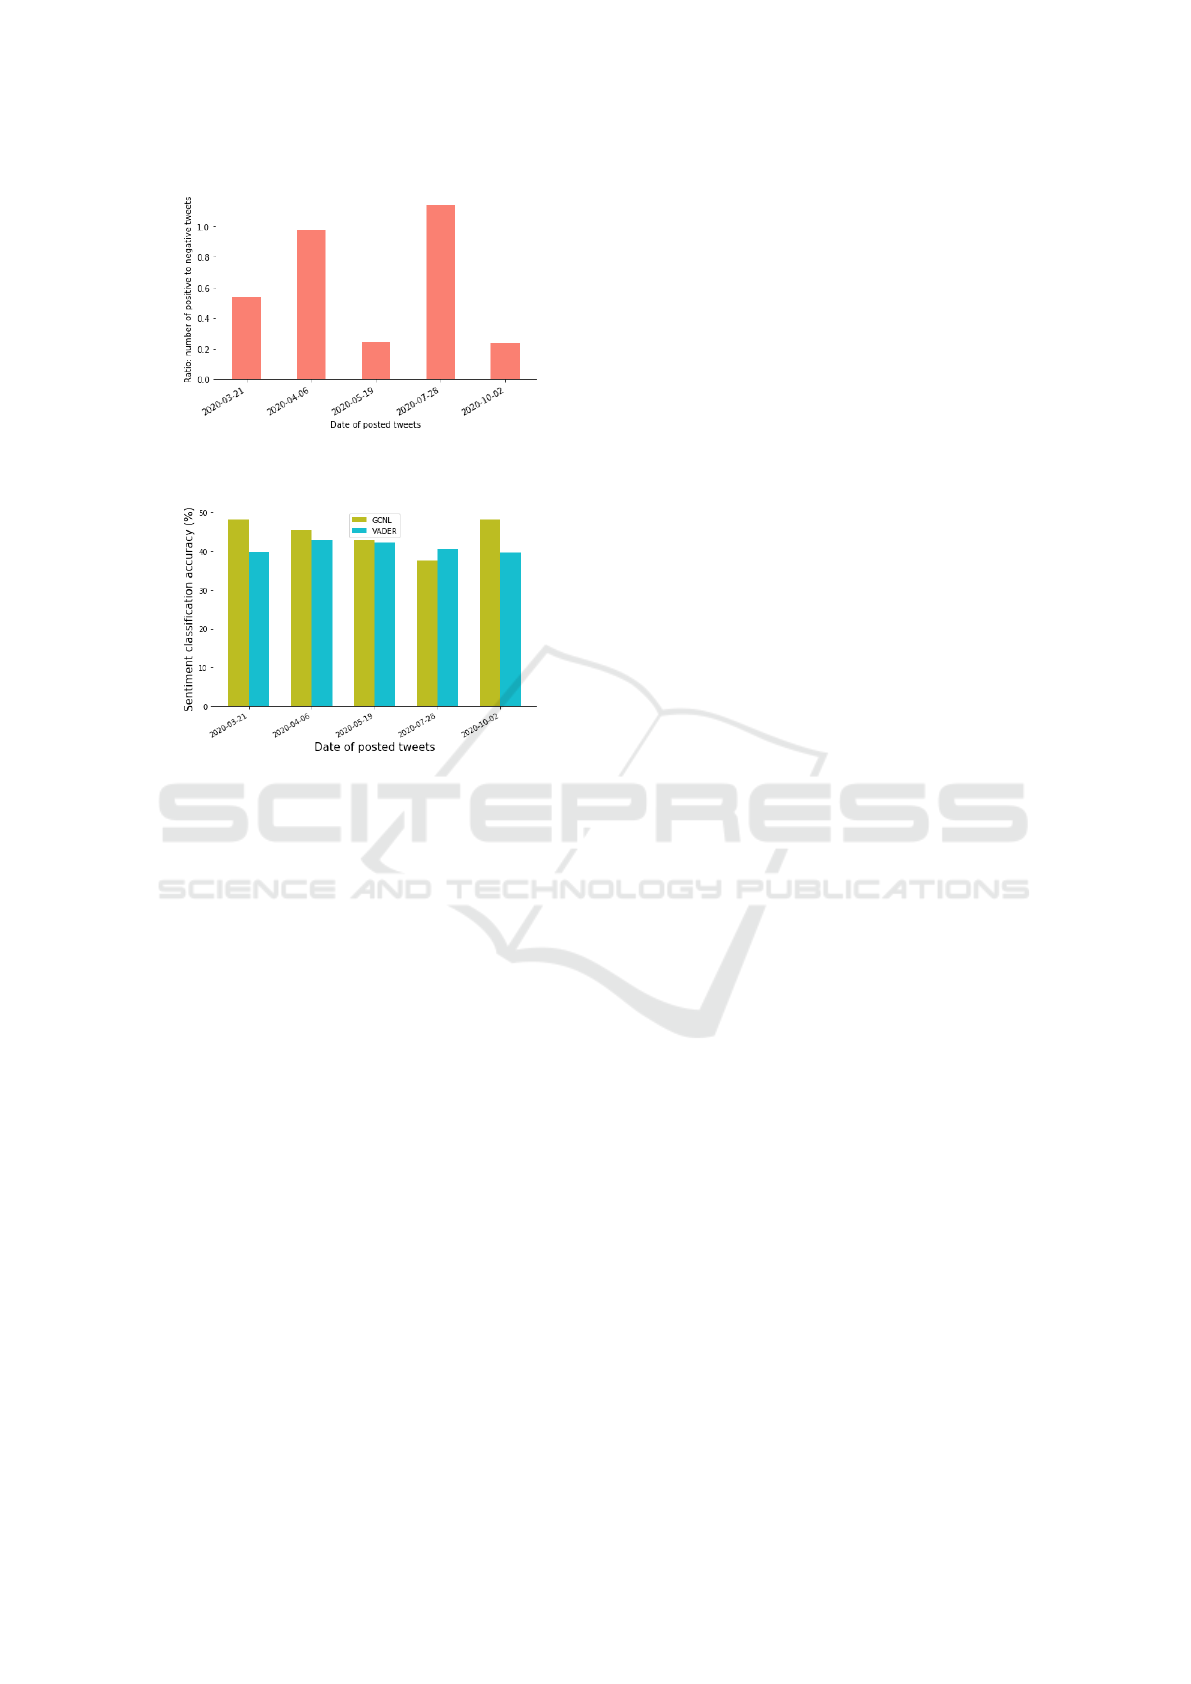
Figure 8: Shifting of social media users’ perception on us-
ing HCQ for COVID-19 treatment in the time domain.
Figure 9: Performance comparison of sentiment classifica-
tion of GCNL and VADER.
performance of MSC classified by humans is set as
the benchmark with 100% accuracy. As we can
see, GCNL and VADER do not perform well in this
dataset. That is because they may not recognize sar-
castic tweets. In addition, GCNL performs slightly
better with an average accuracy of 42.5% compared
to 38.7% of VADER. We also would like to empha-
size that the event of October 2nd had many sar-
castic tweets and GCNL significantly outperformed
VADER by 9% thanks to its advanced machine learn-
ing algorithm in natural language processing. To the
best of our limited knowledge, this is one of the first
sentiment analysis studies comparing existing tools
against human classification on a large tweet dataset.
5 CONCLUSION
Mining text on social media to understand the online
users’ opinions is challenging. In our study, we col-
lected 164, 016 tweets posted in 2020 with the “hy-
droxychloroquine” (HCQ) keyword on Twitter to ex-
tract the opinions of online social users on the recom-
mendation of using HCQ for COVID-19 treatment.
Our descriptive analysis identified an irregularity of
users’ reaction patterns that are tightly associated with
the related social media feeds and news on the devel-
opment of HCQ and COVID-19 treatment. The study
linked the tweet and Google keyword search frequen-
cies to reveal the viewpoints of communities on H4C
located in different geographical locations across dif-
ferent states. In addition, we analyzed the sentiment
of the tweets to understand the public opinion on the
recommendation of using HCQ and how it changed
over time. The data shows that high support in the
early dates but it declined over time.
Finally, our sentiment performance comparison
showed that GCNL outperformed VADER in classify-
ing tweets, especially in the sarcastic tweet group. We
will further utilize the social links and friend counts of
the users to characterize how misinformation spreads
out in the social media network in our future study.
REFERENCES
Bull-Otterson, L., Gray, E., Budnitz, D., Strosnider, H.,
Schieber, L., Courtney, J., Garcia, M., Brooks, J.,
Kenzie, W., and Gundlapalli, A. (2020). Hydroxy-
chloroquine and chloroquine prescribing patterns by
provider specialty following initial reports of potential
benefit for covid-19 treatment, united states, january -
june 2020. CDC, USA.
Ding, X., Liu, B., and Yu, P. (2008). A holistic lexicon-
based approach to opinion mining. International Con-
ference on Web Search and Data Mining.
Enchant (2021). https://pypi.org/project/pyenchant/.
Python package.
Google (2020a). https://cloud.google.com/natural-
language/docs/analyzing-sentiment. Google.
Google (2020b). https://trends.google.com/trends/?geo=us.
Guibon, G., Ochs, M., and Bellot, P. (2015). From emojis
to sentiment analysis. HAL.
Hamamsy, T. and Bonneau, R. (2020). Twitter activity
about treatments during the covid-19 pandemic: case
studies of remdesivir, hydroxychloroquine, and con-
valescent plasma. medRxiv.
Hussein, D. (2018). A survey on sentiment analysis chal-
lenges. Journal of King Saud University - Engineering
Sciences.
Hutto, C. and Gilbert, E. (2014). Vader: A parsimonious
rule-based model for sentiment analysis of social me-
dia text. International AAAI Conference on Web and
Social Media.
Mutlu, E., Oghaz, T., Jasser, J., Tutunculer, E., Rajabi, A.,
Tayebi, A., Ozmen, O., and Garibay, I. (2020). A
stance data set on polarized conversations on twitter
about the efficacy of hydroxychloroquine as a treat-
ment for covid-19. In abc. Data in brief.
Niburski, K. and Niburski, O. (2020). Impact of trump’s
promotion of unproven covid-19 treatments and sub-
sequent internet trends: Observational study. J Med
Internet Res.
HEALTHINF 2022 - 15th International Conference on Health Informatics
638

NLTK (2020). http://nltk.org. Python package.
Pano, T. and Kashef, R. (2020). A complete vader-based
sentiment analysis of bitcoin (btc) tweets during the
era of covid-19. MDPI.
Pavalanathan, U. and Eisenstein, J. (2015). Emoticons
vs. emojis on twitter: A causal inference approach.
ArXiv.
Salloum, S., Al-Emran, M., Monem, A., and Shaalan, K.
(2017). A survey of text mining in social media: Face-
book and twitter perspectives. ASTES Journal.
Twitter (2020). https://twitter.com/home.
Xue, J., Chen, J., Hu, R., Chen, C., Zheng, C., Liu, X.,
and Zhu, T. (2020). Twitter discussions and emo-
tions about covid-19 pandemic: a machine learning
approach. J Med Internet Res.
Understanding Public Opinion on using Hydroxychloroquine for COVID-19 Treatment via Social Media
639
