
A Process Cube based Approach of Process Mining in Analysing
Frailty Progression Exploiting Electronic Frailty Index
N. F. Farid
1,2,* a
, Marc de Kamps
2
and Owen A. Johnson
2b
1
School of Computing, Universiti Utara Malaysia (UUM), Kedah, Malaysia
2
School of Computing, University of Leeds, U.K.
Keywords: Process Mining, Process Cube, Frailty Progression, Electronic Frailty Index, Electronic Health Record.
Abstract: Process mining is a data analytics technique that is used in healthcare to develop insights into care processes,
care pathways and disease progression using event data extracted from Health Information Systems. The most
widely used application is process discovery where models of healthcare processes are automatically inferred
and visualized. These have been applied to frailty, a common geriatric condition in elderly people typically
described in terms of progression through a number of stages. In this paper we use the Electronic Frailty Index
which is calculated using 36 indicators of frailty deficits. We use process mining to analyse frailty progression
using data from the SystmOne GP system used in UK primary care. We propose an approach for analysing
frailty progression using a process cube analysis through slicing and dicing sets of attributes related to clinical
frailty events. Different combinations of process cube dimensions allow us to model and analyse a
comprehensible frailty progression. We illustrate the method through a case study investigating the
association between frailty stages and three common issues; falls, hypertension and polypharmacy.
1 INTRODUCTION
Frailty affects us all. In the UK frailty is recognised
as a geriatric condition affecting 26% of people over
85 (Clegg et al., 2013). With an aging global
population, the impact of frailty on elderly people,
their families and society has attracted the attention
of researchers. Frailty affects health outcomes,
quality of life as well as rising costs associated with
healthcare and the support required for daily living
(Han et al., 2019).
Frailty is often described in terms of an
accumulation of health characteristics, called deficits,
that reduce physical capability (Clegg and Young,
2011; Xue, 2011). As physiological functions of the
body decline the body is more susceptible to internal
and external events that can further worsen the
condition. As a result, frailty leads to an increase risk
of hospital admissions, institutionalisation,
dependency and other adverse health consequences
(Fried et al., 2004).
a
https://orcid.org/0000-0001-5213-0016
b
https://orcid.org/0000-0003-3998-541X
*
Corresponding author
Process mining is a data analytics technique that
is used in healthcare to develop insights into care
processes, care pathways and disease progression
using event data extracted from Health Information
Systems (HIS). The three types of process mining are
process discovery, which reveals how processes
occurs; conformance checking, identifying
differences between models of the process and the
data from actual events; and process enhancement,
which includes steps to improve the actual process
(van der Aalst, 2016). Process mining can be seen as
the overlap between the two disciplines of data
mining and process analysis (van der Aalst, 2011).
Example applications of process mining in healthcare
include patient safety, process improvement and
exploration of care pathways (Mans et al., 2013;
Kurniati et al., 2020; Kusuma et al., 2020). In earlier
work we investigated applications of process mining
to frailty and identified a limited literature base and
opportunities to help better understand frailty
progression through the use of routine healthcare data
(Farid et al., 2019). In this paper we develop a method
Farid, N., de Kamps, M. and Johnson, O.
A Process Cube based Approach of Process Mining in Analysing Frailty Progression Exploiting Electronic Frailty Index.
DOI: 10.5220/0010879200003123
In Proceedings of the 15th International Joint Conference on Biomedical Engineering Systems and Technologies (BIOSTEC 2022) - Volume 5: HEALTHINF, pages 605-613
ISBN: 978-989-758-552-4; ISSN: 2184-4305
Copyright
c
2022 by SCITEPRESS – Science and Technology Publications, Lda. All rights reserved
605
suitable for understanding frailty progression and
illustrate the method through a case study
investigating the association between frailty stages
and three common issues: falls, hypertension and
polypharmacy.
2 BACKGROUND
2.1 Process Mining
Patient level information about the delivery of
healthcare, treatments and outcomes encoded within
HIS can be used to identify common patterns that can
be used to generate insights to inform practitioners,
healthcare providers and health informatics research.
Process mining applies this process-based approach
by using a log of relevant events extracted from HIS.
Three types of process mining are common: i)
process discovery, to create process models from the
log of events, ii) conformance checking to ensure the
model produced is highly representative of the log
and iii) enhancement, steps taken to improve the
process (van der Aalst, 2016).
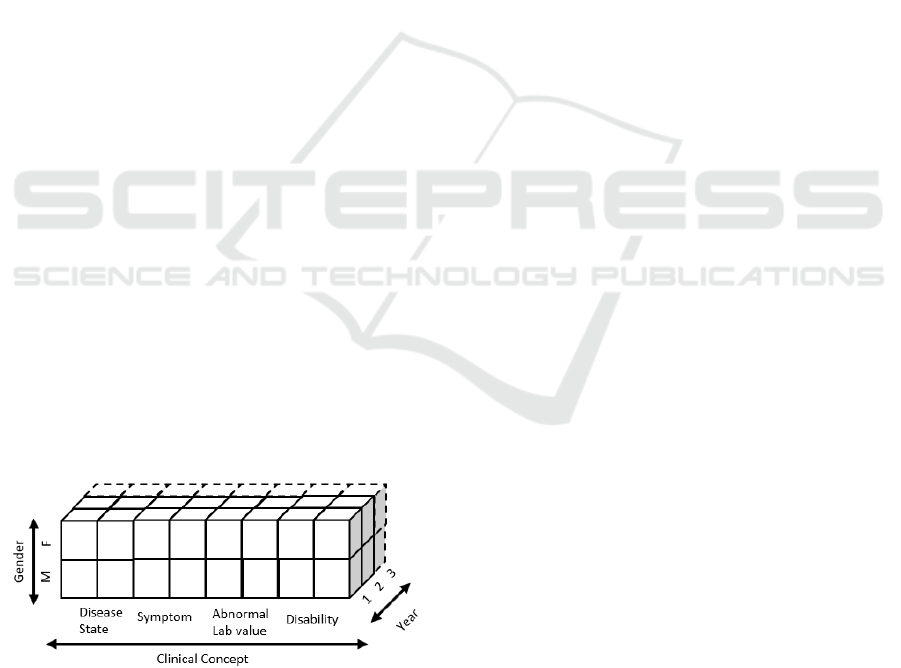
2.2 Process Cube
Process mining can be extended with the concept of
process cubes used to scope and organise event data
based on classic Online Analytical Processing
(OLAP) procedures including dice, slice, drill down
and roll up (van der Aalst, 2013). Process cubes are
used to characterise large datasets where each
dimension is linked to properties of patients and
events. In our analysis we used gender, time (in one-
year increments) and a range of clinical concepts.
Figure 1 shows the view of our process structure with
three dimensions.
Figure 1: Structure of the process cube for the dataset.
The four common process cube operations
following the standard OLAP procedures are slice,
dice, drill down and roll up. Slice operations select
parts of the values from a dimension while
eliminating the dimension from the sub-cube. The
second operation, dice is like a slice operation without
removing any dimensions from the process cube.
Drill down and roll up are operations that deal with
changing the level of a dimension’s granularity.
2.3 Frailty in Elderly People
Even though frailty is common in elderly people and
associated with natural aging, it is not an unavoidable
process. Frailty is recognised as a dynamic process
where the people transition from fit to moderate
frailty and to more advanced frail states over time
(Gill et al., 2006; Lang et al., 2009). Frailty is
generally seen as a trajectory with progression highly
likely to end in a frail state (Setiati et al., 2019).
However, frailty progression varies widely between
individuals, their health and their circumstance and
understanding this complex variation is imperative.
An improved understanding of frailty progression
may help clinicians identify those at high risk of
deterioration and to develop effective intervention
plans.
2.3.1 Electronic Frailty Index
A variety of frailty assessment tools have been
developed with supporting guidance and resources
including PRISMA-7, Tillburg Frailty Indicator,
SHARE-FI (Pialoux, Goyard and Lesourd, 2012) and
the Electronic Frailty Index (eFI) (Clegg et al., 2016).
The eFI has now been adopted across UK primary
care settings and is embedded within General
Practitioner (GP) primary care systems such as
SystmOne, it is in regular use by GPs to assess the
level of frailty and is calculated automatically using
data from the patient’s record (Lansbury et al., 2017).
2.4 Related Work
Disease progression, also known as disease
trajectory, has been modelled effectively as a network
graph where nodes represent the first report of a
disease and edges show the direction (trajectory) of
disease progression (Pescosolido, 2013; Jensen et al.,
2014). The practicality of applying process mining to
study disease progression has been demonstrated by
(De Toledo et al., 2019) and (Kusuma et al., 2020).
However, work on frailty progression based on the
clinical assessment and/or demographics records
have not utilised process mining techniques so far
(Chamberlain et al., 2016; Rogers et al., 2017;
Verghese et al., 2021). While these works analyse
HEALTHINF 2022 - 15th International Conference on Health Informatics
606

disease patterns, no performance indicators such as
intervals between disease progress were discussed.
3 METHODOLOGY
Process Mining Project Methodology (PM2) is the
general methodology used to conduct this work (Van
Eck et al., 2015). It comprises of six phases. The
focus of work is established by creating research
questions as a guideline in phase (I) planning. In
phase (II) data extraction is done by selecting
appropriate event data and defining a scope of work.
Next, data processing and transformation in phase
(III) is performed in refining the data to create event
logs in next phase (IV) of mining and analysis. The
evaluation phase (V) is done by diagnosing and
verifying the work findings. The last phase (VI)
process improvement and support was not relevant to
this work. Several iterations were done involving the
last three phases of the methodology. These included
the implementation of two process cube operations in
different iterations.
4 CASE STUDY
The dataset used as our case study is from General
Practices from the city of Bradford in West
Yorkshire, England. The primary care professionals
use SystmOne to record clinical findings during
consultation which includes history, symptoms,
diagnosis, observations, referrals, and treatments.
The case study following the PM2 methodology
explained in previous section, the activities executed
at each stage are described below.
4.1 Phase I: Planning
The planning phase involved developing the research
questions to explore frailty progression. They were
derived from a review of previous studies and
confirmed by clinical domain experts working in
frailty care in the local region. The domain experts
identified three commonly acknowledged clinical
problems with frailty progression which are
hypertension, falls and polypharmacy. Our aim was
to determine the association between frailty stages
with these areas of concern. The research questions
were:
RQ1) Can process mining detect and quantify the
differences in frailty progression?
RQ2) Is it possible to uncover the differences in
sequence of deficits of concern using
process mining?
RQ3) Can process mining determine variations
between patterns of concern?
4.2 Phase II: Extraction
Anonymised patient record data was extracted by the
connected Bradford research data service
www.bradfordresearch.nhs.uk/our-research-
teams/connected-bradford/ Data was extracted from
the SystmOne electronic health care record system for
participating GP practices and loaded into an SQL
server database management system for analysis. The
extract covered Electronic Health Records (EHR)
from elderly patients aged 65 years for a period of 1
January 2003 until 31 August 2018. Data for 86,919
elderly patients with over 2 million events records
were extracted.
Three inclusion criteria were employed to obtain
a patient cohort appropriate for the work. The first
criterion was to include patients who had at least one
year’s data within the dataset, the second was for
patients aged over 84 years with their final frailty
category in the middle or later stage of frailty, and the
third inclusion criterion was the maximum average of
frailty deficits accumulation is three in a year. The
last inclusion criterion follows Bartosch, McGuigan
and Akesson (2018) who found that most frail elderly
people experienced about 6%-7% of deficits
increment in a year. This phase identified two cohorts
of patient with three deficits of concern (n = 8,547)
and without (n = 3,848).
4.3 Phase III: Data Processing and
Transformation
The third phase of this work involved the preparation
of event logs suitable for loading into process mining
tools. The processing step included creating views
based on the structure of data and research aim to
investigate the association between frailty
progression and deficits of concern. Other data
processing and transformation steps includes frailty
index score identification at each visit to General
Practice, log enriching and securing the sequence of
the events that shared similar timestamp details. Each
of the transformation steps are explained as follows:
Calculation of Electronic Frailty Index (eFI)
score - Frailty scores were determined at every
visit that the patient made to the General
Practice based on those frailty deficits
identified at the time of the visit.
A Process Cube based Approach of Process Mining in Analysing Frailty Progression Exploiting Electronic Frailty Index
607
Log Enriching – Following Clegg et al. (2016)
frailty is classified into four stages known as fit
(0 – 4 deficits), mild (5 – 8 deficits), moderate
(9 – 12 deficits), and severe (13 or more
deficits). The log was enriched by creating
additional events for the transition between
each stage.
Securing the Events Sequence – Where the
transition to a new frailty stage has the same
timestamp as a frailty deficit the order is
assumed to be frailty stage first. In this work,
only the first occurrence of deficits associated
with frailty are considered.
We used the commercial process mining tool
Fluxicon Disco (https://fluxicon.com/disco) and the
popular open-source tool ProM
(https://www.promtools.org). The processed event
logs of the two cohorts were loaded into the process
mining tools to produce visual models of frailty
progression.
4.4 Phase IV: Mining and Analysis
The fourth phase involves process mining and
analytical techniques implemented on the patient
cohorts during the mining and analysis. Control-flow
and time are two process mining perspectives applied
in this work. In addition to process mining techniques
using process cube and variant analysis, an analytical
technique is performed to analyse the frailty
progression. Process mining and analytical
techniques will be discussed in detail below.
4.4.1 Process Cube based Analysis
A process cube based analysis is implemented to
produce a simplified and understandable process
models for frailty progression. The dice operation of
process cube techniques was applied where we only
consider the dimension of clinical concepts. The
traces to create event log are retrieved from the
attributes of events and frailty stages. Table 1 shows
the descriptive statistics generated from the process
cube of one dimension; a) sub-cohort with the deficits
of concern and b) sub-cohort without the deficits of
concern.Table 1 shows the measurement values for
conformance checking produced using the plugin in
ProM called Replay a Log on Petri Net for
Conformance Analysis and Measure Precision and
Generalization. Fitness measures how much the
model allows behaviour recorded in the event log,
precision measures the behaviour allowed in the
model but not being expressed in the event log, lastly
generalization measures the future behaviour
expressed by the process model (Buijs, van Dongen
and van der Aalst, 2012). Both models are highly
representative from the event logs, and high precision
indicate that models only represent behaviour of the
event log. Furthermore, generalization (0.53, out of 1)
in the model without deficits of concern is medium
which demonstrates medium possibility for it to
accept behaviour that does not present in the log.
Table 1: The descriptive statistics of two sub-cohorts
following one dimension of process cube.
Cohort a Cohort b
# patients 8,547 3,848
# events 30,754 5,385
Events per
patient
3.6 (~4) 1.4 (~1)
Trace Fitness 0.96 1.00
Precision 1.00 1.00
Generalisation 0.77 0.53
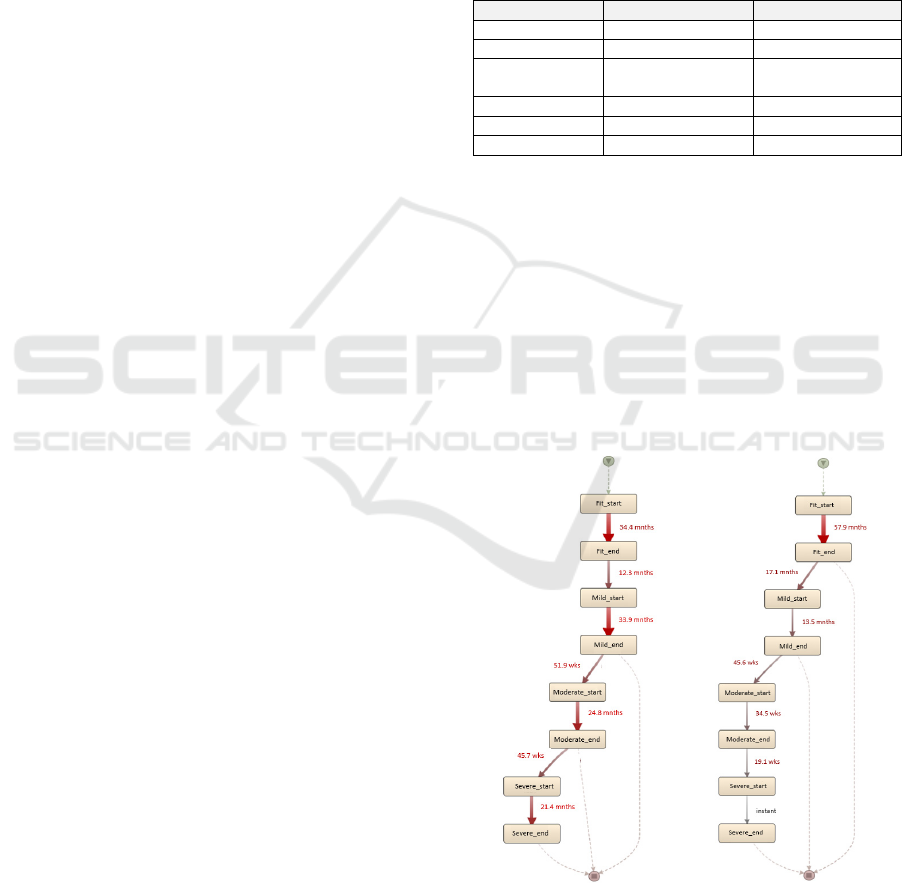
The process discovery of sub-cohorts is illustrated
in Figure 2 using the performance view of Disco. The
thickness of the edges indicates the longer mean
duration within frailty stages or transition points. The
transition point is defined as the interval between end
of current frailty stage to the start of the next frailty
stage. The transition point from fit stage to mild stage
is recognised as point 1, from mild to moderate stage
is point 2 and point 3 is from moderate to severe stage.
It is observed that mean duration is shorter in Figure
2(b) within both frailty stage and transition point,
except for the fit frailty stage.
a) With deficits of concern
b) Without deficits of concern
Figure 2: Process models generated from Disco with mean
duration executed in between activities.
HEALTHINF 2022 - 15th International Conference on Health Informatics
608
The evaluation of duration distributions of frailty
stages and transition points were computed using the
independent t-test. The general hypothesis is that time
taken to reach the subsequent stages is influenced by
the presence of deficits of concern
Table 2: The descriptive statistics in segments of stages
with highlighted cells showing statistical significance
between sub-cohorts.
Frailty
Stages
Cohort a Cohort b
p-
value
Median Duration (IQR) in months
Fit
26.6 (13.3 - 47.1)
N = 8,547
46.6 (25.0 - 81.9)
N = 3,848
0.00
Mild
27.8 (14.3 - 47.8)
N = 8,514
1.0 (0 - 18.6)
N = 1,432
0.00
Moderate
19.2 (5.8 - 36.3)
N = 7,023
0.0 (0.0 – 9.9)
N = 101
0.00
Severe
11.1 (0.0 – 33.7)
N = 3,335
0.0 (0.0 – 0.0)
N = 2
0.25
Transition
Point
Median Duration (IQR) in months
p-
value
1
7.0 (2.1 – 16.6)
N = 8,514
9.0 (2.6 – 23.6)
N = 1,432
0.00
2
6.7 (2.0 – 16.5)
N = 7,023
5.5 (1.7 – 14.6)
N = 101
0.32
3
6.0 (1.9 – 14.6)
N = 3,335
4.4 (3.6 – 5.2)
N = 2
0.49
Table 2 demonstrates numerical measurements of
two sub-cohorts comprises of median duration
between segments of stages with the Interquartile
Range (IQR) at 25% and 75%. The statistical
significance component is highlighted in Table 2
using a chosen p-value of less than 0.05. It defined by
the time taken to reach the subsequent stages from
current stage. In segment I (Fit) the duration is
between the start of the fit to the end of the fit stage,
segment II (Mild) between the start of the mild to the
end of the mild stage, segment III (Moderate)
between the start of the moderate to the end of the
moderate and the last segment IV (Severe) is between
the start to the end of severe stage.
The comparison between sub-cohorts in general
showed statistically significant differences in frailty
stages of fit, mild, and moderate. Whereas transition
point 1 is the only statistically significant difference
found between sub-cohorts. It is observed that the
duration is longer in sub-cohort b at mild and
moderate stage, while sub-cohort a experienced a
longer duration in the fit stage.
4.4.2 Variant Analysis
The association between the deficits of concern is
further investigated using different process cube
operations. A slice operation is implemented to pick
specific value as the attributes from selected
dimension of cube. The disease state of clinical
concept is chosen where the value of attributes are the
deficits of concern.
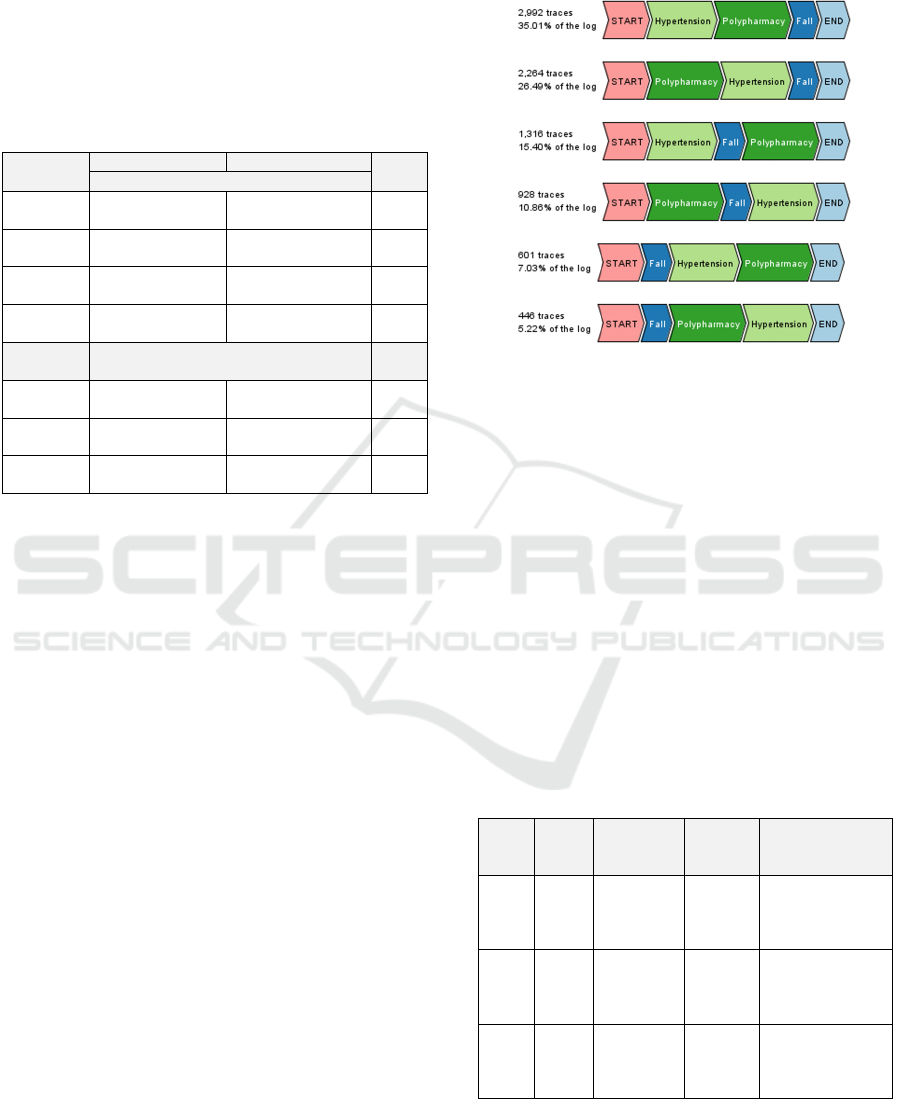
Figure 3: Trace variants with the deficits of concern
generated from the ProM.
Figure 3 shows the trace variant from the sub-
cohort with deficits of concern. The goal of trace
variant analysis is to generate the pattern of sequence
between deficits fall, hypertension and
polypharmacy. It reveals that the trace variants follow
three distinct patterns based on when an elderly
person has their first fall event. The dominant pattern
is that a fall happens after both hypertension and
polypharmacy occurred (61%), while the second most
common pattern is that a fall is recorded in between
hypertension and polypharmacy (23%) and third
pattern is that a fall precedes hypertension and
polypharmacy (16%).
Table 3: The descriptive statistics of pattern of sequence.
The duration of y value indicates year and m indicates
month. *PoS is for Pattern of Sequence.
PoS*
#
Cases
Case
Portion
Mean
Case
duration
Median Case
Duration [IQR]
I 5,256
F: 60
Mi: 815
Mo: 2,190
Se: 2,236
10y, 6m
11y,1m
[8y,1m – 13y,6m]
II 2,244
F: 9
Mi: 464
Mo: 1,004
Se: 767
9y, 10m
10y,2m
[7y,2m – 12y,9m]
III 1,047
F: 9
Mi: 212
Mo: 494
Se: 332
9y, 6m
10y,0m
[6y,6m – 12y,5m]
The statistical significance difference test is
assessed on case duration of all three patterns of
sequence using Analysis of Variance (ANOVA).
A Process Cube based Approach of Process Mining in Analysing Frailty Progression Exploiting Electronic Frailty Index
609
Next, post-hoc test, Tukey significant difference is
conducted to find which pattern is different. The
hypothesis to test if there is difference among patterns
of sequence with case duration.
Table 3 shows three patterns of sequence derived
from trace variant 1 and 2 (from Figure 3) for pattern
of sequence I, trace variant 3 and 4 for pattern of
sequence II and last two variants from Figure 3 for
pattern of sequence III. The case portion column
presents the acronym for a patient in the fit category
as ‘F’, in the mild category as ‘Mi’, in the moderate
category as ‘Mo’ and in the severe category as ‘Se’.
The general observation between the three process
models is that the combination of an individual deficit
of hypertension and/or polypharmacy usually
happened before reaching the Mild frailty stage.
Though, it occurred only in pattern of sequence I and
II (from Figure 3 and 4), it is affecting about 84% of
cases from sub-cohort a.
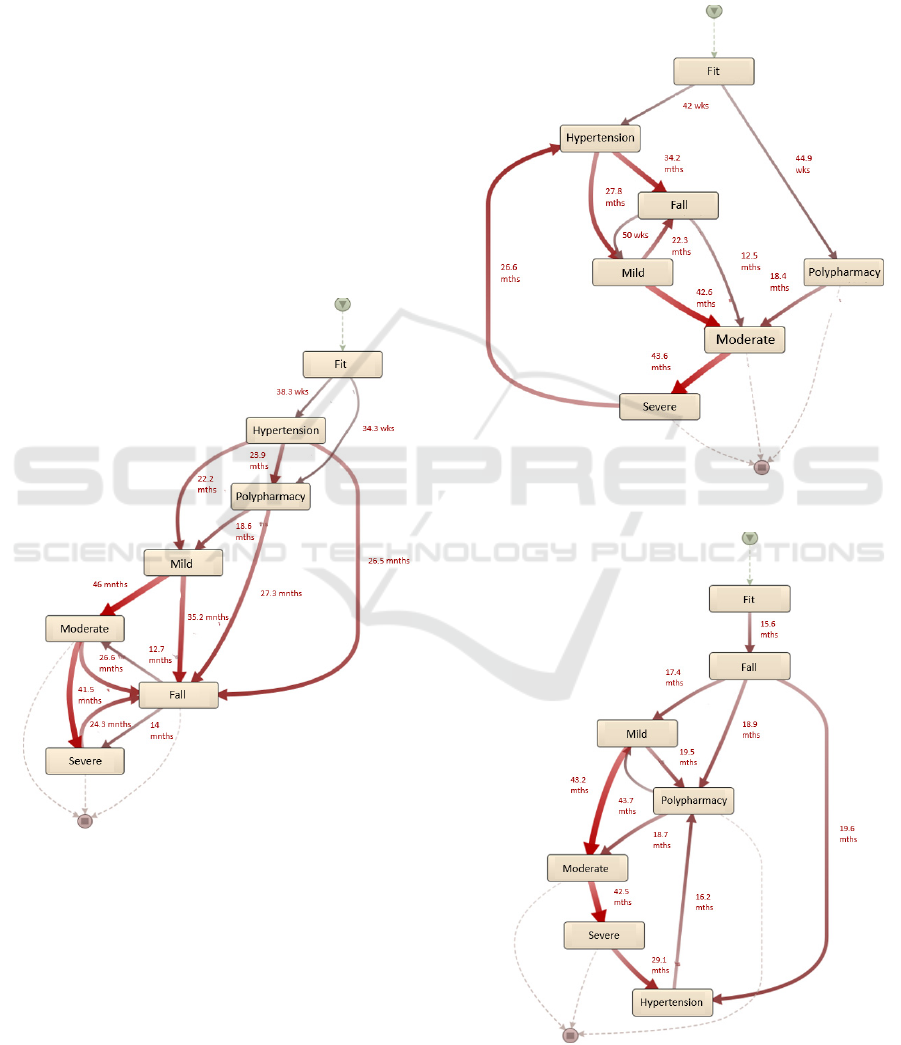
Figure 4: Process model from Pattern of Sequence I.
On the other hand, the difference that we can
observe based on 50% frequent path illustrated from
three patterns in Figure 4-6 is that a fall occurred
before reaching the initial frailty stage for pattern of
sequence II (Figure 5) and III (Figure 6). While a fall
in pattern sequence I (Figure 4) commonly happened
after reaching mild stage. Furthermore, it appears that
the average duration of reaching the final frailty
stages is shortest in pattern of sequence I (Figure 4).
It took about 14 months to enter the final frailty stage,
severe. The transition to severe stage is observed after
a fall had occurred. Meanwhile, in pattern of
sequence II (Figure 5) the average duration (43.6
months) to reach the severe stage is longer than
pattern of sequence III in Figure 6 (42.5 months).
Figure 5: Process model from Pattern of Sequence II.
Figure 6: Process model from Pattern of Sequence III.
HEALTHINF 2022 - 15th International Conference on Health Informatics
610

Although the pattern of sequence I has the longest
mean and median case duration, the elderly patients
with this pattern of sequence experienced quicker
change to the severe frailty stage.
4.5 Phase V: Evaluation
The last phase is evaluation with the goal to evaluate
the feasibility of the approach taken in the work. The
results from the implementation of a process cube and
descriptive statistical analysis produced insight on the
variation of frailty progression towards deficits of
concern. The RQ1 acts as a baseline in driving the rest
of the work to achieve the aim of incorporating the
process cube and variant analysis. Furthermore,
discussions with domain experts at the early stage of
work helped us focus on the critical matters
underlying frailty progression in elderly.
Based on the observation from process models
(Figure 3-5), pattern of sequence I recorded the
longest case duration but with the shortest interval to
reach the severe frailty stage. It suggests that patients
with the pattern of sequence I are becoming severe
more quickly especially when a fall occurred after
reaching the moderate frailty stage. Apart from that,
longest mean case duration recorded for patient with
pattern of sequence I as a high proportion of patients
(43%) have their final frailty stage as severe, in Table
3 compared to pattern of sequence II (34%) and III
(32%). This reflects findings that patients with severe
frailty are at greater risk of hospital admission and
longer duration of hospital stays (Clegg et al., 2016).
These factors contribute to the increased mean case
duration within the study period.
5 DISCUSSION AND
LIMITATIONS
This work explored the association of deficits of
concern with frailty progression. Falls, hypertension,
and polypharmacy are deficits of concern and three
widely known issues prevalent in the elderly. The
implementation of process cube for exploiting the
slicing operation found variations in frailty
progression between cohorts of patient with and
without deficits of concern which answered RQ1. The
approach enabled analysis of progression at each
frailty stage, and this was illustrated using process
models. The slicing operation supports filtering based
on specific values within a dimension to discover
sequences for the deficits of concern. Trace variant
analysis identified patterns that addressed RQ2. The
relationship between falls, hypertension and
polypharmacy was explored. RQ3 is answered by
comparative analysis from the process models.
Statistical analysis supports the findings.
This is the first study which includes process
mining techniques to determine the association of
frailty progression with deficits of concern.
Polypharmacy often appears in the initial stage of
frailty suggesting that it could possibly correlate with
early frailty progression from fit to mild. While we
can identify correlations, we should be cautious of
making causal assumptions, it may be worsening
frailty that leads to polypharmacy. On the other hand,
there is anecdotal evidence from clinical domain
experts that polypharmacy may be a risk factor for
falls. One limitation with the eFI method is that, once
a deficit has occurred once, it is permanently
identified as a deficit so reducing polypharmacy
would not reduce the eFI score. The eFI score is a
useful tool to indicate frailty but it is not a definitive
assessment of a patient’s true condition.
6 CONCLUSIONS AND FUTURE
WORK
We have established an approach for exploring the
association between frailty progression and three
deficits of concern: falls, hypertension and
polypharmacy using process mining techniques and
routine patient records data from primary care. The
approach comprises of analysis based on process
cubes and trace variant analysis to explore the
sequence of deficits of concern and identify emerging
patterns of frailty progression. This study contributes
insights for the process mining community and
practitioners within frailty domain.
While a process and data driven approach has
been our focus in this work, future work is needed to
explore the interaction of frailty progression with the
presence of polypharmacy at multiple points along
study duration. To achieve this, a more extensive
process mining and statistical investigation is
required.
ACKNOWLEDGEMENTS
This work is part of first author’s PhD study funded
by Higher Education Ministry of Malaysia. Research
data was provided by the Connected Bradford
research data service which has ethical approval for
anonymised data extracts for analysts and
A Process Cube based Approach of Process Mining in Analysing Frailty Progression Exploiting Electronic Frailty Index
611

researchers. IRAS ID: 227117 REC reference:
17/EM/0254.
REFERENCES
van der Aalst, W. M. P. (2011) Process mining—discovery,
conformance and enhancement of business processes.
[Book]. Springer, Berlin. doi: https://doi.org/10.1007/
978-3-642-19345-3.
van der Aalst, W. M. P. (2013) ‘Process cubes: slicing,
dicing, rolling up and drilling down event data for
process mining’, in Asia-Pacific Conference on
Business Process Management. Lecture Notes in
Business Information Processing, pp. 1–22. doi:
10.1007/978-3-319-02922-1_1.
van der Aalst, W. (2016) Process mining - data science in
actions. [Book]. Berlin, Heidelberg: Springer Berlin
Heidelberg. doi: 10.1007/978-3-662-49851-4.
Bartosch, P., McGuigan, F. E. and Akesson, K. E. (2018)
‘Progression of frailty and prevalence of osteoporosis
in a community cohort of older women—a 10-year
longitudinal study’, Osteoporosis International
Journal. 29(10), pp. 2191–2199. doi: 10.1007/s00198-
018-4593-7.
Buijs, J. C. A. M., van Dongen, B. F. and van der Aalst, W.
M. P. (2012) ‘On the role of fitness, precision,
generalization and simplicity in process discovery’, in
International Journal of Cooperative Information
Systems, pp. 305–322. doi: 10.1007/978-3-642-33606-
5_19.
Chamberlain, A. M. et al. (2016) ‘Frailty trajectories in an
elderly population-based cohort’, Journal of the
American Geriatrics Society, 64(2), pp. 285–292. doi:
10.1111/jgs.13944.
Clegg, A. et al. (2013) ‘Frailty in elderly people’, The
Lancet, 381(9868), pp. 752–762. doi: 10.1016/S0140-
6736(12)62167-9.
Clegg, A. et al. (2016) ‘Development and validation of an
electronic frailty index using routine primary care
electronic health record data’, Journal of Age and
Ageing, 45(3), pp. 353–360. doi: 10.1093/ageing/
afw039.
Clegg, A. and Young, J. (2011) ‘The frailty syndrome’,
Clinical Medicine Journal, 11(1), pp. 72–75. doi:
10.7861/clinmedicine.11-1-72.
Van Eck, M. L. et al. (2015) ‘PM2: A process mining
project methodology’, International Conference on
Advanced Information Systems Engineering, 9097, pp.
297–313. doi: 10.1007/978-3-319-19069-3_19.
Farid, N. F., de Kamps, M. and Johnson, O. A. (2019)
‘Process mining in frail elderly care: A literature
review’, HEALTHINF 2019 - 12th International
Conference on Health Informatics, Proceedings,
BIOSTEC 2019, pp. 332–339.
Fried, L. P. et al. (2004) ‘Untangling the concepts of
disability, frailty, and comorbidity: implications for
improved targeting and care’, The Journals of
Gerontology Series A: Biological Sciences and Medical
Sciences, 59(3), pp. M255–M263. doi: 10.1093/
gerona/59.3.M255.
Gill, T. M. et al. (2006) ‘Transitions between frailty states
among community-living older persons’,
Archives of
Internal Medicine Journal, 166(4), pp. 418–423. doi:
10.1001/archinte.166.4.418.
Han, L. et al. (2019) ‘The impact of frailty on healthcare
resource use: a longitudinal analysis using the Clinical
Practice Research Datalink in England’, Age and
Ageing, 48(5), pp. 665–671. doi: 10.1093/ageing/af
z088.
Jensen, A. B. et al. (2014) ‘Temporal disease trajectories
condensed from population-wide registry data covering
6.2 million patients’, Nature Communications, 5(May),
pp. 1–10. doi: 10.1038/ncomms5022.
Kurniati, A. P. et al. (2020) ‘Using a multi-level process
comparison for process change analysis in cancer
pathways’, International Journal of Environmental
Research and Public Health, 17(19), p. 16. doi:
10.3390/ijerph17197210.
Kusuma, G. P. et al. (2020) ‘Process mining of disease
trajectories: A feasibility study’, in HEALTHINF 2020
- 13th International Conference on Health Informatics,
Proceedings; BIOSTEC 2020, pp. 705–712. doi:
10.5220/0009166607050712.
Lang, P. O., Michel, J. P. and Zekry, D. (2009) ‘Frailty
syndrome: A transitional state in a dynamic process’,
Journal of Gerontology, 55(5), pp. 539–549. doi:
10.1159/000211949.
Lansbury, L. N. et al. (2017) ‘Use of the electronic Frailty
Index to identify vulnerable patients: A pilot study in
primary care’, British Journal of General Practice,
67(664), pp. e751–e756. doi: 10.3399/bjgp17X693089.
Mans, R. S. et al. (2013) ‘Process mining in healthcare: data
challenges when answering frequently posed
questions’, in Process Support and Knowledge
Representation in Health Care. ProHealth 2012,
KR4HC 2012. Lecture Notes in Computer Science.
Springer, pp. 140–153. doi: 10.1007/978-3-642-36438-
9_10.
Pescosolido, B. A. (2013) ‘Patient Trajectories’, in [Book]
The Wiley Blackwell Encyclopedia of Health, Illness,
Behavior, and Society. Chichester, UK: John Wiley &
Sons, Ltd, pp. 1770–1777. Available at:
https://onlinelibrary.wiley.com/doi/10.1002/97811184
10868.wbehibs282.
Pialoux, T., Goyard, J. and Lesourd, B. (2012) ‘Screening
tools for frailty in primary health care: A systematic
review’, Journal of Geriatrics & Gerontology, 12(2),
pp. 189–197. doi: 10.1111/j.1447-0594.2011.00797.x.
Rogers, N. T. et al. (2017) ‘Physical activity and
trajectories of frailty among older adults: Evidence
from the English Longitudinal Study of Ageing’, PLoS
ONE Journal,12(2),pp.1–12.doi: 10.1371/journal.po
ne.0170878.
Setiati, S. et al. (2019) ‘Frailty state among Indonesian
elderly: Prevalence, associated factors, and frailty state
transition’, BMC Geriatrics. 19(1), pp. 1–10. doi:
10.1186/s12877-019-1198-8.
HEALTHINF 2022 - 15th International Conference on Health Informatics
612

De Toledo, P. et al. (2019) ‘Mining disease courses across
organizations: A methodology based on process mining
of diagnosis events datasets’, Proceedings of the IEEE
Engineering in Medicine and Biology Society, EMBS.
IEEE, pp. 354–357. doi: 10.1109/EMBC.2019.8857
149.
Verghese, J. et al. (2021) ‘Trajectories of frailty in aging:
Prospective cohort study’, PLOS ONE Journal. Edited
by A. Bayer, 16(7), p. e0253976. doi: 10.1371/
journal.pone.0253976.
Xue, Q.-L. (2011) ‘The frailty syndrome: definition and
natural history’, Clinics in Geriatric Medicine, 27(1),
pp. 1–14. doi: 10.1016/j.cger.2010.08.009.
A Process Cube based Approach of Process Mining in Analysing Frailty Progression Exploiting Electronic Frailty Index
613
