
Blind Projection-based 3D Point Cloud Quality Assessment Method
using a Convolutional Neural Network
Salima Bourbia
1 a
, Ayoub Karine
2 b
, Aladine Chetouani
3 c
and Mohammed El Hassouni
1,4 d
1
LRIT, Mohammed V University in Rabat, Rabat, Morocco
2
L@bISEN, ISEN Yncr
´
ea Ouest, 33 Quater Chemin du Champ de Manœuvre, 44470 Carquefou, France
3
Laboratoire PRISME, Universit
´
e d’Orl
´
eans, France
4
FLSH, Mohammed V University in Rabat, Rabat, Morocco
Keywords:
Point Cloud, Quality Assessment, Multiple View Projection, Convolutional Neural Network (CNN).
Abstract:
In recent years, 3D point clouds have experienced rapid growth in various fields of computer vision, increasing
the demand for efficient approaches to automatically assess the quality of 3D point clouds. In this paper, we
propose a blind point cloud quality assessment method based on deep learning, that takes an input point cloud
object and predicts its quality score. The proposed approach starts with projecting each 3D point cloud into
rendering views (2D images). It then feeds these views to a deep convolutional neural network (CNN) to
obtain the perceptual quality scores. In order to predict accurately the quality score, we use transfer learning
to exploit the high potential of VGG-16, which is a classification model trained on ImageNet database. We
evaluate the performance of our model on two benchmark databases: ICIP2020 and SJTU. Based on the
results analysis, our model shows a strong correlation between the predicted and the subjective quality scores,
showing promising results, and outperforming the state-of-the-art point cloud quality assessment models.
1 INTRODUCTION
With the rapid improvement of 3D acquisition and
rendering devices, 3D point clouds (PCs) have re-
ceived more and more attention and are used in vari-
ous 3D applications such as autonomous driving, 3D
games, cultural heritage, robotics, etc. A point cloud
is a collection of a large amount of points that allow
representing 3D scenes and objects. Each point is
characterized by geometric coordinates (x, y, z) and
associated attributes such as color, normal vectors,
curvature, reflectance, etc. During the processing
chain (acquisition, compression, transmission, ren-
dering), the PC can be affected by several distortions
that deteriorate their visual quality. Therefore, the
development of methods that measure these distor-
tions is of paramount importance. This research field
is called Point Clouds Quality Assessment (PCQA).
This task can be achieved using subjective quality as-
a
https://orcid.org/0000-0001-5664-7514
b
https://orcid.org/0000-0002-9304-4613
c
https://orcid.org/0000-0002-2066-4707
d
https://orcid.org/0000-0002-6741-4799
sessment methods, which are considered the most ro-
bust and accurate way to assess the perceptual quality.
However, these metrics are based on human opinions,
making them time-consuming, expensive and imprac-
tical in real-world applications. Therefore, another
type of metrics has emerged, so-called objective qual-
ity assessment methods based on computational mod-
els that automatically predict the perceptual quality
score. Consequently, the most PCQA methods are ob-
jective and are classified into three categories: Full-
Reference (FR), Reduced-Reference (RR) and No-
Reference (NR). The FR-PCQA metrics require the
presence of reference point clouds. In the RR-PCQA,
only a portion of the original point cloud information
(features) is available. Finally, the NR-PCQA met-
rics do not require the reference information to mea-
sure the visual quality, which make them suitable for
several multimedia applications. Generally, the NR
methods for multimedia content are done through ma-
chine/deep learning methods (Bourbia et al., 2021;
Chetouani, 2018; Chetouani, 2014). For instance,
the convolutional neural networks (CNN) have dom-
inated the no-reference image quality assessment.
However, contrary to the 2D images (regular grid),
518
Bourbia, S., Karine, A., Chetouani, A. and El Hassouni, M.
Blind Projection-based 3D Point Cloud Quality Assessment Method using a Convolutional Neural Network.
DOI: 10.5220/0010872700003124
In Proceedings of the 17th International Joint Conference on Computer Vision, Imaging and Computer Graphics Theory and Applications (VISIGRAPP 2022) - Volume 4: VISAPP, pages
518-525
ISBN: 978-989-758-555-5; ISSN: 2184-4321
Copyright
c
2022 by SCITEPRESS – Science and Technology Publications, Lda. All rights reserved

the PC are unordered and without spatial structure.
Thus, the CNN cannot be used directly on PC. To
omit this limit, we project the PC into multiple 2D
images (views). Then, we feed this latter to a CNN
model in order to achieve the quality score of the PC
by averaging the quality assessment of each view.
The structure of this paper is organized as follows.
Section 2 reviews related work on Point Cloud Qual-
ity Assessment (PCQA). In Section 3, we describe the
proposed NR-PCQA. Then, Section 4 is dedicated to
the experiments. Finally, we draw conclusion and per-
spectives in Section 5.
2 RELATED WORK
To address the problem of Point Cloud Quality As-
sessment (PCQA), many approaches have been pro-
posed in the literature, which can broadly classified
in two categories: point-based and projection-based
metrics.
In point-based methods, the first proposed meth-
ods are Point-to-point metrics that compute the geo-
metric distance between the corresponding points of
the reference and the distorted point cloud. How-
ever, these methods do not consider the surface struc-
tures representation. The point-to-plane metrics mea-
sure the geometric distortion by projecting the point-
to-point distance vector along the normal direction.
Other point-based methods have been proposed in
light of these researches. Alexiou et al. (Alexiou and
Ebrahimi, 2018) proposed a metric based on measur-
ing the angular similarity between the tangent planes
of a point from reference and its degraded version.
Javaheri et al.(Javaheri et al., 2020b) compute the ge-
ometric distance between a point and a distribution
of points from the other point cloud based on the
well-known Mahalanobis distance. This work is ex-
tended to evaluate the color distortion by fusing the
geometry and the color point-to-distribution distor-
tions to obtain the joint geometry and color quality
metric (Javaheri et al., 2021). Meynet et al. (Meynet
et al., 2019) present PC-MSDM metric inspired by
the well-known Structural Similarity (SSIM) for 2D
images (Wang et al., 2004). Taken a point cloud of
reference and its distorted version, the authors estab-
lish the difference structure of local curvature statis-
tics to produce a quality score that indicates the distor-
tion level in PC. The same authors proposed another
work, so-called Point Cloud Quality Metric (PCQM)
(Meynet et al., 2020). They select various geometry
and color based features and combine them through
a linear model. Viola et al. (Viola et al., 2020)
proposed a geometry and color based metric by em-
ploying color statistics including histogram and cor-
relogram to capture color impairment, and using a
point-to-point method to compute the geometric dis-
tortions. Finally, a linear combination is used to ob-
tain an overall quality score. Alexiou et al. (Alexiou
and Ebrahimi, 2020) extract several features to cap-
ture the existing local changes between the reference
and the distorted PC and predict their quality. Finally,
Diniz et al.(Diniz et al., 2021) use color and geom-
etry descriptors to extract statistic features from the
reference and the distorted PC in order to estimate the
quality score.
In projection-based methods, the authors project
the 3D point clouds into different 2D views, and then
they evaluate the quality of the point clouds. Torlig
et al. (Torlig et al., 2018) project the voxelized 3D
PC into six 2D orthographic projections and each
reference and its corresponding distorted version are
evaluated based on 2D objective metrics, including
Peak Signal-to-Noise Ratio (PSNR), Visual Informa-
tion Fidelity in Pixel domain (VIFP) and Multi-Scale
Structural Similarity (MS-SSIM). Then, they average
all the obtained scores into one total score that indi-
cate the level of degradation in the PC. Yang et al.
(Yang et al., 2020) aggregate the global and the local
features extracted from all the six perpendicular color
texture and depth images projected from the reference
and the distorted PC, in order to have the final objec-
tive quality. Chen et al. (Chen et al., 2021) proposed a
hybrid method that extract from the layered reference
PCs and their distorted versions, geometric features
based on projection-based method and color features
based on the point-based method. Then, the distortion
values of PCs are computed through a weighted linear
combination of all the extracted features.
We remark that most of the state-of-the-art meth-
ods of PCQA are FR that count on the presence of the
reference PC for the assessment, while the NR meth-
ods are less studied in the literature, due to the high
complexity of their task. In this context, and based
on the large demand of NR methods in several real
life multimedia applications, we propose a novel no-
reference PCQA method that predicts the perceptual
quality of point clouds without access to the refer-
ence.
3 PROPOSED METHOD
The flowchart of our proposed method is presented in
Figure 1. First, we render the 3D point clouds from
multiple points of view by projecting the point clouds
into 2D images. Then, we split the images into central
patches in the vertical direction before feeding them
Blind Projection-based 3D Point Cloud Quality Assessment Method using a Convolutional Neural Network
519
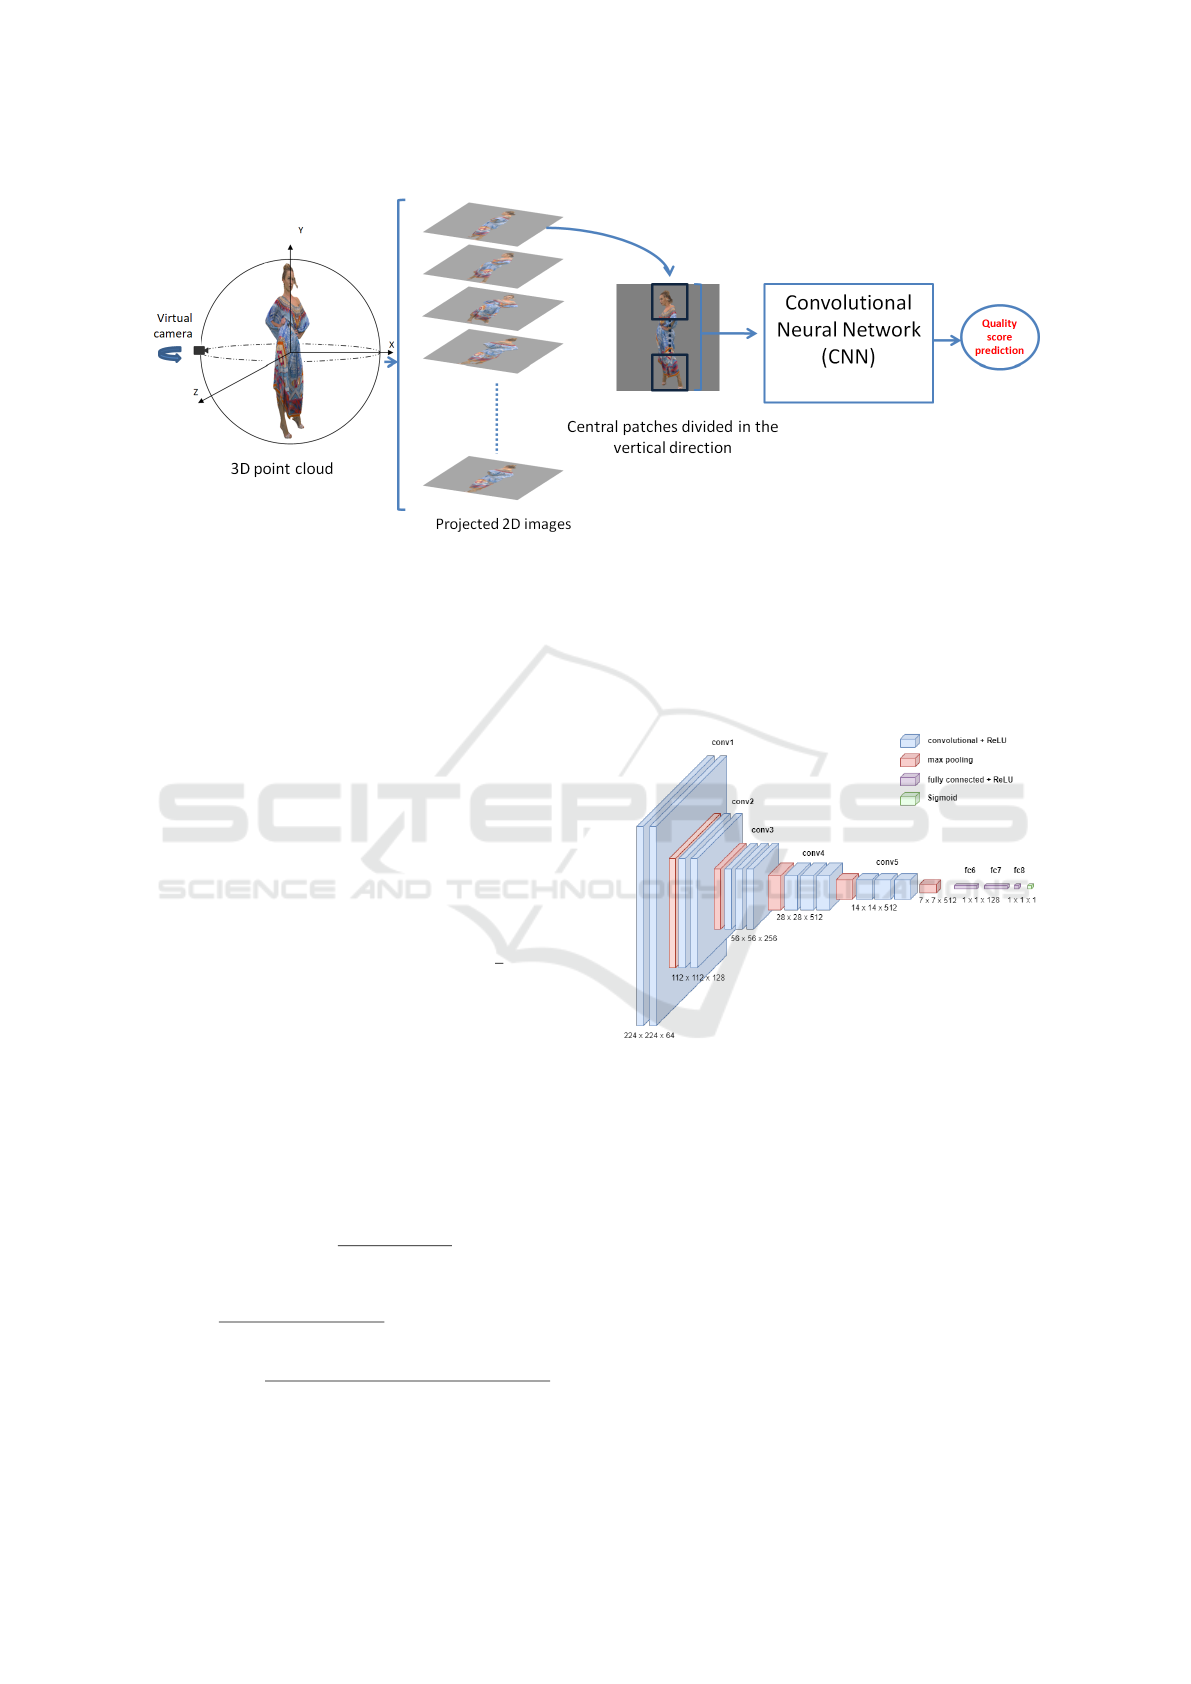
Figure 1: Flowchart of the proposed NR-PCQA method.
to a CNN that predicts the scores of each patch. Fi-
nally, the quality score of each 3D point cloud is ob-
tained by averaging the scores of the patches.
3.1 Point Cloud Rendering
The first step consists of rendering 2D projections
from 3D point clouds at multiple viewpoints. Since
the information in the point cloud is different accord-
ing to the point of view from which it is rendered, we
fixed virtual cameras at different angles to surround
the 3D point clouds. For each point cloud, the cen-
troid of PC is positioned at the origin of the spherical
coordinate system (Abouelaziz et al., 2018; Aboue-
laziz et al., 2020a; Abouelaziz et al., 2020b). The
coordinates of the virtual cameras (r, θ
el
, φ
az
) are ob-
tained by varying the angle φ
az
∈ [0, 2π] by
π
6
and set-
ting θ
el
to zero. The distance (r) between the camera
and the 3D object is varying according to the size of
the object. After that, we sample the projected images
into 4 central overlapping patches of size 224 × 224
pixels in vertical direction with stride 90 in order to
discard the useless backgrounds. Then, we normalize
each image patch by a local normalization, as demon-
strated in equation 1. The size of each projected view
is 512 × 512 pixels, then we obtain 12 × 4 = 48 nor-
malized patches from each PC.
ˆ
I(i, j) =
I(i, j) − µ(i, j)
σ(i, j) +C
(1)
µ(i, j) =
1
(2P + 1) × (2Q + 1))
p=P
∑
p=−P
q=Q
∑
q=−Q
I(i+ p, j +q)
σ(i, j) =
v
u
u
t
p=P
∑
p=−P
q=Q
∑
q=−Q
(I(i + p, j + q) − µ(i, j))
2
where
ˆ
I(i, j) is the normalized intensity value of the
I(i, j) pixel at the (i, j) location, µ(i, j) and σ(i, j) in-
dicate the local mean and variance, respectively. C
is a constant value that sets at 1 to prevent division
by zero, P and Q are the normalization window sizes
(Kang et al., 2014).
Figure 2: The adjusted architecture of VGG-16 for 3D point
cloud quality evaluation.
3.2 Convolutional Neural Network
Motivated by the high performance of the VGG-16
architecture (Simonyan and Zisserman, 2014) in dif-
ferent computer vision fields (Chetouani, 2019; Gao
et al., 2017; Zhang et al., 2020; Karine et al., 2020;
Fourati et al., 2020), we exploit this model to esti-
mate the quality score of the PC patches. More pre-
cisely, we adopt a transfer learning approach by trans-
ferring the hyperparameters of the pre-trained VGG-
16 on ImageNet dataset (Deng et al., 2009). VGG-16
model is composed of 13 convolutional layers, 5 max-
pooling layers and 3 fully-connected layers. This net-
work is characterized by utilizing small kernels size
VISAPP 2022 - 17th International Conference on Computer Vision Theory and Applications
520
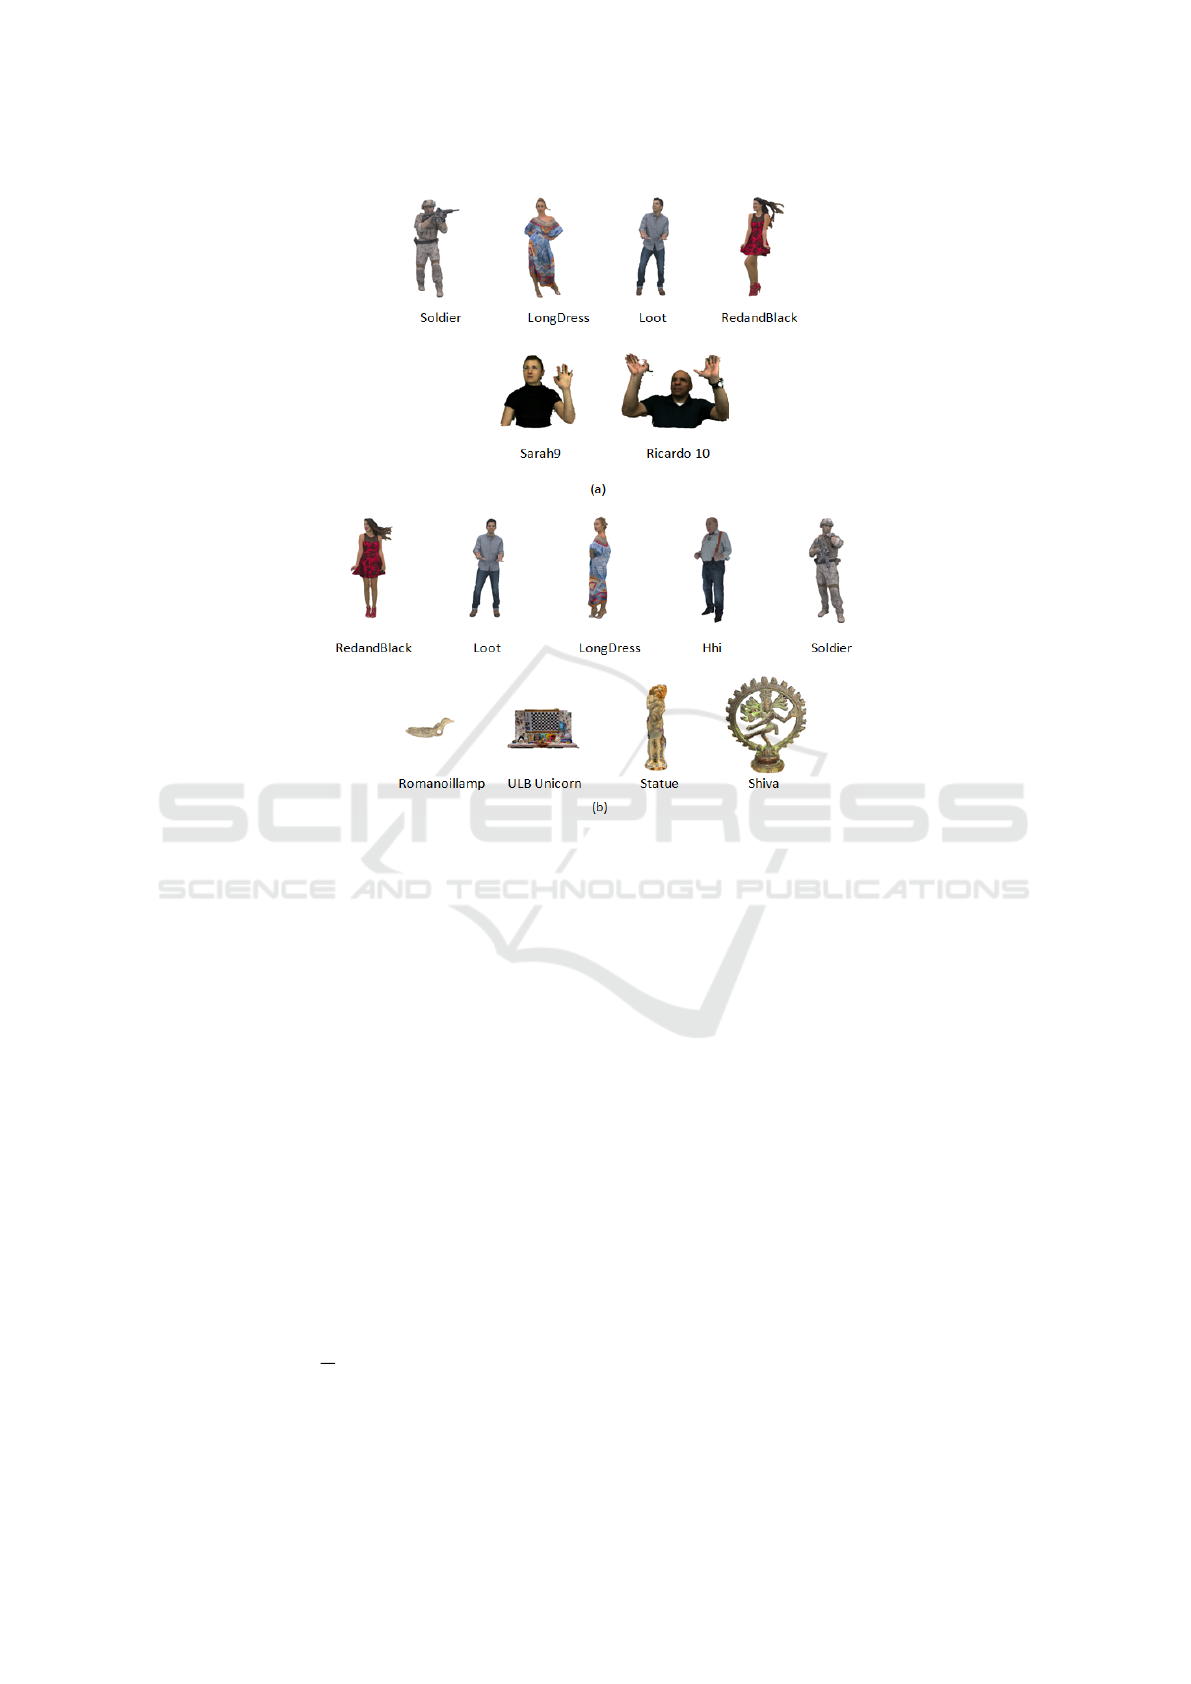
Figure 3: Reference point cloud of (a) ICIP2020 and (b) SJTU databases.
that enables reducing the computational complexity
of the model while improving its generalization abil-
ity. We adjust the original model architecture to make
it suitable for the NR-PCQA task by modifying the
size of the last three fully-connected layers in order
to adapt it to regression, as shown in Figure 2. Each
fully-connected layer is followed by a dropout set to
0.5 and a Rectified Linear Unit (ReLu) except the out-
put layer that has a Sigmoid function to predict the
normalized quality score patches. The final quality
score is computed by averaging the quality scores of
all extracted PC patches.
3.3 Training
We underline that the normalized Mean Opinion
Scores (MOS) of each PC is affected to all associated
patches. To quantify the error between the predicted
(S
n
) and the subjective (MOS
n
) quality score, we use
the L
1
loss function, defined as follows :
L oss =
1
N
N
∑
n=1
|S
n
− MOS
n
| (2)
where N is the batch size set to 128. To optimize
the model parameters, we use the Stochastic Gradi-
ent Descent (SGD) with a momentum set to 0.9 and
a weight decay equal to 0.0001, the learning rate is
initialized with 10
−3
and is reduced at each 70 epochs
with gamma equal to 0.1. Pytorch framework (Paszke
et al., 2019) is used for the implementation.
4 EXPERIMENTAL RESULTS
In this section, we first outline the point cloud
databases and the protocol used to train and test the
proposed model. Then, we define the performance
evaluation criteria. Finally, we compare and discuss
the performance results of our model with the state-
of-the-art methods.
4.1 Point Cloud Databases
To evaluate the performance of our model, we used
two benchmark subjective databases:
• ICIP2020 (Perry et al., 2020): contains 6 ref-
erence PCs, as illustrated in figure 3 (a) (4 PCs
are with complete coverage and 2 point clouds are
with semi-coverage: Sarah9 and Ricardo10), and
Blind Projection-based 3D Point Cloud Quality Assessment Method using a Convolutional Neural Network
521
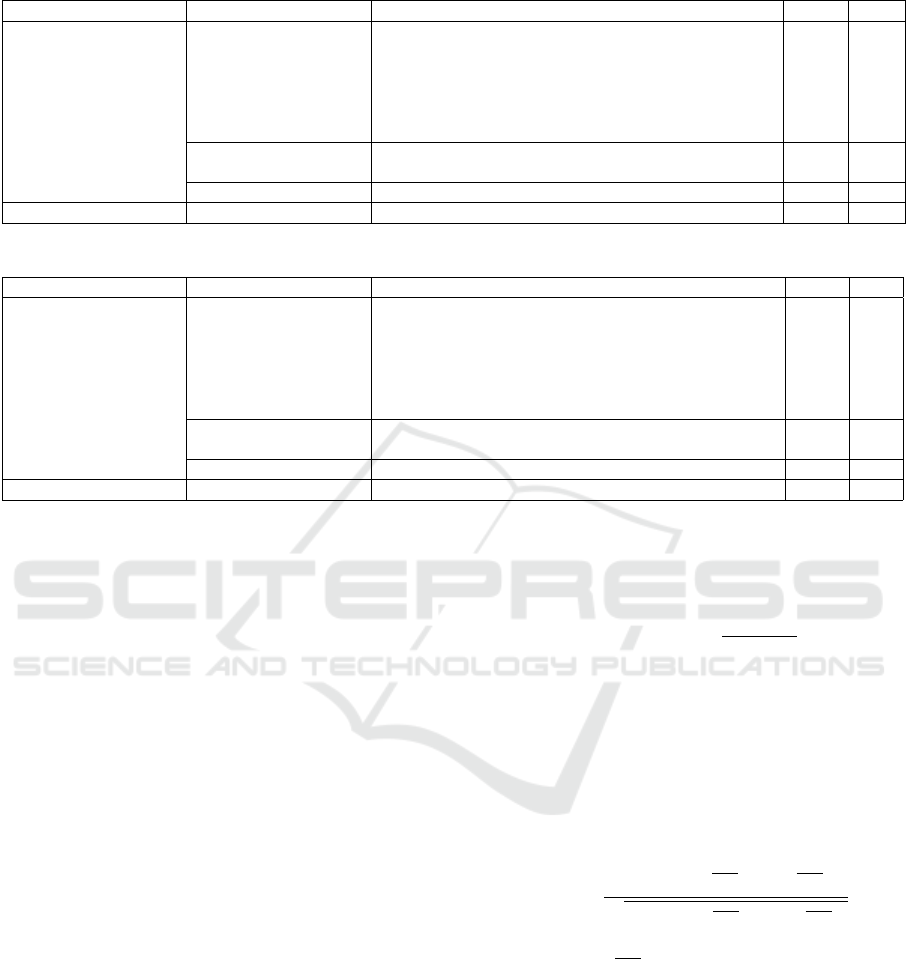
Table 1: Performance comparison of the proposed method against the state-of-the-art methods on ICIP2020 database.
Type Type of methods Methods SROCC PLCC
Full-reference methods (FR) Point-based methods D1 MSE (Tian et al., 2017) 0.954 0.615
D1 Hausdorff (Javaheri et al., 2020a) 0.682 0.615
D2 MSE (Tian et al., 2017) 0.971 0.618
D2 Hausdorff (Javaheri et al., 2020a) 0.735 0.491
MMD P2D-G (Geometry) (Javaheri et al., 2020b) 0.960 0.784
MMD P2D- JGY (Joint Geometry and Color) (Javaheri et al., 2021) 0.965 0.881
Feature-based methods PCQM method (Meynet et al., 2020) 0.977 0.942
PointSSIM (Alexiou and Ebrahimi, 2020) 0.795 0.717
Angular-based method Angle-MSE (Alexiou and Ebrahimi, 2018) 0.902 0.626
No-reference methods (NR) Deep learning-based method The proposed NR-PCQA 0.981 0.951
Table 2: Performance comparison of the proposed method against the state-of-the-art methods on SJTU database.
Type Type of methods Methods SROCC PLCC
Full-reference methods (FR) Point-based methods D1 MSE (Tian et al., 2017) 0.803 0.606
D1 Hausdorff (Javaheri et al., 2020a) 0.687 0.606
D2 MSE (Tian et al., 2017) 0.715 0.568
D 2 Hausdorff (Javaheri et al., 2020a) 0.683 0.562
MMD P2D-G (Geometry) (Javaheri et al., 2020b) 0.604 0.628
MMD P2D- JGY (Joint Geometry and Color) (Javaheri et al., 2021) 0.755 0.667
Feature-based methods PCQM method (Meynet et al., 2020) 0.807 0.805
PointSSIM (Alexiou and Ebrahimi, 2020) 0.685 0.652
Angular-based method Angle-MSE (Alexiou and Ebrahimi, 2018) 0.772 0.615
No-reference methods (NR) Deep learning-based method The proposed NR-PCQA 0.927 0.921
90 distorted versions achieved by 3 compression
methods: G-PCC Octree, G-PCC Trisoup and V-
PCC with 5 different levels from the low to the
high quality.
• SJTU (Yang et al., 2020): contains 9 refer-
ence point clouds, as shown in figure 3 (b) (all
the objects are with complete coverage) and their
378 distorted versions degraded using 7 types
of distortions that can appear on point clouds
in practical applications: Octree-based compres-
sion, Color Noise, Down-scaling, Down-scaling
and Color noise, Geometry Gaussian noise, Color
noise and Geometry Gaussian noise.
To make a fair comparison, we conduct the same
experimental protocol to our method and the state-of-
the-art baselines. Especially, we use a k-fold cross
validation. One fold (object) is used for the test phase
and one for the validation phase, while the remain-
ing objects (k-2 folds) are used for the training phase,
with no-overlapping between the training, validation
and test sets. We mention that the 2 semi-coverage
PCs of ICIP2020 database are not taken into account
in this experiment. Consequently, the number of folds
in ICIP2020 equals to 4 and equals to 7 for SJTU.
4.2 Evaluation Metrics
To evaluate the performance of our model against the
other quality metrics, we adopt two evaluation criteria
(Zhai and Min, 2020):
1. Spearman Rank Order Coefficient (SROCC):
measures the monotonicity between the predicted
and the subjective quality score as follows :
SROCC = 1 −
∑
d
2
i
n(n
2
− 1)
(3)
where d
i
represents the rank distance between pre-
dicted and subjective quality score (MOS), and n
is the number of the used point clouds.
2. Pearson Linear Correlation Coefficient (PLCC):
computes the strong correlation between the pre-
dicted and the ground truth score using the follow-
ing equation :
PLCC =
∑
n
i=1
(M
i
− M
p
)(M
i
− M
p
)
q
∑
n
i=1
(M
i
− M
p
2
)(M
i
− M
p
)
2
(4)
where M and M
p
represents the ground truth and
the predicted quality score, respectively. The i
represents the number of instance on the test set.
The absolute values of both criteria vary between 0
and 1, a higher value indicates the best quality predic-
tion performance. The correlation result is the mean
of the computed correlations in each cross-validation
iteration.
VISAPP 2022 - 17th International Conference on Computer Vision Theory and Applications
522
4.3 Performance Comparison
In order to evaluate the proposed method, we make
a comparison with different state-of-the-art metrics
on ICIP2020 and SJTU databases, we split the
state-of-the-art metrics into 4 groups: Point-based,
Feature-based, Angular-based, and Deep learning-
based methods. The highest values of SROCC and
PLCC are highlighted in bold in order to find the best
correlation values. The results on ICIP2020 are re-
ported in Table 2. As we can observe, our model
achieves the highest correlation compared to point-
based methods in a range varying between 1% and 3%
for SROCC, and between 7% and 46% for PLCC. In
the features-based methods, the proposed method out-
performs the PointSSIM metric with 19% in SROCC
and 24% in PLCC, and shows a competitive perfor-
mance in SROCC compared to PCQM metric while
surpassing it in PLCC with 1%. Finally, compared to
the angle-based method, our method achieves a higher
performance in SROCC and PLCC metrics.
We show in Table 2 the comparison results on
SJTU database. The proposed method presents the
best performance overall the nine FR-PCQA state-of-
the-art metrics. Our metric presents a gain varying
between 12% and 32% in SROCC, 25% and 36%
in PLCC for the point-based methods, and exceeds
the features based methods with a variation between
12% and 24% in SROCC and between 27% and 12%
in PLCC. In both PLCC and SROCC, the proposed
model performs better than angular-based method,
more precisely, it is higher with 15% for SROCC and
31% for PLCC.
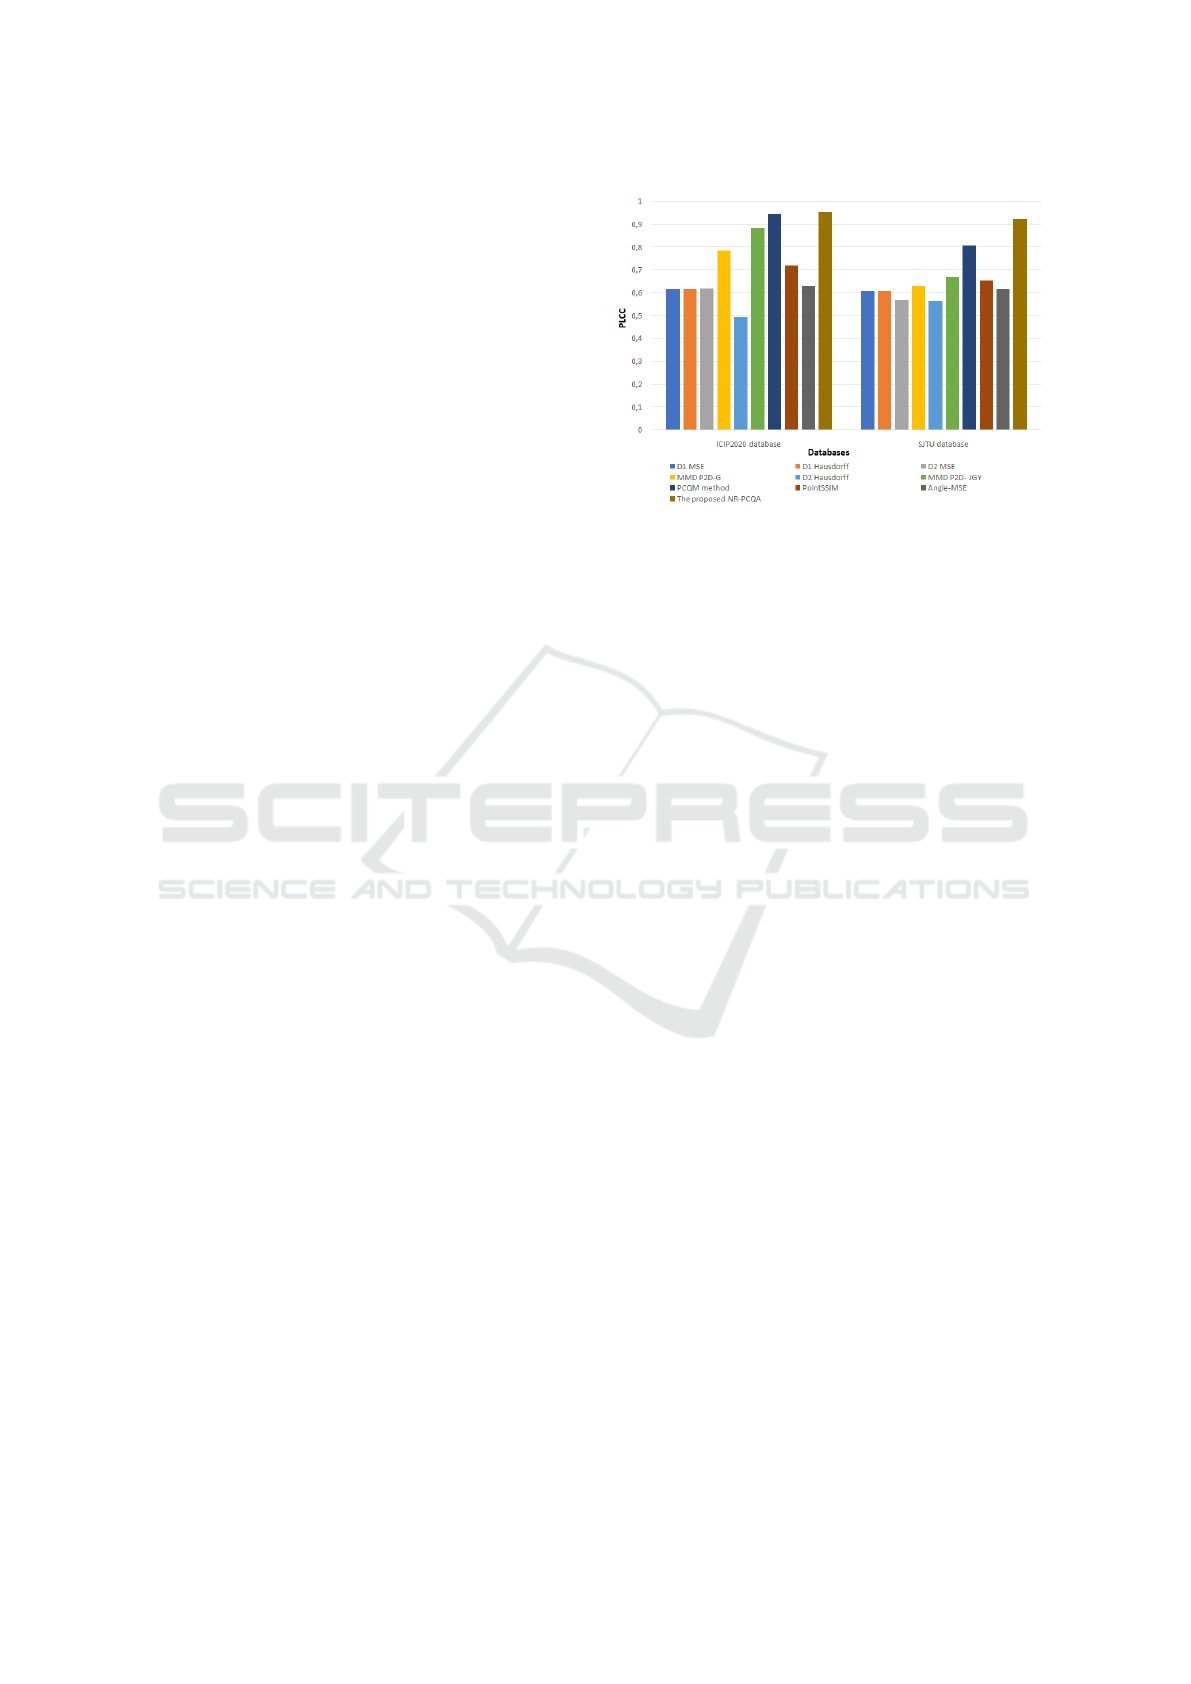
We highlight that the methods incorporating ge-
ometry and color distortion information achieved
good performance compared to the methods based
only on the simple geometric distance. Further-
more, the performance of all models on the ICIP2020
database is better than the SJTU database, as demon-
strated in figure 4. That can be explained by the
type of distortion in both databases, in ICIP2020 there
are only compression types while in SJTU there is
more challenging distortion types including acquisi-
tion noise. However, our model was able to achieve
the best performance on both databases and outper-
form the state-of-the-art methods.
We evaluate the ability of our model to predict
the perceptual quality score by comparing the scores
predicted by our model and their corresponding sub-
jective scores for 3 different distortion types (G-PCC
Trisoup R02, GPCC Octree R01, and VPCC RO5)
applied on the RedandBlack object in the ICIP2020
database. The object with the highest quality is scored
by 5 and the object with the lowest quality is scored by
Figure 4: PLCC of comparison metrics on ICIP2020 and
SJTU databases.
1. As we can observe in Figure 5, our model was able
to effectively predict the quality scores, which proves
the robustness of the proposed model. Based on the
obtained results, we emphasize that deep learning-
based methods represent an outstanding advantage in
learning sophisticated features and predicting the per-
petual quality with high accuracy compared to the
handcrafted methods.
5 CONCLUSION
In this paper, we proposed a deep learning no-
reference point cloud quality assessment method that
projects a 3D point cloud into multi-viewpoint and
uses them as an input to a deep convolutional neural
network. We relied on the concept of transfer-leaning
in order to help the CNN model to find the best map-
ping between the input 2D projected views and the
quality scores. It is noteworthy that our model is a
no-reference method that does not require any refer-
ence data and allows the point cloud quality evalua-
tion in a single optimization process, which represents
a promising track in practical situations. We demon-
strated through the obtained experimental results that
our model shows a better performance in predicting
quality scores compared to the full-reference state-
of-the art methods. As future work, we aim to in-
clude the semi-coverage objects case by completing
the 3D shape of the PCs. Also, we plane to test
the performance of the proposed method with dif-
ferent pretrained models (Resnet(He et al., 2015),
Alexnet(Krizhevsky et al., 2012), etc.).
Blind Projection-based 3D Point Cloud Quality Assessment Method using a Convolutional Neural Network
523
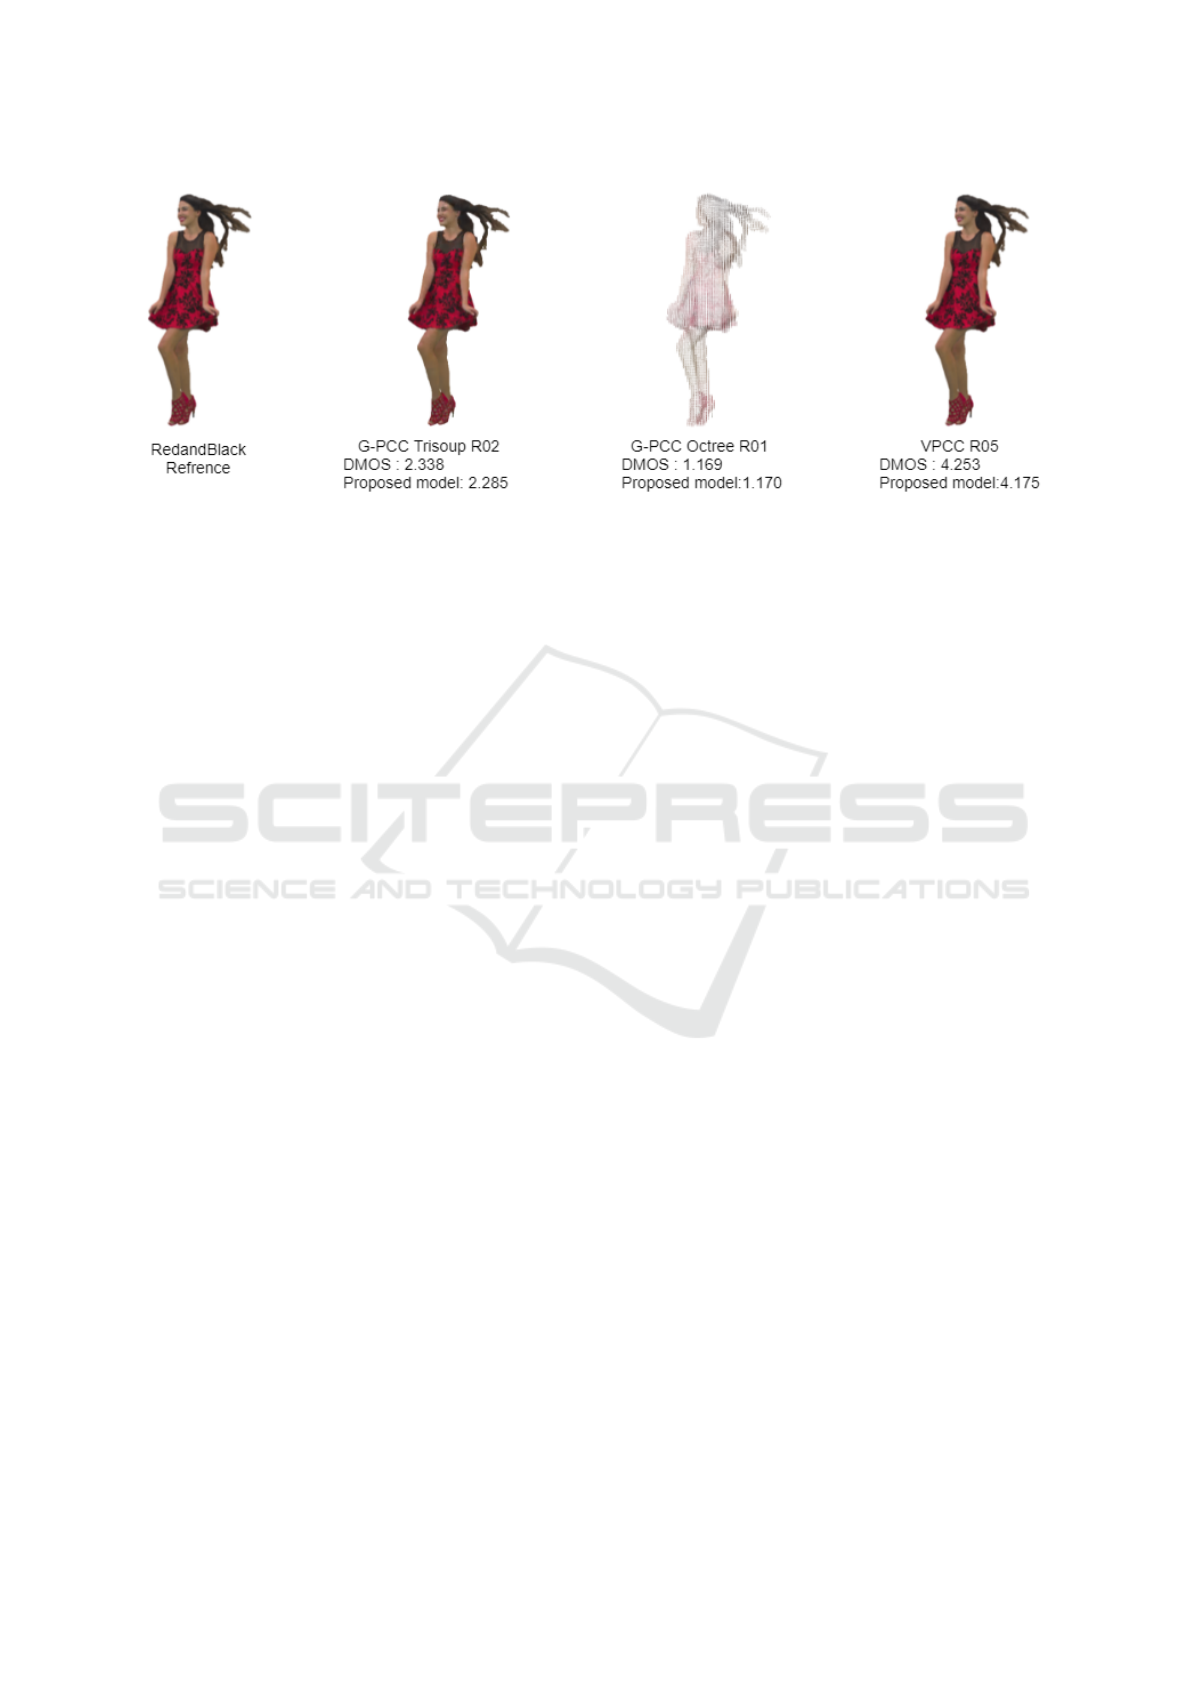
Figure 5: Perceptual quality score comparison between the proposed model and the subjective quality score (MOS) on
RedandBlack object from ICIP2020 dataset.
REFERENCES
Abouelaziz, I., Chetouani, A., Hassouni, M. E., Latecki,
L. J., and Cherifi, H. (2018). Convolutional neural
network for blind mesh visual quality assessment us-
ing 3d visual saliency. In 2018 25th IEEE Interna-
tional Conference on Image Processing (ICIP), pages
3533–3537.
Abouelaziz, I., Chetouani, A., Hassouni, M. E., Latecki,
L. J., and Cherifi, H. (2020a). 3d visual saliency and
convolutional neural network for blind mesh quality
assessment. Neural Comput. Appl., 32(21):16589–
16603.
Abouelaziz, I., Chetouani, A., Hassouni, M. E., Latecki,
L. J., and Cherifi, H. (2020b). No-reference mesh
visual quality assessment via ensemble of convolu-
tional neural networks and compact multi-linear pool-
ing. Pattern Recognit., 100:107174.
Alexiou, E. and Ebrahimi, T. (2018). Point cloud qual-
ity assessment metric based on angular similarity. In
2018 IEEE International Conference on Multimedia
and Expo (ICME), pages 1–6.
Alexiou, E. and Ebrahimi, T. (2020). Towards a point
cloud structural similarity metric. In 2020 IEEE Inter-
national Conference on Multimedia Expo Workshops
(ICMEW), pages 1–6.
Bourbia, S., Karine, A., Chetouani, A., and El Hassouni,
M. (2021). A Multi-task convolutional neural net-
work for blind stereoscopic image quality assessment
using naturalness analysis. In The 28th IEEE Interna-
tional Conference on Image Processing (IEEE - ICIP),
Anchorage-Alaska, United States.
Chen, T., Long, C., Su, H., Chen, L., Chi, J., Pan, Z.,
Yang, H., and Liu, Y. (2021). Layered projection-
based quality assessment of 3d point clouds. IEEE
Access, 9:88108–88120.
Chetouani, A. (2014). Full reference image quality metric
for stereo images based on cyclopean image compu-
tation and neural fusion. In 2014 IEEE Visual Com-
munications and Image Processing Conference, pages
109–112.
Chetouani, A. (2018). Convolutional neural network and
saliency selection for blind image quality assessment.
In 2018 25th IEEE International Conference on Image
Processing (ICIP), pages 2835–2839.
Chetouani, A. (2019). Blind utility and quality assessment
using a convolutional neural network and a patch se-
lection. In 2019 IEEE International Conference on
Image Processing (ICIP), pages 459–463.
Deng, J., Dong, W., Socher, R., Li, L.-J., Li, K., and Fei-
Fei, L. (2009). Imagenet: A large-scale hierarchical
image database. In 2009 IEEE Conference on Com-
puter Vision and Pattern Recognition, pages 248–255.
Diniz, R., Farias, M. Q., and Garcia-Freitas, P. (2021).
Color and geometry texture descriptors for point-
cloud quality assessment. IEEE Signal Processing
Letters.
Fourati, E., Elloumi, W., and Chetouani, A. (2020). Anti-
spoofing in face recognition-based biometric authenti-
cation using image quality assessment. Multim. Tools
Appl., 79(1-2):865–889.
Gao, L., He, C., Luo, W., Cui, Y., Fan, Q., Peng, Q., Zhao,
G., Hao, X., Xia, Y., and Zhang, P. (2017). Blind im-
age quality assessment model based on deep convolu-
tional neural network. In 2017 International Confer-
ence on Computer Technology, Electronics and Com-
munication (ICCTEC), pages 336–339.
He, K., Zhang, X., Ren, S., and Sun, J. (2015). Deep
residual learning for image recognition. CoRR,
abs/1512.03385.
Javaheri, A., Brites, C., Pereira, F., and Ascenso, J. (2020a).
A generalized hausdorff distance based quality metric
for point cloud geometry. In 2020 Twelfth Interna-
tional Conference on Quality of Multimedia Experi-
ence (QoMEX), pages 1–6. IEEE.
Javaheri, A., Brites, C., Pereira, F., and Ascenso, J. (2020b).
Mahalanobis based point to distribution metric for
point cloud geometry quality evaluation. IEEE Sig-
nal Processing Letters, 27:1350–1354.
Javaheri, A., Brites, C., Pereira, F., and Ascenso, J. (2021).
A point-to-distribution joint geometry and color met-
ric for point cloud quality assessment. arXiv preprint
arXiv:2108.00054.
VISAPP 2022 - 17th International Conference on Computer Vision Theory and Applications
524

Kang, L., Ye, P., Li, Y., and Doermann, D. (2014). Convolu-
tional neural networks for no-reference image quality
assessment. In 2014 IEEE Conference on Computer
Vision and Pattern Recognition, pages 1733–1740.
Karine, A., Napol
´
eon, T., Mulot, J.-Y., and Auffret, Y.
(2020). Video seals recognition using transfer learn-
ing of convolutional neural network. In 2020 Tenth In-
ternational Conference on Image Processing Theory,
Tools and Applications (IPTA), pages 1–4.
Krizhevsky, A., Sutskever, I., and Hinton, G. E. (2012). Im-
agenet classification with deep convolutional neural
networks. In Pereira, F., Burges, C. J. C., Bottou, L.,
and Weinberger, K. Q., editors, Advances in Neural
Information Processing Systems, volume 25. Curran
Associates, Inc.
Meynet, G., Digne, J., and Lavou
´
e, G. (2019). Pc-msdm: A
quality metric for 3d point clouds. In 2019 Eleventh
International Conference on Quality of Multimedia
Experience (QoMEX), pages 1–3. IEEE.
Meynet, G., Nehm
´
e, Y., Digne, J., and Lavou
´
e, G. (2020).
Pcqm: A full-reference quality metric for colored 3d
point clouds. In 2020 Twelfth International Confer-
ence on Quality of Multimedia Experience (QoMEX),
pages 1–6.
Paszke, A., Gross, S., Massa, F., Lerer, A., Bradbury, J.,
Chanan, G., Killeen, T., Lin, Z., Gimelshein, N.,
Antiga, L., Desmaison, A., Kopf, A., Yang, E., De-
Vito, Z., Raison, M., Tejani, A., Chilamkurthy, S.,
Steiner, B., Fang, L., Bai, J., and Chintala, S. (2019).
Pytorch: An imperative style, high-performance deep
learning library. In Advances in Neural Information
Processing Systems 32, pages 8024–8035. Curran As-
sociates, Inc.
Perry, S., Cong, H. P., da Silva Cruz, L. A., Prazeres, J.,
Pereira, M., Pinheiro, A., Dumic, E., Alexiou, E., and
Ebrahimi, T. (2020). Quality evaluation of static point
clouds encoded using mpeg codecs. In 2020 IEEE In-
ternational Conference on Image Processing (ICIP),
pages 3428–3432.
Simonyan, K. and Zisserman, A. (2014). Very deep con-
volutional networks for large-scale image recognition.
arXiv preprint arXiv:1409.1556.
Tian, D., Ochimizu, H., Feng, C., Cohen, R., and Vetro, A.
(2017). Geometric distortion metrics for point cloud
compression. In 2017 IEEE International Conference
on Image Processing (ICIP), pages 3460–3464.
Torlig, E. M., Alexiou, E., Fonseca, T. A., de Queiroz, R. L.,
and Ebrahimi, T. (2018). A novel methodology for
quality assessment of voxelized point clouds. In Ap-
plications of Digital Image Processing XLI, volume
10752, page 107520I. International Society for Optics
and Photonics.
Viola, I., Subramanyam, S., and Cesar, P. (2020). A color-
based objective quality metric for point cloud con-
tents. In 2020 Twelfth International Conference on
Quality of Multimedia Experience (QoMEX), pages
1–6. IEEE.
Wang, Z., Bovik, A. C., Sheikh, H. R., and Simoncelli, E. P.
(2004). Image quality assessment: from error visi-
bility to structural similarity. IEEE transactions on
image processing, 13(4):600–612.
Yang, Q., Chen, H., Ma, Z., Xu, Y., Tang, R., and Sun,
J. (2020). Predicting the perceptual quality of point
cloud: A 3d-to-2d projection-based exploration. IEEE
Transactions on Multimedia, pages 1–1.
Zhai, G. and Min, X. (2020). Perceptual image quality as-
sessment: a survey. Science China Information Sci-
ences, 63(11):211301.
Zhang, H., Meng, F., and Han, Y. (2020). No-reference
image quality assessment based on a multi-feature ex-
traction network. In Proceedings of the 2020 2nd In-
ternational Conference on Image, Video and Signal
Processing, pages 81–85.
Blind Projection-based 3D Point Cloud Quality Assessment Method using a Convolutional Neural Network
525
