
Identification of over One Thousand Individual Wild Humpback
Whales using Fluke Photos
Takashi Yoshikawa
1a
, Masami Hida
1
, Chonho Lee
2
, Haruna Okabe
3
, Nozomi Kobayashi
3
,
Sachie Ozawa
3
, Hideo Saito
4b
, Masaki Kan
5
, Susumu Date
1
and Shinji Shimojo
1
1
Cybermedia Center, Osaka University, 5-5-1 Mihogaoka, Ibaraki, Osaka, Japan
2
Department of Information Science, Okayama University of Science, 1-1. Ridaicho, Kita, Okayama, Japan
3
Okinawa Churashima Research Center, Okinawa Churashima Foundation,
888, Ishikawa, Motobu, Kunigami, Okinawa, Japan
4
Faculty of Science and Technology, Keio University, 3-14-1 Kohoku, Hiyoshi, Yokohama, Japan
5
Diagence Inc. 1-1-25, Ogichou, Naka-ku, Yokohama, Japan
{h-okabe, n-kobayashi, s-ozawa}@okichura.jp, saito@hvrl.ics.keio.ac.jp, kan@dia-gence.com
Keywords: Whale, Photograph, Identification, Deep Learning, Segmentation, Feature, Wavelet.
Abstract: Identifying individual humpback whales by photographs of their tails is valuable for understanding the
ecology of wild whales. We have about 10,000 photos of 1,850 identified whales taken in the sea area around
Okinawa over a 30-year period. The identification process on this large scale of numbers is difficult not only
for the human eye but also for machine vision, as the numbers of photographs per individual whale are very
low. About 30% of the whales have only a single photograph, and 80% have fewer than five. In addition, the
shapes of the tails and the black and white patterns on them are vague, and these change readily with the
whale’s slightest movement and changing photo-shooting conditions. We propose a practical method for
identifying a humpback whale by accurate segmentation of the fluke region using a combination of deep
neural networking and GrabCut. Then useful features for identifying each individual whale are extracted by
both histograms of image features and wavelet transform of the trailing edge. The test results for 323 photos
show the correct individuals are ranked within the top 30 for 89% of the photos, and at the same time for 76%
of photos ranked at the top.
1 INTRODUCTION
Humpback whale identification is very important in
terms of ecological research and conservation efforts
(Dawbin, W. H., 1966). Research shows that the sea
area of the Okinawa Islands in Japan is one of the
breeding areas of humpback whales in the western
North Pacific Ocean. They migrate to this area from
December to April every year (Uchida, 1997;
Kobayashi et al., 2016) from feeding grounds such as
Russia and the Bering Sea near the Arctic, about 7000
km from Okinawa (Titova, 2018).
Humpback whales lift and show their tail fin,
known as the fluke, when they dive from the surface
to the depths. In terms of their identification, usually
two features of the ventral side of the flukes are
a
https://orcid.org/0000-0003-4642-9120
b
https://orcid.org/0000-0002-2421-9862
observed (Katona, 1979). One is the overall shape of
the black and white pattern, including small patterns
such as linear scars and roundish traces of barnacles.
The other feature is the jagged shape of the trailing
edge, which is believed to vary from whale to whale.
Currently most humpback whale researchers
identify each whale by their own eyes and by memory,
carefully observing whale photographs, comparing
the two features with those of registered whales.
Identifying individual whales is thus a time-
consuming process. For example, the Okinawa
Churashima Foundation has about 10,000
photographs of 1,850 individual whales. In order to
complete identification of about 450 photos from
every new season, two researchers have to work on
the identification process for more than six months.
Yoshikawa, T., Hida, M., Lee, C., Okabe, H., Kobayashi, N., Ozawa, S., Saito, H., Kan, M., Date, S. and Shimojo, S.
Identification of over One Thousand Individual Wild Humpback Whales using Fluke Photos.
DOI: 10.5220/0010866900003124
In Proceedings of the 17th International Joint Conference on Computer Vision, Imaging and Computer Graphics Theory and Applications (VISIGRAPP 2022) - Volume 4: VISAPP, pages
957-967
ISBN: 978-989-758-555-5; ISSN: 2184-4321
Copyright
c
2022 by SCITEPRESS – Science and Technology Publications, Lda. All rights reserved
957

Therefore, automatic identification by computer
vision is highly desirable.
However, there are some difficulties in the
computer-based identification process using fluke
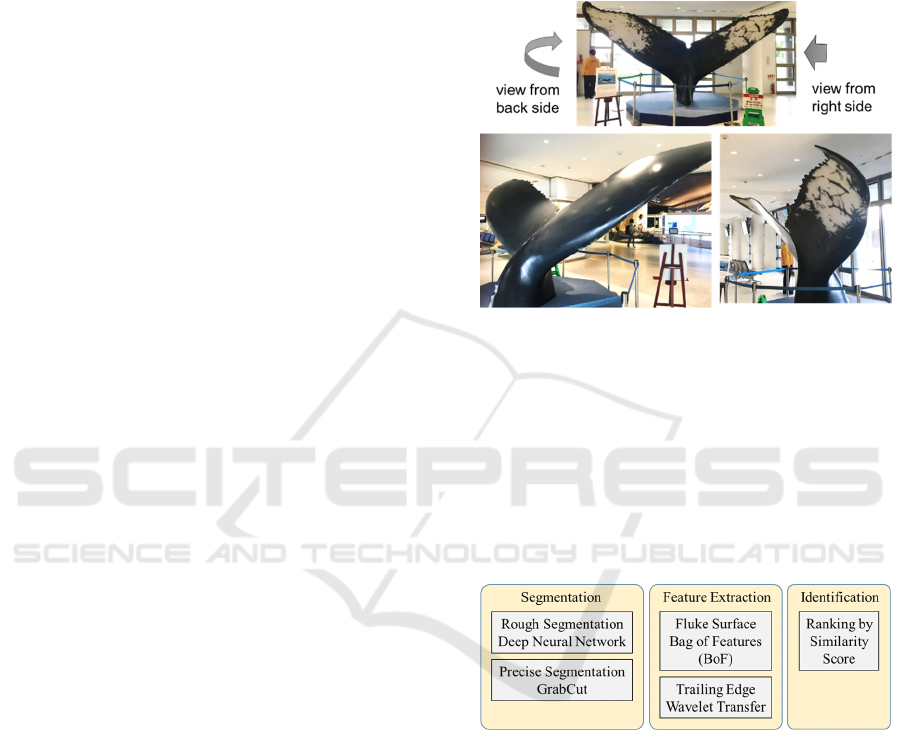
photographs. Figure 1 shows the typical shape of a
fluke. This is a life-size replica of a humpback
whale’s tail fin exhibited in the Okinawa Ocean Expo
Park. It has the form of a dynamic and complex 3D
structure with uneven curves. Therefore, when it is
rendered in a 2D photograph, the shape changes
diversely with slight changes of the shooting angle. In
addition, the structure of the tail fin itself is so flexible
that it changes greatly in accordance with the whale’s
slightest movement.
As is characteristic of sea animals, the tail fin does
not have sharp, distinct edges, neither in structure nor
in the black and white pattern. In addition, they are
susceptible to the effects of water and sunshine,
which reduces the effectiveness of edge-detection-
based graphical analytics tools, which are among the
most powerful analytical tools of graphic processing.
These characteristics of tail fin images make both
feature extraction and augmentation difficult in the
pattern-matching process.
In addition, the number of photographs of each
individual whale is very low. This is because we can
rarely take photographs of a whale tail fin upright and
in front of the camera from a distance close enough to
obtain a good-sized image in sharp focus. For
example, the number of good photographs taken in a
season by whale researchers of the Okinawa
Churashima Foundation is only about 450, even
though they conduct the surveys over approximately
50 to 80 days during a survey season. Of the whales
photographed, 79% have fewer than five photographs,
and 31% have only a single photograph. This results
in a shortage of learning data in the machine learning
process. All of the above makes computer-based
automatic identification of wild humpback whales
difficult.
The surface of the tail fins has a dark grey-based
color which is very similar to the color of the sea on
a cloudy day. This makes it difficult to distinguish tail
fins from the background sea. In comparison with
artificial constructions, the shape is complex, flexible,
and unclear, and the surface is susceptible to the
effects of water as well.
The purpose of our research is to improve the
identification process by automatically listing
candidate whales from a ledger of records of
previously identified whales.
We propose a practical method for computational
whale identification. For that, we use a combination
of rough detection of deep learning and precise
segmentation of image processing. First, the tail fin
of a whale is roughly marked with a u-net model.
With the mark, GrabCut can register the precise shape
of the tail (Tang, 2013). Then the jagged line on the
edge of the tail can be extracted as a feature vector. In
parallel we also use the bag-of-features (BoF) method
to compensate for cases where precise trailing-edge
detection is difficult (Nowak, 2006). The test results
of 323 photos show 76% of photos attained the
highest score for accurate identification, with 89% of
the photos ranked in the top 30.
2 RELATED WORKS
Humpback whale identification by photographs of
tail fins has been attempted since the 1980s, first by
the human eye. After that followed research work
taking a graphic approach using computers. Recently,
a deep neural networking approach has been applied
in a Kaggle contest of whale identification. The
related works are described in detail in the following.
Katona et al. (1979) suggested that variations in
the shape of flukes, scars, and black and white
patterns can be used to identify individual humpback
whales. These patterns are those on the ventral side of
the tail fins which appear to us when the whale dives
into the sea.
Friday et al. (2000) statistically investigated the
relation between the quality of the photographs and
distinctiveness in the identification process by the
human eye.
In terms of computer vision, Mizroch et al.
divided the tail fin into fourteen segmentations and
classified whales by the combination of which
segments are black and which are white. However,
this is thought to be insufficient for distinguishing
over thousands of whales, because the classification
methods are too coarse, using only fourteen sections
in each tail fin and with only the information of each
section being black or white.
Jablons et al. (2016) took another approach, using
the curvature of the trailing edge as an identifier.
They calculated the curvature along the trailing edge
and used it as feature of each whale. However, such
rough curve fitting is not capable of assuring large-
scale identification.
In terms of the deep neural networking (DNN)
approach, Bogucki et al. used convolutional neural
networks to identify the region of interest on a right
whale image; to rotate, crop, and create standardized
photographs of uniform size and orientation; and then
to identify the correct individual whale by a matching
VISAPP 2022 - 17th International Conference on Computer Vision Theory and Applications
958
algorithm, as it is done in face recognition (Bogucki,
2019).
Kaggle.com hosted the humpback whale
identification challenge in 2019 (Kaggle, 2019). The
winner applied metric learning, which compensates
for the disadvantage of DNN requiring large amounts
of data for learning by using distance from the correct
answer as an input in the learning process (Siomes,
2020). The winner used the whole tail as learning data,
which means the major feature was the black and
white pattern. However, from our experience, the
trailing edge is more useful for identification than the
black and white pattern because 30% of the whales in
our whale record have an entirely black or white tail,
without any pattern. The Kaggle dataset is different
from that of our target. The dataset in the Kaggle
challenge comprises 25,000 photographs in total,
with 10,000 of those (40%) being ‘new individual’,
with no passed record. The required answering format
is to list five probable candidate whales including
‘new individual’ as one of the correct answers. Less
than 30% of our dataset are ‘new individuals’, and the
list of candidate whales up to 30 is required without
‘new individual’ as the answer. In addition, the
photographs vary in quality. The photographs in the
Kaggle challenge include many low-quality
photographs taken by amateurs. Some of these were
taken from a long distance. In addition, many of the
tail fins are not photographed from the front or are not
upright. Such a dataset is difficult to treat by an
image-processing approach based on precise pixel-
level graphical information of shape, size, edge, etc.
We, however, have high-quality photographs taken
by trained whale researchers. Therefore, we can take
another approach, as described in the next section.
3 PROPOSED METHOD
Our dataset consists of 5,891 photographs, with 1,564
identified whales. Among them, 31% of the whales
have only a single shot, and 79% have fewer than five
photos, as described in detail in Section 4. However,
these photographs were taken by trained whale
researchers who selected the best photo of the day for
each whale. Still, the photographs are not always
taken from the front of an upright fluke and in good
focus, because all the photos were taken on the sea
under a variety of shooting conditions dictated by the
weather, waves, distance, and shooting angle.
We chose an image processing-based approach
for the main feature extraction method because the
quality of the photographs is good enough for such an
approach. In terms of the deep learning approach, the
number of photographs is insufficient to achieve good
accuracy. In addition, augmentation for an artificially
increasing dataset is difficult because the shape of the
fluke is of a complex 3D nature, and it changes
drastically along with the whale’s slightest
movements, as shown in Fig 1.
Figure 1: Life-size model of the fluke of a humpback whale.
However, an image processing method in general
needs precise information on the pixel level. It is
difficult to extract such precise information from
photographs of wild whale flukes which have a
flexible shape and an obscure grey-based dark color
similar to that of the sea.
Therefore, we propose an identification method
composed mainly of three functional blocks, as
shown in Fig. 2.
Figure 2: Proposed whale identification process.
A fluke is segmented in two steps from an input
photograph. After that, two kinds of feature vector of
the fluke are extracted using two image-processing-
based methods. Then the score and ranking are
calculated by comparing feature vectors with those of
previously identified whales in a ledger.
Deep Learning in the first block is suitable for
treating complex 3D shapes and the dark grey-based
color of flukes in the sea. The uncertainty of shape
and color which is inherent in handling marine life
has been reduced in the first block. This allows the
use of image processing techniques that require
accurate graphical information in the second block, in
which two image processing-based methods can
Identification of over One Thousand Individual Wild Humpback Whales using Fluke Photos
959
extract the feature vector of each fluke in terms of
black/white pattern and shape.
To extract features from black/white patterns, we
used a ‘bag-of-features’ (BoF) method, as derived
from the ‘bag-of-words’ representation used in
textual information retrieval. To extract features from
shapes we used a wavelet transform. Then in the third
block, those features of each fluke were corrected and
weighted along with the shape and angle of the fluke
in each photo. After that, the distance from that of
each whale in the ledger photo was obtained as a score.
The candidate whales are ranked from 1 to 30 using
the score representing similarity.
3.1 Segmentation
The first functional block (‘Segmentation’ in Fig. 2)
consisted of three steps, as shown in Fig. 3. Original
input photographs sometimes include two or more
flukes in the same photograph. Also, some
photographs of the whales do not show the fluke. In
the first step, photographs are classified using DNN.
For the detection of flukes in the original
photographs, we used the YOLO model (Redmon,
2016), which detects objects in a photo and classifies
the detected objects into ‘fluke’ or ‘not a fluke’ (e.g.,
fin, ship, bird) simultaneously. Then the detected
fluke is trimmed based on its bounding box. Actually,
in our case the first step, fluke detection and
trimming, is not necessary because we have already
prepared and trimmed the fluke photographs
manually. The accuracy of the trimming process
needs to be evaluated at another time.
In the second step of the segmentation, a rough
mask of each fluke is extracted through the use of a
deep learning model called U-net (Ronneberger
2015). The model takes trimmed images as input and
produces corresponding mask images as output by
learning features of the foreground: the fluke and
background features such as the sea, waves, and
splashes. As shown in Fig. 4, the U-net model has an
encoder-decoder network structure. The encoder
consists of three sets of two convolution layers and
one pooling layer, and it computes dimension-
reduced features. The decoder consists of three sets of
one upsampling and two convolution layers. The
upsampling layer performs a max unpooling method
to upsample features. The up-sampled features are
concatenated with the higher resolution features to
restore the global location information while
preserving local features.
Figure 3: Segmentation Process.
Figure 4: A network structure of U-net for the fluke segmentation mask.
VISAPP 2022 - 17th International Conference on Computer Vision Theory and Applications
960
Then in the third step, precise segmentation of
flukes can be performed by an image processing
approach called GrabCut. The mask created in the
second step is utilized to roughly indicate whether an
area is included in foreground or background during
the GrabCut process. Without the mask, GrabCut
makes some mistakes in segmentation when the
middle of the fluke is submerged, or when a
background wave appears like a structure, as shown
in Fig. 5. A GrabCut with a mask image generated by
U-net successfully performs segmentation in better
clarity when compared with those of a GrabCut
without the mask.
Figure 5: Segmentation by GrabCut with/without mask.
3.2 Feature Extraction
Two different feature extraction methods of the fluke
are proposed. One treats whole fluke area and the
other the trailing edge only.
3.2.1 Features in Black and White Patterns
As shown in Fig. 1, the tail of a whale is basically
dark grey. However, many whales have black and
white patterns on the ventral side. Approximately
65% of the whales in our dataset have such a black
and white pattern. There are two types of black and
white patterns: One is a large, dull mottled pattern
that covers at least ten percent of the fluke, and the
other is a small, relatively clear pattern, such as a
linear scar or a roundish trace of barnacles. Of these,
the latter is conspicuous, so it is useful for identifying
whales with the human eye. It is also valuable in that
it can be used even if only part of the fluke is visible.
On the other hand, these small patterns sometimes
change over time and, in some cases, enlarge with
age. In addition, since the shape of the tail is complex
and flexible, the relative position of the patterns,
which is very important information for identification
by human eyes, varies drastically from photograph to
photograph, even for the same whale, as shown in
Fig. 6. The upper photograph shows a fluke at a more
upright angle, in better focus. However, the whale
capriciously bent the left edge of its fluke. Then the
relative position of the four small black round
patterns looks different in the two photographs, as do
each of the individual shapes. Changes in shape and
position like this cause is major problems in
extracting features by image processing.
Figure 6: Small group of patterns of the same whale that
appears different from different angles and positions.
We then focused on the relatively large black and
white patterns, which are very different from artificial
patterns. They are too unclear for us to obtain precise
graphical information such as size, length, direction,
or edge, as shown in Fig. 7. Therefore, edge-
detection-based image processing methods for the
large black and white patterns are not as practical as
they are for artificial patterns.
Figure 7: Large area black and white pattern. The pattern is
too unclear to extract precise graphical information.
We modified Mizroch’s approach, which divides
a fluke into 14 complex areas and determines each
area as black or white. In our way the tail was simply
divided into six patches by dividing the horizontal
length by one-sixth. Instead of determining whether
each patch is white or black, each patch was
characterized using the bag-of-features (BoF) method.
Identification of over One Thousand Individual Wild Humpback Whales using Fluke Photos
961
BoF is a method, analogous to ‘bag of words’,
which is used in natural language processing. A
sentence is characterized by the categories of words it
contains and the number of words in each category.
To adapt it to image processing, ‘word’ is replaced by
a key point extracted by feature point extraction
methods, for example ‘SIFT’ (Lowe, 2004), or
‘AKAZE’ (Alcantarillaand, 2013). Figure 8 shows
how the concrete process of feature extraction for a
fluke using BoF. First, all the key points extracted
from 2,301 photographs that have qualified as good
quality are classified into 15 classes using K-means.
Then we counted the number of key points in each
class for each patch of the target whale. Fifteen sets
of numbers for each of the six patches were defined
as the features of the photograph. The key point
consisted of 1 x 128 elements.
3.2.2 Features in the Trailing Edge
In our dataset, over 35% of the whales have no
pattern, so we cannot extract features using a black
and white pattern. Feature extraction was thus
performed using the shape of the trailing edge, as
described in Katonas (1979) and Jablons (2016).
These whale researchers used the edge of the fluke,
called the trailing edge, as one identifier. There are
large curves and fine jagged edges along the trailing
edge, as shown in Fig. 1. Both of them are shaped like
waves, but, they are not periodic structures. In
addition, some of them have large notches caused by
injury.
Figure 8: Feature extraction from black and white pattern
by the ‘Bag-of-Features’ with six patches in a fluke.
The (x, y) coordinates of the trailing edge are
extracted by using binarization. We attempted curve
fitting by polynomial approximation and Fourier
series expansion, but we did not find enough
coincidence among those photographs of the same
whale. Therefore, we propose using wavelet
transform as a base method of feature extraction of
the trailing edge. Wavelet transform can capture
important features in images with curves well,
especially specific information such as sharp edges
and corners, and express them succinctly
(Moghaddam, 2005). The wavelet transform is shown
in the formula:
𝑤
𝑎,𝑏
𝑎
𝑓𝑥𝜓
,
𝑥𝑑𝑥
In general it uses a certain pulse waveform such
as a Step or Gaussian as mother function Ψ to acquire
the correlation strength, while sweeping the position
and the pulse width of the mother function Ψ. The
results are visualized by a two-dimensional plot.
The difference between wavelet transform
retrieved from photographs of the same whale and a
different whale are shown in Fig. 9 as an example of
a typical case. First, we divided the trailing edge into
a right side and a left side at the centre, which we
defined as the lowest point in the middle of the fluke.
For each side, the coordinates of the edge curve were
obtained, as shown in Fig. 9. Then the wavelet
transform was performed on this curve using the
Mexican hat function, shown in the formula below as
a mother wavelet function.
ψ
x
2
√
3
𝜋
1𝑥
𝑒
The result is shown at the bottom of Fig. 9. There are
300 x 19 plots for each half of a fluke as the extracted
feature. The horizontal axis represents the centre
position of the mother wavelet’s pulse, the vertical
axis represents the pulse width, and the dark black
plot indicates strong correlation. The bottom of Fig. 9
shows a fine jagged shape along the whole edge and
large dents at both ends. The 2D plots show
differences between those of the same whale and the
other whale.
3.3 Identification
Using the features extracted in Section 3.2, the
identified whales are registered in a ledger. All the
registered whales have at least one photograph. For
each photograph, there are two groups of extracted
features, BoF and wavelet transform, as described in
Sec. 3.2. There are six features of BoF for six parts of
a fluke and two feature vectors of wavelet transform
of the left and right parts of the trailing edge. Some
VISAPP 2022 - 17th International Conference on Computer Vision Theory and Applications
962
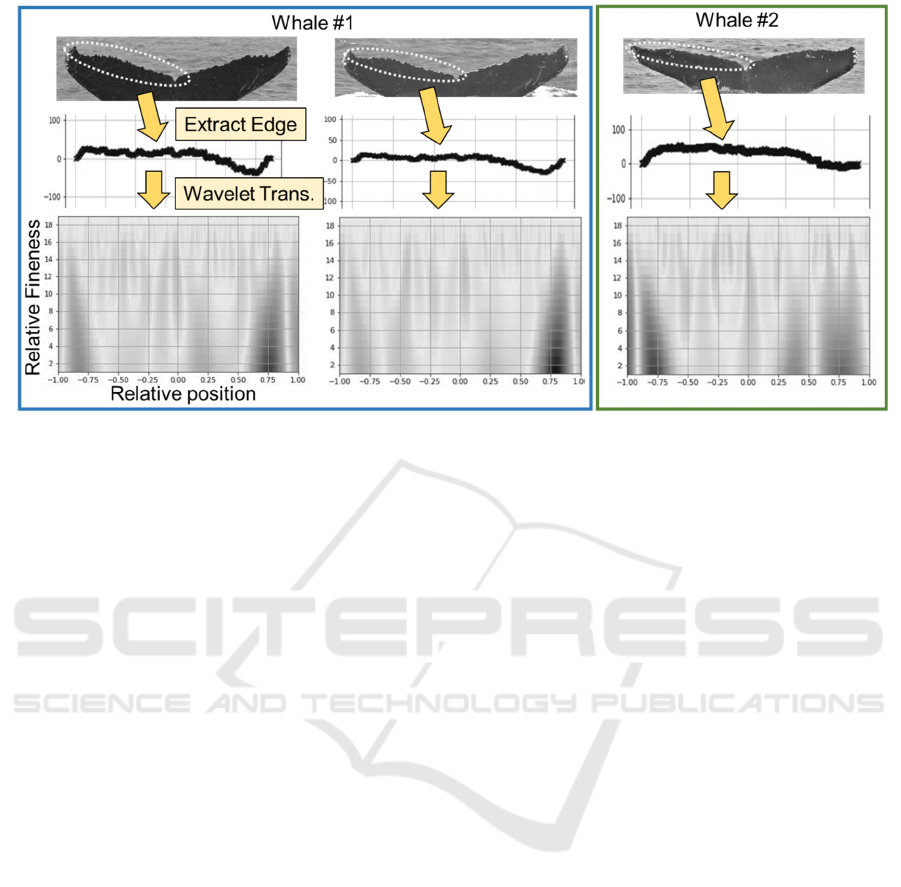
Figure 9: Feature extraction from jagged trailing edge using wavelet transform.
photographs are not equipped with all eight elements,
because feature extraction may not be possible when
the fluke is on too much of an incline, is behind water
or strongly bent, or the front is not showing.
Therefore, if a photograph to be identified and the
ledger of the same whale do not have the same
elemental feature, the identification fails. For
example, if the photograph to be identified only
shows the left side of the fluke while the ledger of the
same whale only shows the right side of the fluke, the
whale cannot be listed even if the photograph is of
exactly the same whale.
The identification process is performed separately
for the features of the BoF and wavelet transform. As
for the BoF method, the distance between the feature
vectors obtained from the photo to be identified and the
ledger are calculated for each of the six patches. Then
they are summed with appropriate weights as a base of
similarity score. As for the wavelet transform method,
vector distance is also calculated for both the left half
and the right half, but it is not summed up because not
all the photos have both a left and a right side. Then the
highest score among them is utilized as a representative
similarity score of the candidate whale in the ledger.
Finally, three lists are created, ranked by BoF, wavelet
transfer, and a combination of the two.
4 EVALUATION
Among the 10,000 photos in our possession, there are
5,891 digitalized photographs of 1,564 whales taken
from 2007 to 2015. First the entire data set was
examined in terms of the number of photographs per
individual whale, as shown in Fig. 10. About 30% of
the whales have only a single photograph, and about
70% have fewer than four. The ledger is created using
5,724 photos with all the feature vectors extracted in
advance. Then photographs taken in 2016 are used to
evaluate the proposed identification system. The
identification process and the results expressed in
numbers are shown in Fig. 11. Among the 475
photographs of 2016, 458 qualified for the
identification process. The remaining 31 were
excluded because only part of the fluke is visible. We
define the word ‘coverage’ as the percentage of
photographs among all those available that can be
analyzed by this systems. Thus the coverage is 96%.
Among them, 135 photographs are of whales without
ledgers, that is, ‘new individuals’. We excluded them
from the following evaluation. Excluding those 135
photographs, the remaining 323 were subject to
examining the accuracy of the system. Among them,
for 246 photographs the correct whales are ranked at
the top. We term this as ‘accuracy’, and here the
accuracy was 76%. As well, among the 323
photographs, for 288 photographs the correct whales
are listed within the top 30. We call this the ‘list-up
rate’, and here it was 89%.
By using deep learning as pre-processing of the
image processing method, the coverage indicating
how many of the provided photos will be subject to
analysis improves from 89.0% to 96.4%. This
includes the improvement of covering photographs in
which the middle of the fluke is submerged in water,
as shown in Fig. 5. The improvement in numbers is
low because our dataset consists of photographs pre-
Identification of over One Thousand Individual Wild Humpback Whales using Fluke Photos
963
selected by whale researchers. Nonetheless, it is
effective to use deep learning that can make flexible
judgments on the complexity and flexibility of shapes
and patterns of marine life photos.
Figure 12 shows how many photographs are in
each rank, from 1st to 30th. Our proposal has made it
possible to identify whales very accurately on the top
of the list for about 76% of the pictures. However, the
remaining 24% have been placed in various ranks
without regard to any particular tendency.
Investigating individual cases where the
identification did not precisely indicate the correct
whale as a top candidate, we found a few patterns that
result in identification error. In many cases, the
photograph of the object to be identified and the
photograph in the ledger differed in the shooting
angle of the fluke, and the way the tail stands out of
the water. For example, all the photos in the ledger
are of tails, taken upright from the front, but a photo
to be identified might be from the right side, where
the tail is inclined just before diving into the water.
This is because the shape of a fluke is very complex,
as shown in Fig. 1. Thus the trailing edge taken in the
photograph differs by shooting angle and the angle of
the fluke. Another pattern of identification error
results from the small halation at the edge preventing
extraction of graphical information of the trailing
edge. Photographs in poor focus are also
inappropriate for extracting accurate graphical
information.
Because our identification does not include ‘new
individual’ as a candidate, the list coverage is very
important. There are 10-30% of unregistered ‘new
individuals’ discovered every year. If the list
coverage is 100%, when a target whale is not matched
with all the whales listed, the whale researcher can
identify it as a ‘new individual’ without further
identification. However, if the list coverage is less
than 100%, the researcher must manually examine all
the rest in the ledger, 1,850 registered whales.
Figure 10: Distribution of number of photos per whale.
Figure 11: Test coverage and accuracy evaluation.
The list coverage and the accuracy can both be
increased by having various types of photos in the
ledger. The list coverage for the photographs in which
the correct whale has one to four photos in the ledger
is 78%, while those with five to eight photos is 99%.
Also, the accuracy for those with one to four photos
is 64%, while for those with five to eight photos it is
89%. However, this does not indicate that the list
coverage and the accuracy directly depend on the
number of photos in the ledger. The varying
conditions of the photos tend to be included with the
increase in number of the ledger photos in general. As
a result, a variety of photographs to be identified can
be matched under any photo-shooting conditions.
5 FEATURE EXTRACTION
COMPARISON
We compared the two feature extraction methods
described in Section 3.2. The methods used are BoF
for the whole fluke area, and wavelet transform for
the trailing edge only. The number of photographs
ranked from 1st to 30th and out of 30 for each method
is shown in Fig. 13 and 14, respectively. It is clear
that only the BoF method is unsuccessful for
identification. We found that the number of feature
points is very small for those patches with a nearly
all-black or a nearly all-white pattern. It makes no
difference whether the pattern is white-based or
black-based, because the feature points are exactly
the same in a black-and-white photograph or its
inverted version. Those two points explain why the
BoF method does not work well.
VISAPP 2022 - 17th International Conference on Computer Vision Theory and Applications
964
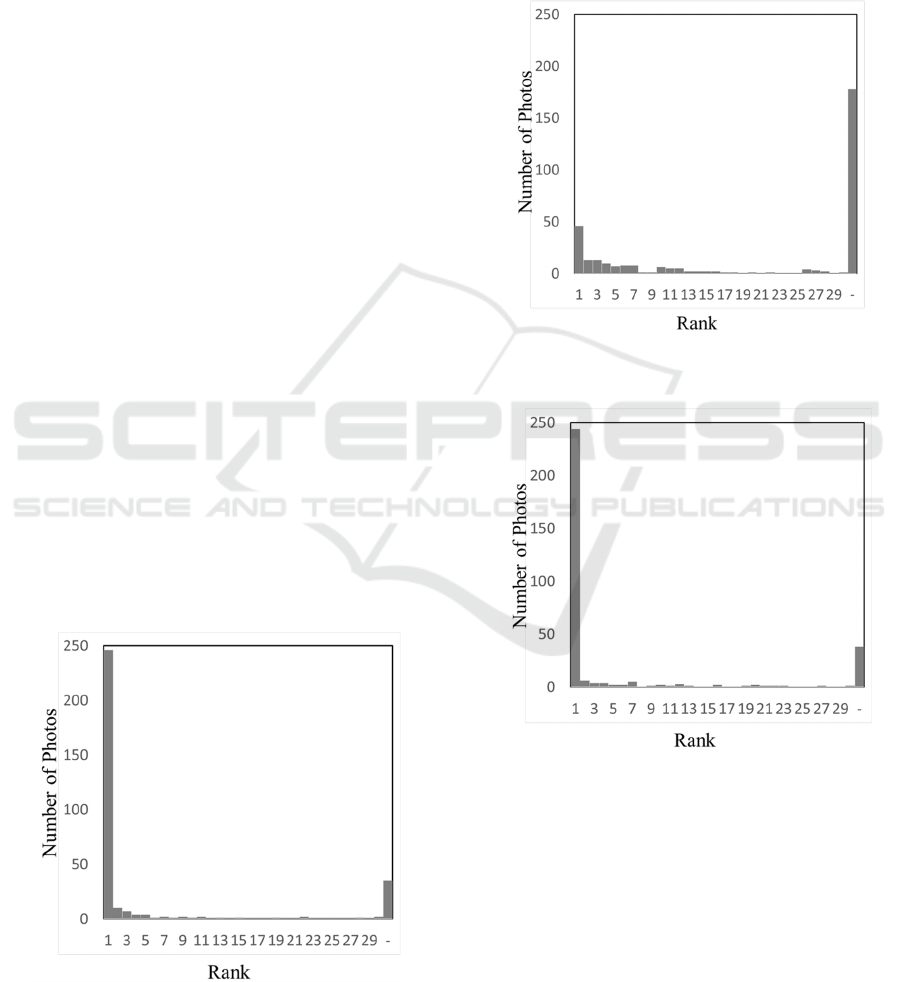
Identification using the trailing edge, however,
works very well. It is amazing that we are able to
identify more than 1,000 whales with the curve shown
in the middle of Fig. 9 alone. Even so, as mentioned
above, the shape of the edge changes greatly
depending on the movement of the whale and the
shooting angle. In addition, the extraction of the
trailing edge curve must be performed precisely. The
2-step segmentation of mask-creation by deep
learning and segmentation by GrabCut is highly
effective for this purpose, as mentioned in Section
3.1.
6 FUTURE WORKS
So far, we have been unable to identify “new
individuals” when photos show a whale that is not
registered in the ledger. This is because similarity
scores are not accurate enough to determine whether
a whale is new or not. The score is greatly affected by
how the fluke appears in a photograph (i.e.,
depending on the weather conditions or the whale’s
position in the photo). For example, a photograph
with an unclear focus shows low scores for all the
photos of whales, even photos of the same whale. A
whale can be identified by rank, that is, by relative
score. However, the absolute score might be low.
We believe that it is necessary to quantify how
similarity scores vary depending on the photography
conditions and the whale’s position in the photo.
However, it is quite difficult to evaluate the relation
using only wild whale photographs because they do
not meet the various requirements for quantitative
evaluation using various metrics.
Figure 12: Number of photographs ranked from 1
st
to 30
th
using both methods.
One idea for future work is to create a 3D
Computer Graphic (CG) model of a real fluke that
will enable fluke flexibility and photography from a
variety of angles. Then we would be able to precisely
evaluate how much similarity scores are affected by
those conditions, which, in turn, would enable us to
make them enough accurate to identify “new
individuals”.
Figure 13: Number of photographs ranked from 1
st
to 30
th
using black and white patterns.
Figure 14: Number of photographs ranked from 1
st
to 30
th
using the trailing edge.
7 CONCLUSIONS
As whales are wild marine fauna, identification of
individuals using photographs of the fluke is
necessary for their investigation and conservation.
However, the following problems have arisen: Since
there are few opportunities to shoot from the front
when the tail is upright, the number of photos per
Identification of over One Thousand Individual Wild Humpback Whales using Fluke Photos
965

whale is low. Even in our relatively good dataset,
about 30% of the whales have only a single
photograph, and 70% have fewer than four. Also,
because the 3D shape of a fluke is complex, if the
shooting angle is off or the tail is tilted, the shape will
change significantly in the photograph. Furthermore,
the tail is flexible and changes to its shape greatly
depend on how the whale’s power is applied. In terms
of the black and white pattern on the fluke, it can be
highly unclear, and the image will change
considerably depending on how wet the fluke is and
how the sun is shining on it. Therefore, the following
method was proposed: First, pre-processing was
performed using deep learning for treating the
uncertainty of shape and pattern of the fluke.
Identification was then performed using precise
image processing methods that are thought to be
tolerant compared to other image processing
methods. The first method is to extract features of
large black and white patterns using BoF. The other
method is to extract features from the trailing edge
using wavelet transform. Then the score was
calculated by combining the results of both methods
and ranking each photograph subjected to
identification. As a result, 76% were correctly ranked
in 1st place, and 89% were ranked within 1st to 30th
place.
This result shows that these are very useful tools
for whale researchers in identifying whales using
fluke photographs. Although each algorithm is not
new, we have shown that it is possible to identify
whales well by combining them well.
ACKNOWLEDGEMENTS
We express our gratitude to the captains of the
research vessels K. Toyama, Y. Taira, H. Miyahira,
K. Miyahira and Y. Miyamura, as well as S. Uchida,
N. Higashi, K. Tamura, K. Tomiyama, and G.
Matsumoto and all the other humpback whale
research staff of the Churashima Foundation and
Churaumi Aquarium, Okinawa Japan. We also thank
Kurupari Mistry, Tadashi Shinkawa, and Tomonori
Hayami for helping in data processing, and Sadao Ishi,
Tomoko Yamamoto, Shinich Uratani Yasuhiro
Watashiba, and Yoshiyuki Kido for the helpful
discussions.
REFERENCES
Alcantarilla, P.F., Nuevo, J., Bartoli, A. 2013. Fast explicit
diffusion for accelerated features in nonlinear scale
spaces in BMVC 2013 - Electronic Proceedings of the
British Machine Vision Conference
Bogucki, R., Cygan, M., Khan, C. B., Klimek, M., Milczek,
J. K., Mucha, M. 2019. Applying deep learning to right
whale photo identification. In Conservation Biology
33(3) 676-684
Dawbin, W. H., 1966. The seasonal migratory cycle of
humpback whales. In Norris, K. S. (edded.) Whales
Dolphins, and Porpoises, Berkeley: University of
California Press: 145-170
Friday, N., Smith, T. D., Stevick, P. T., Allen, J. 2000.
Measurement of Photographic Quality and Individual
Distinctiveness for the Photographic Identification of
Humpback Whales, Megaptera Novaeangliae in
Marine Mammal Science 16(2) 355-374
Jablons, J. 2016. Identifying humpback whale flukes by
sequence matching of trailing edge curvature. In Thesis
for Rensselaer Polytechnic Institute. ProQuest
Dissertations Publishing
Kaggle. Humpback Whale Identification: Can you identify
a whale by its tail? https://www.kaggle.com/c/
humpback-whale-identification/overview/description,
2019. Accessed: 2019-12-18
Katona S., Baxter B., Brazier O., Kraus S., Perkins J.,
Whitehead H. 1979. Identification of Humpback
Whales by Fluke Photographs. In Winn H.E., Olla B.L.
(eds) Behavior of Marine Animals. Springer, Boston,
MA
Kobayashi, N., Okabe, H., Kawazu, I., Higashi, N.,
Miyahara, H., Kato, H., Uchida, S. 2016. Peak Mating
and Breeding Period of the Humpback Whale-
(Megaptera novaeangliae) in Okinawa Island, Japan. In
Open Journal of Animal Sciences 6(3)
Lowe, D. G. 2004. Distinctive Image Features from Scale-
Invariant KeypointsKey points. In International
Journal of Computer Vision 60, 91-110
Moghaddam, H. A., Khajoie, T. T., Rouhi, A. H., Tarzjan,
M. S. 2005. Wavelet correlogram: A new approach for
image indexing and retrieval, in Pattern Recognition
38(12) 2506-2518
Nowak E., Jurie F., Triggs B. 2006. Sampling Strategies for
Bag-of-Features Image Classification. In: Leonardis A.,
Bischof H., Pinz A. (eds) Computer Vision – ECCV
2006. ECCV 2006. Lecture Notes in Computer Science,
vol 3954. Springer, Berlin, Heidelberg.
Redmon, J., Divvala, S., Girshick, R. 2016. You Only Look
Once: Unified, Real-Time Object Detection In
Proceedings of the IEEE Conference on Computer
Vision and Pattern Recognition (CVPR), 779-788
Ronneberger, O. Fischer, P., Brox, T. 2015. U-Net:
Convolutional Networks for Biomedical Image
Segmentation. In Medical Image Computing and
Computer-Assisted Intervention – MICCAI 2015 234-
241
Simoes, H. F., Meidanis, J. 2020. Humpback Whale
Identification Challenge: An Overview of the Top
Solutions, https://www.ic.unicamp.br/~meidanis/PUB/
IC/2019-Simoes/HWIC.pdf
Tang, M., Gorelick, L., Veksler, O., Boykov; Y., 2013.
GrabCut in One Cut. in Proceedings of the IEEE
VISAPP 2022 - 17th International Conference on Computer Vision Theory and Applications
966

International Conference on Computer Vision
(ICCV2013), 1769-1776
Titova, O. V., Filatova, O. A., Fedutin, I. D., Ovsyanikova,
E. N., Okabe, H., Kobayashi, N., Acebes, J. M. V.,
Burdin, A. M., Hoyt, E. 2018. Photo-identification
matches of humpback whales (Megaptera
novaeangliae) from feeding areas in Russian Far East
seas and breeding grounds in the North Pacific. In
Marine Mammal Science 34(1) 100-112
Uchida, S. 1997. Surveys of cetaceans in the Japanese
waters. In Uchida, S. (eds), Kings of the Sea: Humpback
Whales: A 1991-1995 Survey of Cetaceans in the
Japanese Waters 18-25. The UFJ Environment
Foundation.
Identification of over One Thousand Individual Wild Humpback Whales using Fluke Photos
967
