
Classification Models for Predicting Inflammatory Bowel Disease
Healthcare Utilization
Dmitriy Babichenko
1 a
, Behnam Rahdari
1 b
, Ben Stein
1
, Suraj Subramanian
1
,
Claudia Ramos Rivers
2
, Gong Tang
3
and David Binion
2
1
School of Computing and Information, University of Pittsburgh, Pittsburgh, PA, U.S.A.
2
School of Public Health, University of Pittsburgh, Pittsburgh, PA, U.S.A.
3
School of Medicine, University of Pittsburgh, Pittsburgh, PA, U.S.A.
Keywords:
Inflammatory Bowel Disease, Healthcare Utilization, Machine Learning, Classification, Deep Learning,
Clinical Decision Support Systems.
Abstract:
Objective. Inflammatory Bowel Disorders (IBD) is a group of gastric disorders that include well-known
maladies such as Crohn’s disease and Ulcerative Colitis (UC), as well as a number of other gastric disorders
that are not well classified. Subgroups of patients contribute disproportionately to treatment costs. This work
aims to create and evaluate machine learning models designed to use demographic and clinical predictors of
IBD to predict which patients would fall into the “high healthcare utilization” category.
Materials and Methods. A series of machine learning models were trained on a dataset extracted from a
prospective natural history registry from a tertiary IBD center and associated healthcare charges. The models
were trained to predict which patients are likely to have the highest healthcare utilization charges (top 15%).
Results. A gradient-boosted trees classification model (accuracy 0.898, AUC 0.748) performed best out of the
12 evaluated modeling approaches.
Conclusion. Classification models such as the ones evaluated in this work provide a reasonable basis for a
clinical decision support system designed to predict which IBD patients are likely to become high expenditure.
1 INTRODUCTION
Inflammatory Bowel Disorders (IBD) is a group of
gastric disorders that include well-known maladies
such as Crohn‘s Disease and Ulcerative Colitis (UC),
as well as a number of other gastric disorders that
are not well classified. According to the Center
for Disease Control (CDC), “IBD is one of the five
most prevalent gastrointestinal disease burdens in the
United States, with an overall healthcare cost of more
than $1.7 billion”. Currently, there is no medical
cure and IBD patients commonly require a lifetime
of care. In the United States, IBD accounts for more
than 700,000 physician visits, 100,000 hospitaliza-
tions, and disability in 119,000 patients (CDC 2014).
IBD patients most often receive care in physi-
cians‘ offices or other outpatient sites, with hospital-
ization required only for severe disease presentation,
to treat certain complications, and for surgery.
a
https://orcid.org/0000-0003-1187-6684
b
https://orcid.org/0000-0001-6514-912X
In recent decades the prevalence of IBD and
the associated treatment costs have risen dramati-
cally (Kappelman et al., 2008; Molodecky et al.,
2012; Kappelman et al., 2013). In 2004, there were
1.1 million ambulatory care visits and 1.8 million
prescriptions written for medications to treat Crohn’s
disease and 716,000 ambulatory care visits and 2.1
million prescriptions written for medications to treat
UC (Everhart, 2008).
The hospitalization rate also increased signifi-
cantly during this period from 44.2 to 59.7 per
100,000 population, with the mean hospitalization
costs of $11,345 for Crohn’s disease and $13,412 for
ulcerative colitis (Kappelman et al., 2008; Molodecky
et al., 2012; Kappelman et al., 2013).
A number of research efforts have produced ma-
chine learning (ML) models to predict remission in
Crohn’s patients (Waljee et al., 2019), patients’ re-
sponse to drug therapies (Waljee et al., 2010), and
assess IBD risk (Wei et al., 2013). Other studies
relied on classical statistical approaches to identify
that a subgroup of IBD patients exhibit “high preva-
154
Babichenko, D., Rahdari, B., Stein, B., Subramanian, S., Rivers, C., Tang, G. and Binion, D.
Classification Models for Predicting Inflammatory Bowel Disease Healthcare Utilization.
DOI: 10.5220/0010852100003123
In Proceedings of the 15th International Joint Conference on Biomedical Engineering Systems and Technologies (BIOSTEC 2022) - Volume 5: HEALTHINF, pages 154-161
ISBN: 978-989-758-552-4; ISSN: 2184-4305
Copyright
c
2022 by SCITEPRESS – Science and Technology Publications, Lda. All rights reserved

lence of depression, anxiety, and chronic pain” and
that these comorbidities are ultimately responsible
for high healthcare-related expenditures (Click et al.,
2016; Mikocka-Walus et al., 2008; Filipovic and Fil-
ipovic, 2014).
However, to the best of our knowledge, no work
has been done in creating ML models that classify
IBD patients as high or low healthcare utilizers, nor
has there been work in leveraging ML methods to
identify best predictors of high healthcare utilization
in IBD patients.
In developing ML models described in this paper,
we explored 2019 and 2020 work of Morid, et. al. on
healthcare cost prediction (Morid et al., 2019; Morid
et al., 2020), as well as Morid, et. al. 2017 litera-
ture review of supervised ML methods for predicting
healthcare costs (Morid et al., 2017). We attempted
to replicate the Morid, at. al.’s work on predicting pa-
tients’ healthcare utilization from patient multivariate
time series data using convolutional neural networks
(CNN) (Morid et al., 2020), long short-term memory
neural networks (LSTM), and gated recurrent units
neural networks (GRU), but due to the idiosyncrasies
of our data and due to a high number of missing val-
ues (described in subsection 2.2.3), we were unable
to reach the level of model performance described by
the authors.
The purpose of the work presented in this paper is
to develop classification ML models that would aid in
rapid identification of patients who are likely to be-
come healthcare super-utilizers (Emeche, 2015) and
to allow healthcare providers to offer focused treat-
ment to these patients to ultimately reduce financial
burden.
2 MATERIALS AND METHODS
2.1 The Data
The data used in this study was obtained from a natu-
ral history research registry of prospectively recruited
IBD patients at a tertiary care center. At the time
of this study, the registry contained demographic and
clinical information for 3143 adult patients (age >
18) who were seen in the outpatient setting between
2009 and 2017 (Anderson et al., 2016). In order
to ensure that all patients’ treatment trajectories con-
tained longitudinal data, this study only included pa-
tients that had data for three or more years of contin-
uous care within the University of Pittsburgh Medi-
cal Center (UPMC) hospital system. The final dataset
used in this study contained 2915 patient records.
The use of this data was approved by the Univer-
sity of Pittsburgh Institutional Review Board (IRB):
STUDY19070426: Utilizing clinical metadata to pre-
dict high-cost complications and treatment response
in IBD: development of clinical decision support tools
STUDY19060285: UPMC Center for Inflammatory
Bowel Disease (IBD) Research Registry
2.2 Feature Selection and
Pre-processing
In our initial modeling efforts we relied on demo-
graphic and clinical predictors of high healthcare uti-
lization in IBD patients identified and described by
Click, et. al. in their 2016 work (Click et al., 2016).”
More specifically, such predictors as gender, marital
status, employment status, age, distance traveled to
an IBD care center, medications prescribed, labora-
tory test results, clinical encounters, and psychiatric
comorbidities were considered for all classification
models.
2.2.1 Demographic and Social History
Predictors
Gender. Even though previous studies did not iden-
tify gender as a predictor of high healthcare utiliza-
tion and while IBD affects men and women equally,
most North American studies show that UC is more
common in men than in women. In addition, men are
more likely than women to be diagnosed with UC in
their 50’s and 60’s (Loftus et al., 2007). Given these
considerations, gender was included as a feature in all
the models described in this paper.
Marital Status. The original marital status values
from the registry dataset contained labels for “mar-
ried”, “single”, “divorced”, “widowed”, “unknown”,
“legally separated”, and “significant other”. Our ini-
tial modeling efforts indicated that, for example, “sin-
gle”, “divorced”, “widowed”, and “legally separated”
labels all had the same effect on each model’s output.
To simplify model training and to reduce noise in the
data, the original marital status categories were com-
bined into “married”, “single”, and “unknown”.
Employment Status. Similarly to the marital sta-
tus feature, the original employment status categories
were combined into “employed”, “not employed”,
“student”, “unknown”.
Age. Patient’s age during the last year of recorded
treatment
Proximity (distance) to IBD Care Center. Distance
between each patient’s home address zip code and a
corresponding IBD care center’s zip code was calcu-
lated using an open-source Python zipcode distance
Classification Models for Predicting Inflammatory Bowel Disease Healthcare Utilization
155

calculator (Hulett, 2013).
Tobacco Use. “Yes” if a patient indicated tobacco
use at any time during the treatment period, otherwise
“No”.
2.2.2 Clinical Predictors
Prescription Drugs. The following categories of
prescription drugs were selected for the dataset: (1)
5 ASA, (2) antibiotics, (3) anti-IL 12, (4) anti-
Integrin, (5) anti-TNF, immunomodulators, (6) sys-
temic steroids. The prescription data was represented
in terms of the annual average consumption of each
class of drugs (average number of times a drug was
prescribed), and the duration of consumption in years.
Laboratory Test Results. The following cate-
gories of laboratory test results were selected for
the dataset: (1) eosinophils (EOS) (Click et al.,
2017), (2) monocytes (Cherfane et al., 2016),
(3) albumin (Koutroubakis et al., 2015b), (4)
hemoglobin (Koutroubakis et al., 2016), (5) erythro-
cyte sedimentation rate (ESR), (6) c-reactive Protein
(CRP), and (7) vitamin D (Kabbani et al., 2016) were
selected for the model’s features. For each laboratory
test, three values were generated - a mean value, a
minimum value, and a maximum value over the treat-
ment period of interest.
Clinical Encounters. The following categories of
clinical encounters were selected for the dataset:
• The number of office visits
• The number of outpatient procedures
• The number of telephone + email encounters
• The number of emergency department (ED) visits
• The number of hospitalizations.
Each clinical encounter category was represented
with each patient’s average number of annual encoun-
ters (Ramos-Rivers et al., 2014).
Psychiatric Comorbidities. Psychiatric comorbidi-
ties were identified using ICD-10 codes F00 - F99
for mental, behavioral and neurodevelopmental disor-
ders (icd, 2019), excluding code F17 (nicotine depen-
dence) (nic, 2019). Psychiatric comorbidities were
represented as a binary value - one (1) for presence
and zero (0) for absence of psychiatric comorbidities.
Average Annual Charges. In addition to demo-
graphic and clinical data, financial charges data
for both inpatient and outpatient healthcare service
charges were obtained for each patient. The charges
were inflated (in US dollars) to their 2018 equivalent
using Consumer Price Index adjustment rates calcu-
lator
1
. The charges related to non-IBD-related treat-
1
Consumer Price Index Inflation Calculator: https://
www.bls.gov/data/inflation calculator.htm
ments, such as non-IBD-related surgeries (e.g. knee
replacement) or cancer treatments, were excluded
from total charges calculations. As the primary pur-
pose of the models described in this paper was to iden-
tify patients with the top 15% of the highest treatment
charges (Click et al., 2016; Mandala Rayabandla,
2020), for the discrete dataset charges higher than
the 85th percentile (≥ $47,644) were categorized as
“high”, otherwise as “normal” (Bhagya Rao et al.,
2016).
2.2.3 Missing Values
Some of the laboratory test results features were
missing as many as 30% of their values. To im-
pute the missing data points, we compared three
data imputation approaches - Multiple Imputation
by Chained Equations (MICE) with Random For-
est (Shah et al., 2014), Bayesian Ridge Regression
multivariate feature imputation (BRRMFI), and Ran-
dom Forest multivariate feature imputation (RFMFI).
MICE imputation was implemented using the mice-
forest open-source Python package. Both BRRMFI
and RFMFI were implemented using the sklearn It-
erativeImputer experimental feature. We specifically
selected Bayesian Ridge (BR) instead of other pos-
sible linear regressors because Bayesian regression
tends to perform better in situations where the data is
either insufficient or poorly distributed; instead of es-
timating a single value for a missing value, BR draws
it from a probability distribution.
For all three imputation techniques, we executed
10 iterations for each imputation (Raghunathan et al.,
2002). In order to select the best-performing impu-
tation approach, we used a subset of the data with
no missing values. We generated missing values by
randomly removing 30% of values from each labo-
ratory test result feature. After imputing the values
with all three techniques, we compared imputed val-
ues with the original values (Table 1). As RFMFI out-
performed the other two imputation techniques, we
used RFMFI for imputing missing values in the mas-
ter dataset.
Table 1: Comparison of imputation accuracy between
MICE, BRRMFI, and RFMFI.
Imputation Technique Accuracy RMSE
MICE 57.3% 0.71
BRRMFI 59.7% 0.59
RFMFI 68.5% 0.37
HEALTHINF 2022 - 15th International Conference on Health Informatics
156
2.2.4 Label Encoding and Feature Scaling for
Categorical Variables
All categorical variables such as gender, marital sta-
tus, employment status, tobacco use, and psychiatric
comorbidities were converted to numerical values us-
ing Python sklearn library’s LabelEncoder function.
To avoid biased weight distribution of variables while
training classification models, all categorical vari-
ables were scaled between the range of 0 and 1 using
the sklearn library’s MinMaxScaler function.
2.2.5 Generated Datasets
The dataset described in previous sections (master
dataset) has different numbers of years of continuous
treatment for different patients, ranging from three
years to 8 years per given patient. In other words, pa-
tients who have been treated longer have more data,
and we were concerned that this would create bias in
models’ predictions. To better understand how the
“uneven” number of years of treatments would af-
fect the models, two more datasets were generated
for comparison. The first of these datasets was based
on the aggregate data from the first three continu-
ous years of each patient’s treatment (three-year static
dataset). The second dataset used a rolling three-year
window to predict outcomes in the fourth year. In
other words, the predictors were aggregated from the
first three years of each patient’s data, and the out-
come (the response variable) was from the fourth year
(Figure 1).
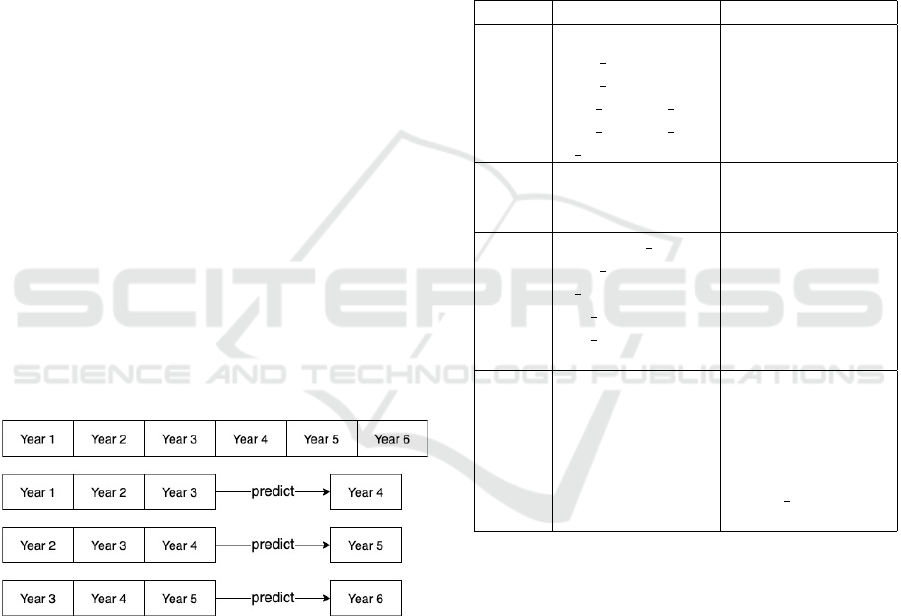
Figure 1: Illustration of generating a three-year rolling win-
dow dataset where aggregate data from three continuous
years of treatment is used to predict outcomes in the fourth
year of treatment.
2.3 Machine Learning Models
A total of twelve ML models were trained and vali-
dated, with four models trained and validated using
each of the three datasets described in Section 2.2
(Feature Selection and Preprocessing). These mod-
els were trained using Random Forest (RF), Support
Vector Machine (SVM) with a linear kernel, Gradi-
ent Boosted Trees (GBT) (Lim et al., 2000; King
et al., 1995), and a feedforward artificial neural net-
work (ANN).
Random Forest (RF), SVM, and GBT models
were trained using the scikit-learn machine learn-
ing library in Python. The ANN was trained us-
ing the TensorFlow Keras framework’s Sequential
class and cross-validated using the scikit-learn library.
All models’ hyperparameters were tuned using grid
search - the hyperparameters used in the final models
are shown in Table‘2.
Table 2: Hyperparameters used to train the RandomForest,
SVM, and GBT models.
Model Parameter Value
RF
bootstrap True
max depth 60
max features 3
min samples leaf 5
min samples split 10
n estimators 100
SVM
C 10
gamma 0.001
kernel rbf
GBT
colsample bytree 0.8
max depth 20
n estimators 400
reg alpha 1.3
reg lambda 1.5
subsample 0.8
ANN
number of layers 3
epochs 32
batch size 64
activation model 1:relu, 2:relu,
3:sigmoid
loss function binary crossentropy
optimizer adam
All models were trained to predict if a patient’s av-
erage annual charge is higher or lower than $47644.00
(85th percentile).
All models were validated using 10-fold cross-
validation; cross-validated accuracy scores and AUC
(area under receiver operating characteristic curve
(ROC) curve) were used as metrics to identify and se-
lect best-performing classification models.
3 RESULTS
3.1 Classification Models’ Accuracy
When trained on the largest (master) dataset, the ANN
model outperformed all other models in terms of ac-
Classification Models for Predicting Inflammatory Bowel Disease Healthcare Utilization
157

Table 3: Models’ 10-fold Cross-Validated Accuracy and AUC Scores.
Master Dataset Three-Year
Static Dataset
Three-Year
Rolling Window
Dataset
Algorithm Accuracy AUC Accuracy AUC Accuracy AUC
Random Forest 0.876 0.733 0.823 0.741 0.729 0.689
Support Vector Machine (SVM) 0.867 0.671 0.799 0.602 0.626 0.591
Gradient-Boosted Trees (GBT) 0.891 0.748 0.847 0.724 0.732 0.699
Feedforward ANN 0.927 0.782 0.729 0.631 0.613 0.526
curacy and AUC, with the GBT model coming in
close second. However, as the size of the training
data decreased in the static three-year dataset and de-
creased even further in the three-year rolling window
dataset, the ANN’s accuracy and AUC dropped in
comparison with the respective GBT models.
3.2 Feature Importance Ranking
Feature importance rankings were obtained using the
“feature importance ranking feature” of the GBT XG-
Boost algorithm from 10-fold cross-validation of the
GBT model. Table 4 shows importance rankings gen-
erated by the XGBoost algorithm for each of the GBT
models trained on each of the datasets.
The average feature importance obtained over all
the estimators in the model corresponds to previously
published literature in clinical IBD research (Click
et al., 2016; Ramos-Rivers et al., 2014; Click et al.,
2015; Hashash et al., 2015; Koutroubakis et al.,
2015a). The predictions are heavily reliant on the lab-
oratory test results and clinical encounters. Certain
demographic and social factors such as employment
status and tobacco use are also discriminant in pre-
dicted patient charge. It is worth noting that as the
size of the training data decreased in the static three-
year and in the three-year rolling window datasets,
corresponding GBT models relied more on clinical
encounters rather than on laboratory test results.
4 LIMITATIONS
In discussing this work, it is important to acknowl-
edge its limitations. One of the most critical limita-
tions of constructing classification models on aggre-
gate clinical data is that they do not take into account
the temporal nature of patient treatment trajectories.
The models presented in this work are trained on data
consisting of averaged values over patients’ entire his-
tory or over the course of three years of treatment,
without consideration of how a patient’s state at a
given time slice might affect that patient’s state in the
future.
It is also important to note that IBD is an um-
brella term that covers Ulcerative Colitis (UC) and
Crohn’s disease. The datasets that we used for train-
ing ML models did not differentiate between UC and
Crohn’s patients. When we attempted to separate
UC and Crohn’s patients into different datasets, mod-
els trained on these subsets of the data performed
poorly compared to models trained on the larger par-
ent dataset (Table 5).
Last, but not least, large amounts of missing data
presented another critical challenge. Some features
of the dataset were missing as many as 30% of their
values and imputation techniques used in creation of
the models described in this paper could have inad-
vertently introduced bias.
5 DISCUSSION AND FUTURE
WORK
Assessing and building predictive models for IBD us-
ing demographic clinical data is important given the
recent rise in IBD’s prevalence in the United States.
The GBT models described in this paper performed
comparably to or better than machine learning clas-
sification models created in similar studies for other
(non-IBD) disease states (Meng et al., 2013; Perveen
et al., 2016; Sundar et al., 2012). The models’ cross-
validated classification accuracy makes them reason-
able candidates for clinical decision support systems
(DSS), where patient care providers can input (or se-
lect) parameters for a new patient and leverage the
models’ classification results to make decisions re-
garding IBD treatment choices.
As of the time of this writing, we began to develop
a web-based DSS. This system will allow clinicians
to select or input demographic and clinical parame-
ters, or import those parameters directly from an elec-
tronic medical records system (EMR) via Fast Health-
care Interoperability Resources (FHIR) application
programming interface (API). We also began work-
ing on addressing two shortcomings that are common
to some classification models. The first shortcom-
HEALTHINF 2022 - 15th International Conference on Health Informatics
158

Table 4: Top 10 predictors from the continuous dataset, ranked in terms of importance by XGBoost.
Rank Master Dataset Three-Year Static Dataset Three-Year Rolling Window
Dataset
1 Albumin Telephone encounters Hospitalizations
2 Hemoglobin Hospitalizations Telephone encounters
3 Office visits Emergency Department vis-
its
Emergency Department visits
4 Eosinophils Albumin Psychiatric comorbidities
5 Erythrocyte Sedimentation
Rate
Eosinophils Systemic steroids usage
6 Emergency Department vis-
its
Erythrocyte Sedimentation
Rate
Office visits
7 Hospitalizations Hemoglobin Hemoglobin
8 Telephone encounters Office visits Albumin
9 Psychiatric comorbidities Psychiatric comorbidities Erythrocyte Sedimentation Rate
10 Systemic steroids usage Systemic steroids usage Eosinophils
Table 5: Cross-validated accuracy scores for GBT models
trained separately on sub-cohort data of UC and Crohn’s
patients obtained from the master dataset.
Subcohort Accuracy Score AUC
CD 0.683 0.704
UC 0.722 0.689
ing, described in the “Limitations” section, is that the
models described in this paper were trained on ag-
gregate clinical data and that they do not take into
account the temporal nature of patient treatment tra-
jectories. In order to address this shortcoming, we
are exploring alternative modeling approaches, in-
cluding representing treatment trajectories with mul-
tiple chained Bayesian Network (BN) models (Bar-
clay et al., 2013), hidden Markov chains (Petersen
et al., 2018), and interval temporal BNs (Zhang et al.,
2013).
The second shortcoming of many classification
models, such as the ones produced by deep learning
algorithms, is that these models are essentially “black
boxes”. They accept certain inputs and produce an
output (a prediction) without explaining how they ar-
rived at that prediction. We are working on combin-
ing models’ predictions with patient treatment trajec-
tory visualizations [52]–[54] to provide both a predic-
tion and a visual explanation of how demographic and
clinical features contribute to a given classification.
ACKNOWLEDGMENTS
While we take full responsibility for this work, we
would like to thank the faculty and staff in the Di-
gestive Disorders Center at UPMC who made this re-
search endeavor possible. We would also like to thank
the generosity of all the patients who agreed to partic-
ipate in the IBD research registry.
Funding: (1) Framework for Smart Electronic Health
Record-Linked Predictive Models to Optimize Care
for Complex Digestive Diseases. Principal Inves-
tigator: Michael A. Dunn, MD, FACP. Funding
Agency: Department of Defense. Grant/Contract
No.: W81XWH-11-2-0133. (2) Utilizing Clinical
Metadata to Predict High-Cost Complications and
Treatment Response in IBD: Development of Clin-
ical Decision Support Tools. Principal Investigator:
David Binion MD. Funding Agency: Department of
Defense. Grant/Contract No.: W81XWH-17-1-0556
BN models used in this project were built us-
ing GeNIe Modeler and SMILE engine, a Bayesian
modeling environment developed at the Decision
Systems Laboratory, University of Pittsburgh, and
available free of charge for academic use at
http://www.bayesfusion.com/.
REFERENCES
(2019). 2019 ICD-10-CM Codes F01-F99: Mental, Behav-
ioral and Neurodevelopmental disorders.
(2019). 2019 ICD-10-CM Codes F17*: Nicotine depen-
dence.
Anderson, A. J., Click, B., Ramos-Rivers, C., Babichenko,
D., Koutroubakis, I. E., Hartman, D. J., Hashash, J. G.,
Schwartz, M., Swoger, J., Barrie, A. M., et al. (2016).
Development of an inflammatory bowel disease re-
search registry derived from observational electronic
health record data for comprehensive clinical pheno-
typing. Digestive diseases and sciences, 61(11):3236–
3245.
Barclay, L. M., Hutton, J. L., and Smith, J. Q. (2013).
Refining a bayesian network using a chain event
Classification Models for Predicting Inflammatory Bowel Disease Healthcare Utilization
159

graph. International Journal of Approximate Reason-
ing, 54(9):1300–1309.
Bhagya Rao, B., Koutroubakis, I. E., Ramos Rivers, C.,
Colombel, J. F., Regueiro, M., Swoger, J., Schwartz,
M., Baidoo, L., Hashash, J., Barrie, A., Dunn, M. A.,
and Binion, D. G. (2016). Delineation of Crohn’s Dis-
ease Trajectories Using Change in L
´
emann Index: A
Natural History Study. Journal of Clinical Gastroen-
terology, 50(6):476–482.
Cherfane, C., Anderson, A. J., Rivers, C. R., Schwartz, M.,
Barrie, A., Hashash, J. G., Regueiro, M., Dunn, M. A.,
Swoger, J., and Binion, D. G. (2016). 165 Is Monocy-
tosis a Biomarker of Severity in Inflammatory Bowel
Disease? Analysis of a 6 Year, Prospective Natural
History Registry. Gastroenterology, 150(4):S42.
Click, B., Anderson, A. M., Koutroubakis, I. E., Rivers,
C. R., Babichenko, D., Machicado, J. D., Hartman,
D. J., Hashash, J. G., Dunn, M. A., Schwartz, M.,
Swoger, J., Barrie, A., Wenzel, S. E., Regueiro, M.,
and Binion, D. G. (2017). Peripheral Eosinophilia in
Patients With Inflammatory Bowel Disease Defines an
Aggressive Disease Phenotype. The American Jour-
nal of Gastroenterology, 112(12):1849–1858.
Click, B., Ramos Rivers, C., Koutroubakis, I. E.,
Babichenko, D., Anderson, A. M., Hashash, J. G.,
Dunn, M. A., Schwartz, M., Swoger, J., Baidoo,
L., et al. (2016). Demographic and clinical predic-
tors of high healthcare use in patients with inflam-
matory bowel disease. Inflammatory bowel diseases,
22(6):1442–1449.
Click, B., Vargas, E. J., Anderson, A. M., Proksell, S.,
Koutroubakis, I. E., Ramos Rivers, C., Hashash, J. G.,
Regueiro, M., Watson, A., Dunn, M. A., Schwartz,
M., Swoger, J., Baidoo, L., Barrie, A., and Binion,
D. G. (2015). Silent Crohn’s Disease: Asymptomatic
Patients with Elevated C-reactive Protein Are at Risk
for Subsequent Hospitalization. Inflammatory Bowel
Diseases, 21(10):2254–2261.
Emeche, U. (2015). Is a Strategy Focused on Super-
Utilizers Equal to the Task of Health Care System
Transformation? Yes. The Annals of Family Medicine,
13(1):6–7.
Everhart, J. E. (2008). The Burden of Digestive Diseases in
the United States | NIDDK.
Filipovic, B. R. and Filipovic, B. F. (2014). Psychiatric co-
morbidity in the treatment of patients with inflamma-
tory bowel disease. World journal of gastroenterol-
ogy: WJG, 20(13):3552.
Hashash, J. G., Chintamaneni, P., Ramos Rivers, C. M.,
Koutroubakis, I. E., Regueiro, M. D., Baidoo, L.,
Swoger, J. M., Barrie, A., Schwartz, M., Dunn, M. A.,
and Binion, D. G. (2015). Patterns of Antibiotic Ex-
posure and Clinical Disease Activity in Inflammatory
Bowel Disease: A 4-year Prospective Study. Inflam-
matory Bowel Diseases, 21(11):2576–2582.
Hulett, C. (2013). Calculate the distance between zipcodes
by lat/long data: cmhulett/zipcode distance. original-
date: 2012-07-09T06:30:09Z.
Kabbani, T. A., Koutroubakis, I. E., Schoen, R. E., Ramos-
Rivers, C., Shah, N., Swoger, J., Regueiro, M., Barrie,
A., Schwartz, M., Hashash, J. G., Baidoo, L., Dunn,
M. A., and Binion, D. G. (2016). Association of Vi-
tamin D Level With Clinical Status in Inflammatory
Bowel Disease: A 5-Year Longitudinal Study. The
American Journal of Gastroenterology, 111(5):712–
719.
Kappelman, M. D., Moore, K. R., Allen, J. K., and Cook,
S. F. (2013). Recent trends in the prevalence of
Crohn’s disease and ulcerative colitis in a commer-
cially insured US population. Digestive Diseases and
Sciences, 58(2):519–525.
Kappelman, M. D., Rifas-Shiman, S. L., Porter, C. Q., Ol-
lendorf, D. A., Sandler, R. S., Galanko, J. A., and
Finkelstein, J. A. (2008). Direct health care costs of
Crohn’s disease and ulcerative colitis in US children
and adults. Gastroenterology, 135(6):1907–1913.
King, R. D., Feng, C., and Sutherland, A. (1995). Stat-
log: comparison of classification algorithms on large
real-world problems. Applied Artificial Intelligence
an International Journal, 9(3):289–333.
Koutroubakis, I. E., Ramos-Rivers, C., Regueiro, M.,
Koutroumpakis, E., Click, B., Schoen, R. E., Hashash,
J. G., Schwartz, M., Swoger, J., Baidoo, L., Barrie,
A., Dunn, M. A., and Binion, D. G. (2015a). Persis-
tent or Recurrent Anemia Is Associated With Severe
and Disabling Inflammatory Bowel Disease. Clinical
Gastroenterology and Hepatology: The Official Clin-
ical Practice Journal of the American Gastroentero-
logical Association, 13(10):1760–1766.
Koutroubakis, I. E., Ramos–Rivers, C., Regueiro, M.,
Koutroumpakis, E., Click, B., Schwartz, M., Swoger,
J., Baidoo, L., Hashash, J. G., Barrie, A., and oth-
ers (2016). Five-year period prevalence and charac-
teristics of anemia in a large US inflammatory bowel
disease cohort. Journal of clinical gastroenterology,
50(8):638.
Koutroubakis, I. E., Regueiro, M., Schoen, R. E., Ramos-
Rivers, C., Hashash, J. G., Schwartz, M., Swoger,
J., Barrie, A., Baidoo, L., Dunn, M. A., and others
(2015b). Multiyear patterns of serum inflammatory
biomarkers and risk of colorectal neoplasia in patients
with ulcerative colitis. Inflammatory bowel diseases,
22(1):100–105.
Lim, T.-S., Loh, W.-Y., and Shih, Y.-S. (2000). A compar-
ison of prediction accuracy, complexity, and training
time of thirty-three old and new classification algo-
rithms. Machine learning, 40(3):203–228.
Loftus, C. G., Loftus, E. V., Harmsen, W. S., Zinsmeister,
A. R., Tremaine, W. J., Melton, L. J., and Sandborn,
W. J. (2007). Update on the incidence and prevalence
of Crohn’s disease and ulcerative colitis in Olmsted
County, Minnesota, 1940-2000. Inflammatory Bowel
Diseases, 13(3):254–261.
Mandala Rayabandla, S. (2020). A review of the char-
acteristics of super-utilizers and evidence-based ap-
proaches to reduce healthcare utilization.
Meng, X.-H., Huang, Y.-X., Rao, D.-P., Zhang, Q., and Liu,
Q. (2013). Comparison of three data mining mod-
els for predicting diabetes or prediabetes by risk fac-
tors. The Kaohsiung Journal of Medical Sciences,
29(2):93–99.
Mikocka-Walus, A., Turnbull, D. A., Andrews, J., Mould-
ing, N., and Holtmann, G. (2008). The effect of func-
HEALTHINF 2022 - 15th International Conference on Health Informatics
160

tional gastrointestinal disorders on psychological co-
morbidity and quality of life in patients with inflam-
matory bowel disease. Alimentary pharmacology &
therapeutics, 28(4):475–483.
Molodecky, N. A., Soon, I. S., Rabi, D. M., Ghali, W. A.,
Ferris, M., Chernoff, G., Benchimol, E. I., Panac-
cione, R., Ghosh, S., Barkema, H. W., and Kaplan,
G. G. (2012). Increasing incidence and prevalence
of the inflammatory bowel diseases with time, based
on systematic review. Gastroenterology, 142(1):46–
54.e42; quiz e30.
Morid, M. A., Kawamoto, K., Ault, T., Dorius, J., and Ab-
delrahman, S. (2017). Supervised learning methods
for predicting healthcare costs: systematic literature
review and empirical evaluation. In AMIA Annual
Symposium Proceedings, volume 2017, page 1312.
American Medical Informatics Association.
Morid, M. A., Sheng, O. R. L., Kawamoto, K., and Ab-
delrahman, S. (2020). Learning hidden patterns from
patient multivariate time series data using convolu-
tional neural networks: A case study of healthcare
cost prediction. Journal of Biomedical Informatics,
111:103565.
Morid, M. A., Sheng, O. R. L., Kawamoto, K., Ault, T., Do-
rius, J., and Abdelrahman, S. (2019). Healthcare cost
prediction: Leveraging fine-grain temporal patterns.
Journal of biomedical informatics, 91:103113.
Perveen, S., Shahbaz, M., Guergachi, A., and Keshavjee, K.
(2016). Performance Analysis of Data Mining Clas-
sification Techniques to Predict Diabetes. Procedia
Computer Science, 82:115–121.
Petersen, B. K., Mayhew, M. B., Ogbuefi, K. O., Greene,
J. D., Liu, V. X., and Ray, P. (2018). Modeling sep-
sis progression using hidden markov models. arXiv
preprint arXiv:1801.02736.
Raghunathan, T. E., Solenberger, P. W., and Van Hoewyk,
J. (2002). IVEware: Imputation and variance estima-
tion software. Ann Arbor, MI: Survey Methodology
Program, Survey Research Center, Institute for Social
Research, University of Michigan.
Ramos-Rivers, C., Regueiro, M., Vargas, E. J., Szigethy, E.,
Schoen, R. E., Dunn, M., Watson, A. R., Schwartz,
M., Swoger, J., Baidoo, L., Barrie, A., Dudekula,
A., Youk, A. O., and Binion, D. G. (2014). Associ-
ation between telephone activity and features of pa-
tients with inflammatory bowel disease. Clinical Gas-
troenterology and Hepatology: The Official Clinical
Practice Journal of the American Gastroenterological
Association, 12(6):986–994.e1.
Shah, A. D., Bartlett, J. W., Carpenter, J., Nicholas, O., and
Hemingway, H. (2014). Comparison of random forest
and parametric imputation models for imputing miss-
ing data using mice: a caliber study. American journal
of epidemiology, 179(6):764–774.
Sundar, N. A., Latha, P. P., and Chandra, M. R. (2012). Per-
formance analysis of classification data mining tech-
niques over heart disease database. International jour-
nal of engineering science & advanced technology,
2(3):470–478.
Waljee, A. K., Joyce, J. C., Wang, S., Saxena, A., Hart, M.,
Zhu, J., and Higgins, P. D. R. (2010). Algorithms Out-
perform Metabolite Tests in Predicting Response of
Patients With Inflammatory Bowel Disease to Thiop-
urines. Clinical Gastroenterology and Hepatology,
8(2):143–150.
Waljee, A. K., Wallace, B. I., Cohen-Mekelburg, S., Liu, Y.,
Liu, B., Sauder, K., Stidham, R. W., Zhu, J., and Hig-
gins, P. D. R. (2019). Development and Validation of
Machine Learning Models in Prediction of Remission
in Patients With Moderate to Severe Crohn Disease.
JAMA Network Open, 2(5):e193721–e193721.
Wei, Z., Wang, W., Bradfield, J., Li, J., Cardinale, C., Frack-
elton, E., Kim, C., Mentch, F., Van Steen, K., Viss-
cher, P., Baldassano, R., and Hakonarson, H. (2013).
Large Sample Size, Wide Variant Spectrum, and Ad-
vanced Machine-Learning Technique Boost Risk Pre-
diction for Inflammatory Bowel Disease. The Ameri-
can Journal of Human Genetics, 92(6):1008–1012.
Zhang, Y., Zhang, Y., Swears, E., Larios, N., Wang, Z., and
Ji, Q. (2013). Modeling temporal interactions with in-
terval temporal bayesian networks for complex activ-
ity recognition. IEEE transactions on pattern analysis
and machine intelligence, 35(10):2468–2483.
Classification Models for Predicting Inflammatory Bowel Disease Healthcare Utilization
161
