
Classifying Diabetic Retinopathy using CNN and Machine Learning
Chaymaa Lahmar
1
and Ali Idri
1,2
1
Software Project Management Research Team, ENSIAS, Mohammed V University in Rabat, Morocco
2
Modeling, Simulation and Data Analysis, Mohammed VI Polytechnic University Benguerir, Morocco
Keywords: Medical Images, Diabetic Retinopathy, Deep Learning, Hybrid Architectures.
Abstract: Diabetic retinopathy (DR) is one of the main causes of vision loss around the world. A computer-aided
diagnosis can help in the early detection of this disease which can be beneficial for a better patient outcome.
In this paper, we conduct an empirical evaluation of the performances of twenty-eight deep hybrid
architectures for an automatic binary classification of referable DR, and compared them to seven end-to-end
deep learning (DL) architectures. The architectures were compared using the Scott Knott test and the Borda
count voting method. All the empirical evaluations were over the APTOS dataset, using five-fold cross
validation. The results showed the importance of combining DL techniques and classical machine learning
techniques for the classification of DR. The hybrid architecture using the SVM classifier and MobileNet_V2
for feature extraction was the top performing and it was classified among the best performing end-to-end deep
learning architectures with an accuracy equal to 88.80%; note that none of the hybrid architectures
outperformed all the end-to-end architectures.
1 INTRODUCTION
Diabetes is a life-long disease that affects the body’s
ability to produce or use insulin in order to maintain
proper levels of glucose in the blood (Samreen, 2009).
The prevalence of diabetes has reached epidemic
levels especially in low and middle-income countries.
The African continent has the greatest proportion of
undiagnosed diabetes with 60% of adults currently
living with diabetes unaware of their condition, and
global projections show that it will experience the
greatest future increase in the burden of diabetes by
2045(Kibirige et al., 2019). Diabetic retinopathy
(DR) is the most severe ocular complication of
diabetes; it can cause vision loss and blindness. It has
been estimated that more than 1 in 3 people with
diabetes have some form of DR(Yau et al., 2012).
Medical image analysis using machine learning (ML)
and deep learning (DL) is one of the most promising
research areas since it provides facilities for the
diagnosis of several diseases such as diabetic
retinopathy, cardiology and breast cancer (García et
al., 2017; Wong, Fortino and Abbott, 2020;
Zerouaoui and Idri, 2021).
Multiple automated systems have been developed
to help human experts in the detection of DR,
knowing that human experts usually focus on some
typical lesions associated with DR such as hard
exudates, red lesions, micro-aneurysms, hemorrhage
and abnormal blood vessels from the fundus images.
Many works paid attention to automatically detect
and segment these lesions by using hand-engineered
feature extraction and traditional machine-learning
techniques (Shahin et al., 2012; Casanova et al.,
2014; Asiri et al., 2018). In general, DL techniques
showed better performance in diabetic retinopathy
detection compared to the classical machine learning
and the hand-engineered feature extraction
techniques (Asiri et al., 2018; Islam et al., 2020). In
the other hand, classical machine learning techniques
are less time consuming and require fewer parameter
tuning compared to the DL ones. For instance, a
plenty of works paid attention to the hybrid
architectures where they combined the strengths of
DL techniques for feature extraction and the classical
machine learning for classification (Abràmoff et al.,
2016; Gargeya and Leng, 2017). For example, the
study by (Abràmoff et al., 2016) used the CNNs for
the feature extraction and random forest for the
classification of DR over the Messidor-2 dataset. The
results showed the importance of using the hybrid
architectures since the sensitivity of the model was
equal to 96.8% when the specificity was 87%. The
study by (Gargeya and Leng, 2017) aimed to develop
52
Lahmar, C. and Idri, A.
Classifying Diabetic Retinopathy using CNN and Machine Learning.
DOI: 10.5220/0010851500003123
In Proceedings of the 15th International Joint Conference on Biomedical Engineering Systems and Technologies (BIOSTEC 2022) - Volume 2: BIOIMAGING, pages 52-62
ISBN: 978-989-758-552-4; ISSN: 2184-4305
Copyright
c
2022 by SCITEPRESS – Science and Technology Publications, Lda. All rights reserved

an hybrid model for DR detection in red, green, and
blue fundus photographs, the authors used the
principle of deep residual learning to develop a
custom CNN for feature extraction and the decision
tree for the classification. The model was trained over
the EYEPCAS dataset and it was tested over the
Messidor-2 and E-Ophta datasets; note that the
sensitivity and specificity of the model were equal to
94% and 98% respectively.
This paper develops and evaluates twenty-eight
hybrid architectures using four classifiers (SVM,
MLP, KNN and DT) and seven of the most popular
DL techniques as feature extractors (MobileNet_V2,
DenseNet201, VGG16, VGG19, Inception_V3,
ResNet50 and Inception_ResNet_V2) for a binary
classification of the referable DR. The four classifiers
and the seven extractors were chosen since they
provide high accuracy classification values (Asiri et
al., 2018; Islam et al., 2020; Lahmar and Idri, 2021);
We compared the twenty-eight hybrid architectures to
seven end-to-end DL architectures, the same
architectures used as feature extractors. For the
empirical evaluations, we used four performance
criteria: accuracy, precision, sensitivity and F1-score,
and a five-fold cross-validation over the APTOS
dataset. Moreover, the Scott Knott (SK) statistical test
and Borda count voting method were used to cluster
and rank the architectures. Note that the SK test has
been widely used to compare and cluster multiple
machine learning models in different fields such as
software engineering (Ottoni et al., 2020) and breast
cancer (Idri et al., 2020). Hence, we used the SK test
because of: (1) its high performance compared to
other statistical tests such as Calinski and Corsten
(Calinski and Corsten, 1985), (2) its ability to cluster
the best non-overlapping groups of machine learning
techniques. Furthermore, we used the Borda count
voting method (García-Lapresta and Martínez-
Panero, 2002) to rank the best SK selected
techniques. The present study discusses four research
questions (RQs):
(RQ1): What is the overall performance of the hybrid
architectures in DR classification?
(RQ2): Is there any deep learning techniques for
feature extraction which distinctly
outperformed the others when used in hybrid
architecture?
(RQ3): Is there any hybrid architectures which
distinctly outperformed the others regardless
the feature extractor and the classifier used?
(RQ4): Is there any hybrid architectures which
distinctly outperformed the end-to-end
architectures?
The main significant contributions of this empirical
study are:
(1) Building twenty-eight hybrid architectures
using four classifiers: SVM, MLP, DT and
KNN, and seven DL techniques for feature
extraction (FE): DenseNet201, VGG16,
VGG19, Inception_ResNet_V2,
Inception_V3, ResNet50 and MobileNet_V2
for DR classification.
(2) Assessing the twenty-eight hybrid
architectures over the APTOS dataset.
(3) Evaluating and comparing the performances
of the twenty-eight hybrid architectures to
each other using the SK test and Borda Count
voting method.
(4) Comparing the performances of the best
selected hybrid architectures with the seven
end-to-end DL architectures using the SK test
and Borda Count method.
The rest of this paper is structured as follows:
Section 2 presents an overview of the seven DL
techniques and the four classical classifiers used to
develop the hybrid architectures. In Section 3, we
describe the data preparation which includes the
image pre-processing and data augmentation. Section
4 outlines the empirical methodology followed in this
research. Section 5 reports and discusses the
empirical results. Section 6 presents the threats of
validity of the study. Section 7 summarizes the
conclusion and draws the future works.
2 BACKGROUND
The present study developed twenty-eight hybrid
architectures based on seven DL architectures for
feature extraction and four classical machine learning
techniques as classifiers. This section presents an
overview of each technique used: feature extractor or
classifier.
2.1 Feature Extraction Techniques
This section presents the seven deep learning
architectures used for FE:
VGG16 and VGG19: VGG16 is a convolution
neural network (CNN) architecture which was used to
win ILSVR (ImageNet) competition in 2014
(Simonyan and Zisserman, 2015). VGG16 expects as
an input 224 x 224 RGB image, the architecture of the
model is composed of convolution layers blocks of
Classifying Diabetic Retinopathy using CNN and Machine Learning
53

3x3 filters with a stride 1 and always used the same
padding and maxpooling layer of 2x2 filters of stride
2. It has 3 fully connected layers (FC) and a softmax
for the output. All hidden layers are equipped with the
rectified linear unit (ReLU) non-linearity. The main
difference between the VGG16 and VGG19 is the
number of layers the16 and 19 refer to the number of
layers in the VGG16 and VGG19 respectively.
Inception_V3: Is a convolutional neural network
architecture from the Inception family, the inception
models differ from the ordinary CNN in the structure
where the inception models are inception blocks, that
means lapping the same input tensor with multiple
filters and concatenating their results. Inception_V3
is an improved version of inception_V1 and
inception_V2 with more parameters. It is 42 layers
deep with a default input size fixed to 299x299
(Szegedy et al., 2016).
ResNet50: Short for Residual Networks is a classic
convolutional neural network that has 50 layers deep,
it expects as an input a 224 x 224 image. The
architecture of ResNet50 is inspired by VGG; it has
3×3 filters and follows two simple design rules: (1)
for the same output feature map size, the layers have
the same number of filters; and (2) if the feature map
size is halved, the number of filters is doubled so as
to preserve the time complexity per layer (He et al.,
2016).
Inception_ResNet_V2: Is a convolutional neural
network that is trained on more than a million images
from the ImageNet database. It is built on the
Inception family of architectures but incorporates
residual connections, it expects as an input 299 x 299
image(Szegedy et al., 2017).
DenseNet201: Is a CNN architecture that is 201
layers deep. It is composed of dense blocks that are
densely connected together: Each layer receives in
input all previous layers output feature maps (Huang
et al., 2017). DenseNet201 is an improvement of
ResNet that includes dense connections among
layers. It connects each layer to every other layer in a
feedforward fashion. Unlike traditional CNNs with L
layers that have L connections, DenseNet201 has L
(L+1)/ 2 direct connections.
MobileNet_V2: Its architecture is based on an
inverted residual structure where the residual
connections are between the bottlenecks layers. It
contains 53 layers and it is a lightweight architecture
that performs a single convolution on each color
channel rather than combining all three and flattening
it (Sandler et al., 2018).
2.2 Classification Techniques
This section presents the four classification
techniques used in the hybrid architectures. Note that
we used the default configuration of the four
classifiers.
MLP: short for multilayer perceptron (MLP) is a feed
forward artificial neural network model that maps
input data onto appropriate output data(Bhatkar and
Kharat, 2016). It is used for both classification and
regression. Five parameters should be seated
carefully when an MLP is used: the number of hidden
layers, the number of neurons of each hidden layer,
the number of training epochs, the learning rate and
the momentum.
SVM: Short for Support Vector Machine, it is a
supervised machine learning algorithm which is used
for classification and regression. The main idea of
SVM is to find maximum marginal hyperplane that
best divides the dataset into classes(Kaur et al., 2019).
DT: Short for decision tree, it is used for both
classification and regression problems. In the tree
structures, each node represents a feature from the
data pattern, each branch is a decision rule, and each
leaf represents an output depending on the
problem(Poolsawad, Kambhampati and Cleland,
2014).
KNN: Short for k-Nearest Neighbor, itis a supervised
machine learning technique used for classification
and regression tasks. It uses in general the Euclidian
distance to measure the similarity between its nearest
neighbors(Bandyopadhyay et al., 2018).
3 DATA PREPARATION
This section presents the data preparation process we
followed for the the APTOS dataset, which consists
of data acquisition, data pre-processing and data
augmentation.
3.1 Data Acquisition
In this study, we evaluated the performances of the
twenty-eight hybrid architectures using the APTOS
dataset which contains 3662 images. The images
were gathered from multiple clinics using a variety of
cameras and it contains the grades of DR on a scale
of 0 to 4 (APTOS 2019 Blindness Detection | Kaggle,
2019). Note that DR is usually classified into five
grades: no DR, mild, moderate, severe non
BIOIMAGING 2022 - 9th International Conference on Bioimaging
54
proliferative diabetic retinopathy, and proliferative
diabetic retinopathy.
3.2 Data Preprocessing and
Augmentation
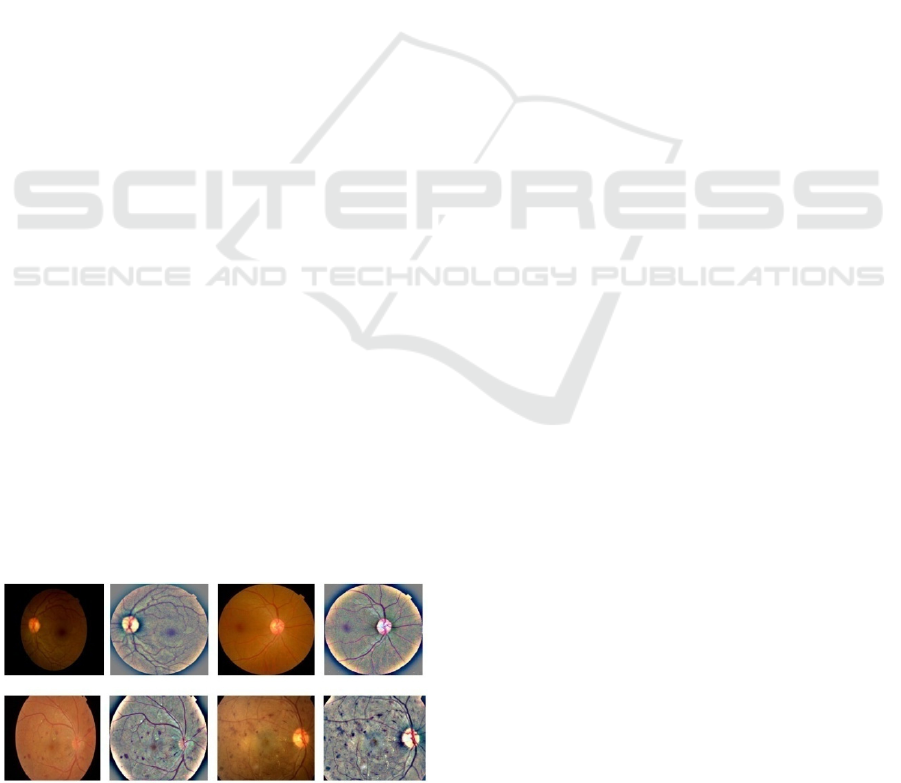
Figure 1 show samples before and after the
preprocessing. Preprocessing is an important step to
improve the quality of the images since the images of
low quality can produce inaccurate results (Razzak,
Naz and Zaib, 2018). Therefore, in order to reduce the
noise, several pre-processing methods were applied to
the fundus images. First, we have started by
relabeling the data since the target variable of our
study is the referable diabetic retinopathy; therefore,
we needed to relabel the three datasets from a scale of
0 to 4, to a scale of 0 to 1 where 0 stands for no
referable DR and 1 stands for referable DR. Note that
referable diabetic retinopathy was defined as a
diabetic retinopathy severity level of moderate non
proliferative diabetic retinopathy or worse. Then, the
images were cropped in order to distinguish the
foreground (the retina) from background of the
images. After that, all the images were resized in
accordance with the input requirement of the seven
deep learning architectures. And, we applied the
algorithm of Graham by subtracting each pixel value
of images by the weighted means of its surrounding
pixel values, and add it by 50% grayscale which
makes the blood vessels as well as the lesion areas in
fundus images more explicit (Diabetic Retinopathy
Detection | Kaggle, no date). Then, we normalized the
data by converting the pixel values of images from [0,
255] to [0, 1] before feeding images to the network in
order to remove the noise from the images. Finally,
we resampled the images of the dataset by generating
three new images from each single input image with
different augmentation techniques such as shifting,
rotating and flipping because of the fact that the
number of images in each category (rDR and no rDR)
is imbalanced since half of images in the dataset were
labeled with No rDR class. Therefore, the total
number of samples with rDR was increased by 2.
Figure 1: Samples before and after the preprocessing.
4 EMPIRICAL DESIGN
This section presents the empirical design of the
present study, including: (1) the five-fold cross
validation and the performance metrics used to
evaluate the architectures, (2) the statistical test Skott
Knott used to cluster the architectures based on their
accuracy values, (3) Borda Count voting method used
to rank the architectures of the best SK cluster
according to accuracy, sensitivity, precision and F1-
score and (4) the experimental process we followed
to carry out all the empirical evaluations.
4.1 Performance Metrics
In this study, we trained and evaluated the
architectures using the k-fold cross validation with k
equal to 5, and we reported the average of the
performance metrics during the five iterations of each
technique. We used four metrics to evaluate the
performances of the classifiers: accuracy, sensitivity,
precision, and F1 score.
4.2 Statistical Test SK and Borda
Count
Scott Knott Test: is an exploratory clustering
algorithm usually used in the analysis of variance
(ANOVA) context. It was proposed by Scott and
Knott to find distinction overlapping groups based on
the multiple comparisons of treatment means
(Jelihovschi and Faria, 2000).
Borda Count: is a voting method for single winner
election methods. In this technique, points are given
to candidates based on their ranking; 1 point for last
choice, 2 points for second-to-last choice, and so on
until you are at the top. The point values for all ranks
are totaled, and the candidate with the largest point
total is the winner (García-Lapresta and Martínez-
Panero, 2002). In this study, we used Borda count
technique to find the best performing hybrid
architectures based on the four performance measures
with equal weights. This strategy was used to make
sure that we do not favor a particular performance
criterion. We used the Borda Count method based on
the four-performance metrics: accuracy, precision,
sensitivity and F1-score.
4.3 Experimental Process
In this subsection, we explain the methodology we
followed to carry out the empirical evaluations. It
consists of five steps and it is similar to
Classifying Diabetic Retinopathy using CNN and Machine Learning
55

methodologies used in (Bony et al., 2001; Sharma et
al., 2003; Azzeh, Nassif and Minku, 2015; Idri and
Abnane, 2017; Idri, Abnane and Abran, 2018). The
evaluation process involves:
1) Assess the four-performance metrics of each
variant of the four classifiers (SVM, DT, MLP,
KNN) using the seven deep learning
architectures as feature extractors
(DenseNet201, MobileNet_V2, VGG16,
VGG19, Inception_V3, ResNet50,
Inception_ResNet_V2).
2) Cluster the hybrid architectures of each
classifier using the SK test based on accuracy
and identify the best SK clusters.
3) Rank the hybrid architectures of the best SK
cluster of each classifier using the Borda count
voting method based on the four performance
measures (accuracy, precision, sensitivity and
F1-score). And select the best hybrid
architecture of each classifier.
4) Cluster the best hybrid architectures of the four
classifiers (obtained in Step 3) using the SK test
based on accuracy.
5) Rank the best hybrid architectures of Step 4
using Borda count voting method.
6) Evaluate and compare the performances of the
best selected hybrid architectures of step 4 with
seven end-to-end DL architectures (the same DL
techniques used as feature extractors) using SK
test and Borda Count voting method.
5 RESULTS AND DISCUSSION
In this section, we discuss the results of the empirical
evaluations of the hybrid architectures over the
APTOS dataset. The performances of the
architectures were evaluated using four performance
criteria: accuracy, sensitivity, precision and F1-score.
First, for each classifier we evaluated the
performances in terms of accuracy. Thereafter, we
evaluated the influence of the seven DL feature
extractors on the performances of the four classifiers
to identify which ones of them are positively
impacting the performance of the classification.
Then, we compared the best hybrid architectures of
the four classifiers to identify the best hybrid
architecture. Finally, we compared the best hybrid
architectures with the seven end-to-end DL
techniques to identify which hybrid architecture (if
exist) outperformed the end-to-end architectures.
5.1 RQ1: What Is the Overall
Accuracy Performance of the
Hybrid Architectures in Referable
DR Classification?
In this section we are going to evaluate and compare
the hybrid architectures by assessing the accuracy
values for each classifier. Table 1 summarizes the
testing accuracy values of the hybrid architectures
over the APTOS dataset. We observe that:
• For SVM, the best accuracy value was
achieved by using MobileNet_V2 for FE, it
reached 88.80%, and the worst accuracy value
was achieved by using ResNet50 for FE and it
reached 75.80%.
• For MLP, the best accuracy value was
achieved by using the DenseNet201 for FE, it
reached 87.15%, and the worst accuracy value
was achieved by using ResNet50 for FE and it
reached 72.07%.
• For KNN, the best accuracy value was
achieved by using MobileNet_V2 for FE, it
reached 82.89%, and the worst accuracy value
was achieved by using DenseNet201 for FE
and it reached 73.58%.
• For DT, the best accuracy value was achieved
by using MobileNet_V2 for FE, it reached
73.16%, and the worst accuracy value was
achieved by when using VGG19 for FE and it
reached 69.99%.
5.2 RQ2: Is There Any Deep Learning
Technique for Feature Extraction
Which Distinctly Outperformed the
Others When Used in Hybrid
Architectures?
This section aims to evaluate the effect of the seven
DL feature extractors on the performances of the four
classifiers to identify (if exist) the DL techniques that
are positively influencing the classification
performances. For this purpose, we used: (1) the SK
test based on the accuracy values to cluster the
architectures having the same predictive capabilities
regardless the feature extractor used, and (2) the
Borda count method based on the four-performance
metrics to rank the architectures belonging to the best
SK clusters of each classifier. Table 1 shows the
values of the four performance measures of all the
hybrid architectures. Figure 2 shows the results of SK
test. We observe that:
BIOIMAGING 2022 - 9th International Conference on Bioimaging
56

• For SVM, we obtained three clusters. The best
SK cluster contains 3 feature extraction
techniques: MobileNet_V2,
InceptionResNet_V2 and DenseNet201. The
second SK cluster contains the VGG16,
Inception V3 and the VGG19. The last cluster
contains the ResNet50.
• For MLP, we obtained four clusters which
imply that the MLP classifier is impacted by
the DL feature extractor used. The best SK
cluster contains 3 FE techniques:
DenseNet201, MobileNet_V2, and
InceptionResNet_V2. The second SK cluster
contains VGG16, and Inception V3. The third
SK cluster contains VGG19. And, the last
cluster contains MLP with ResNet50.
• For DT, we obtained two clusters. The best SK
cluster contains 4 FE techniques:
MobileNet_V2, InceptionResNet_V2,
DenseNet201 and VGG16. The second SK
cluster contains the ResNet50 and the
Inception_V3 and VGG19.
• For KNN, we obtained two clusters. The best
SK cluster contains 5 FE techniques:
MobileNet_V2, VGG16, Inception_V3,
InceptionResNet_V2 and VGG19. The second
SK cluster contains ResNet50 and the
DenseNet201.
Table 2 shows the Borda count ranks of the DL
architectures of the best SK cluster for each classifier.
As can be seen, the architectures designed with
MobileNet_V2 were ranked first regardless the
classifier, except the MLP. The DenseNet201 was
ranked first with MLP and third with the SVM and
DT. As for the InceptionResNet_V2, it was ranked
second for SVM, DT and MLP and it was ranked third
with the KNN. The VGG16 was ranked second with
the KNN and fourth with the DT. For the VGG19 and
Table 1: Accuracy, precision, recall and F1 score values of the hybrid architectures.
Classifier Feature extractor Accuracy Sensitivity Precision F1-Score
MLP VGG16 83.66% 76.43% 89.66% 82.52%
VGG19 80.56% 69.30% 90.27% 78.41%
MobileNet_V2 86.86% 80.77% 91.32% 85.72%
DenseNet201 87.15% 80.93% 92.66% 86.40%
Inception_V3 83.20% 80.77% 85.01% 82.34%
ResNet50 72.07% 53.73% 85.91% 66.11%
InceptionResNet_V2 86.59% 86.11% 87.12% 86.61%
SVM VGG16 85.30% 78.07% 91.58% 84.29%
VGG19 84.45% 78.28% 89.41% 83.48%
MobileNet_V2 88.80% 85.89% 92.03% 88.85%
DenseNet201 87.68% 82.61% 92.10% 87.10%
Inception_V3 84.83% 83.16% 86.11% 84.61%
ResNet50 75.80% 76.73% 75.59% 76.16%
InceptionResNet_V2 88.72% 88.59% 88.99% 88.80%
DT VGG16 72.21% 65.63% 75.86% 70.38%
VGG19 69.99% 59.96% 75.51% 66.84%
MobileNet_V2 73.16% 65.95% 78.81% 71.80%
DenseNet201 72.87% 63.22% 78.71% 70.12%
Inception_V3 70.00% 68.95% 70.61% 69.77%
ResNet50 70.19% 58.43% 77.20% 66.52%
InceptionResNet_V2 72.95% 67.32% 76.29% 71.52%
MobileNet_V2 73.16% 65.95% 78.81% 71.80%
KNN VGG16 81.36% 73.31% 88.06% 80.01%
VGG19 79.62% 71.87% 85.25% 77.99%
MobileNet_V2 82.89% 73.67% 90.57% 81.25%
DenseNet201 73.58% 52.42% 91.10% 66.54%
Inception_V3 81.24% 76.65% 84.53% 80.40%
ResNet50 74.49% 64.15% 81.22% 71.68%
InceptionResNet_V2 80.22% 73.70% 85.09% 78.99%
Classifying Diabetic Retinopathy using CNN and Machine Learning
57
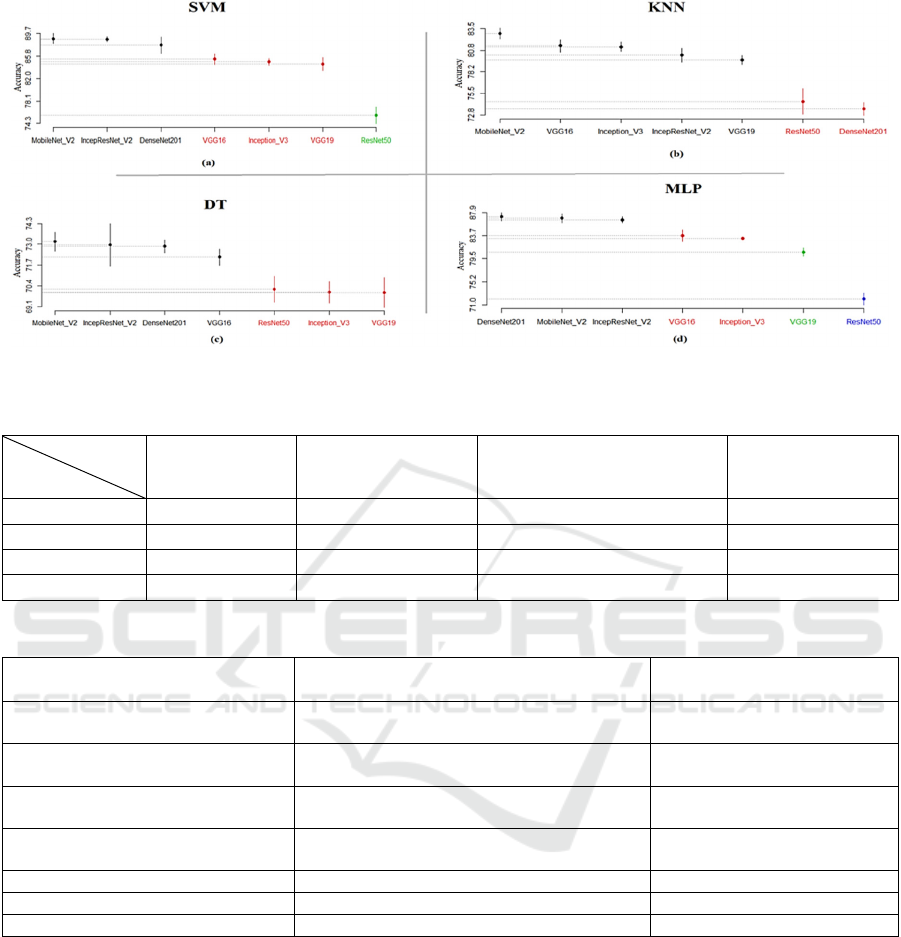
Figure 2: SK test Results of the hybrid architectures using the four classifiers.
Table 2: Borda count ranking of the best hybrid architectures using the four classifiers.
Classifier
Rank
MLP SVM KNN DecisionTree
1 DenseNet201 MobileNet_V2 MobileNet_V2 MobileNet_V2
2 IncepResNet_V2 IncepResNet_V2 VGG16 and Inception_V3 IncepResNet_V2
3 MobileNet_V2 DenseNet201 IncepResNet_V2 DenseNet201
4 - - VGG19 VGG16
Table 3: Occurrences of DL techniques in the best SK clusters and their Borda count ranks.
DL for feature extraction Appearance in the best SK cluster Borda Count Ranking
MobileNet_V2 4 3 times first rank
1 time third rank
InceptionResNet_V2 4 3 times second rank
1 time third ran
k
DenseNet201 3 1 time first rank
2 times third rank
VGG16 2 1 time second rank
1 time fourth ran
k
VGG19 1 Fourth ran
k
ResNet50 -- --
Ince
p
tion
_
V3 1 Second ran
k
Inception_V3, they only belong to the best cluster of
the KNN classifier and were ranked second and
fourth respectively. Finally, ResNet50 in general
underperformed all the other feature extractors.
To evaluate the impact of each feature extraction
technique on the classification performance
regardless the classifier, we count the number of
occurrences of each feature extractor in the best SK
clusters. In case of a tie, we refer to the Borda count
voting method. As can be seen in Table 3, the best
performing feature extractor is MobileNetV2,
since it appears 4 times in the best SK clusters and
was ranked 3 times first. The following feature
extractors are the DenseNet201 and
Inception_ResNet_V2 since they appeared 3 and 4
times in the best SK clusters respectively, note that
the DenseNet201 was ranked first and two times
third, and Inception_ReseNet_V2 was ranked second
3 times and third one time. The VGG16 appears in the
best cluster 2 times and was ranked second and fourth
respectively. Finally, the VGG19 and Inception V3
appeared 1 time in the best SK clusters.
To summarize, DT and KNN are the less sensitive
classifiers to the FE techniques used since we
BIOIMAGING 2022 - 9th International Conference on Bioimaging
58
obtained only two clusters for each. MobileNet_V2
was the best feature extractor positively impacting the
DR classification performance regardless the
classifier used. Finally, DenseNet201 and
InceptionResNetV2 were the following best feature
extractors.
5.3 RQ3: Is There Any Hybrid
Architectures Which Distinctly
Outperformed the Others
Regardless the Feature Extractor
and the Classifier Used?
This Section uses the SK test based on accuracy to
evaluate the predictive capabilities of the best hybrid
architectures of the four classifiers (i.e., hybrid
architectures ranked first in Table 2).
Subsequently, we discuss the ranking results of the
architectures belonging to the best SK clusters by
using the Borda count voting method to identify the
best hybrid architecture regardless the classifier.
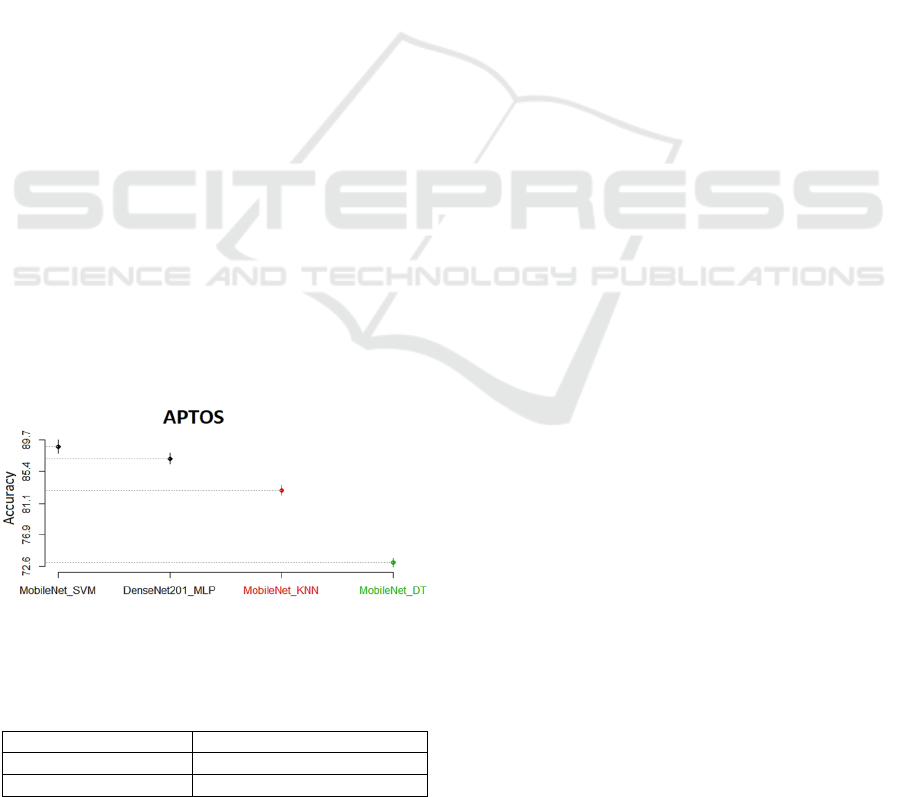
Figure 3 shows the results of the SK test applied on
the best ranked hybrid architectures. We obtained
three clusters. The best SK cluster contains two
hybrid architectures: SVM with MobileNet_V2 and
MLP with DenseNet201. The second SK cluster
contains KNN with MobileNet_V2. The last cluster
contains DT with and MobileNet_V2. This means
that SVM with MobileNet_V2 and MLP with
DenseNet201 significantly outperformed the other
techniques. Using the Borda count voting method on
the hybrid architectures of the best SK cluster, we
notice that the SVM with MobileNet_V2 and MLP
with DenseNet201 were ranked first and second
respectively as shown in Table 4.
Figure 3: Results of SK test over the best hybrid
architectures.
Table 4: Borda count ranking of the best hybrid
architectures.
Rank H
y
brid architecture
1 MobileNet
_
V2 + SVM
2 DenseNet201 + MLP
5.4 RQ4: Is There Any Hybrid
Architectures Which Distinctly
Outperformed the End-to-End
Classifiers?
In this section, we used the SK test based on accuracy
to compare the performances of the best hybrid
architectures of the four classifiers (i.e., hybrid
architectures ranked first in Table 2) with seven end
to end DL architectures. The end-to-end deep
learning architectures we used are the same
architectures that have been used for the feature
extraction. In fact, we trained the end-to-end models
by using the hyper-parameter tuning; we used the
Adam (adaptive moment estimation) for the
optimisation with an initial learning rate set to 0.0001.
Moreover, we usedL2- regularizers and weight decay
to reduce the overfitting. A fully connected layer was
trained with the ReLU activation function, followed
by a dropout layer with a probability of 0.5. We
modified the last layer in all models to output two
classes (referable DR and No referable DR) instead
of 1000 classes as was used for ImageNet(Deng et al.,
2010). Finally, we trained the models using 200
epochs.
Thereafter, we discuss the ranking results of the
best architectures. Table 5 shows the values of the
four performance measures of all the end-to-end
architectures. Figure 4 shows the results of the SK test
applied on the seven end-to-end techniques and the
best ranked hybrid architectures. We obtained six SK
clusters. The best cluster only contains two end-to-
end architectures: MobileNet_V2 and DenseNet201.
The second cluster contains two end to end
architectures: InceptionResnet_V2 and Inception_V3
and only one hybrid architecture: MobileNet_V2 with
SVM. The third cluster contains the hybrid
architecture DenseNet201 with MLP and the end-to-
end architecture VGG16.The fourth cluster contains
the end-to-end architecture VGG19 and the hybrid
architecture MobileNet_V2 with
KNN
. Finally, the
fifth and sixth SK clusters contain the end-to-end
architecture ResNet50 and the hybrid architecture DT
with MobileNet_V2 respectively. This means that the
end-to-end architectures belonging to the best cluster
outperformed all the hybrid architectures in terms of
accuracy. The hybrid architecture SVM with
MobileNet_V2belongs to the second cluster which
means that it performed better than all the end-to-end
architectures of the remaining clusters; however, the
other hybrid architectures, in particular MobileNet
with KNN and DT were the worst since they belong
to the last clusters.
Classifying Diabetic Retinopathy using CNN and Machine Learning
59
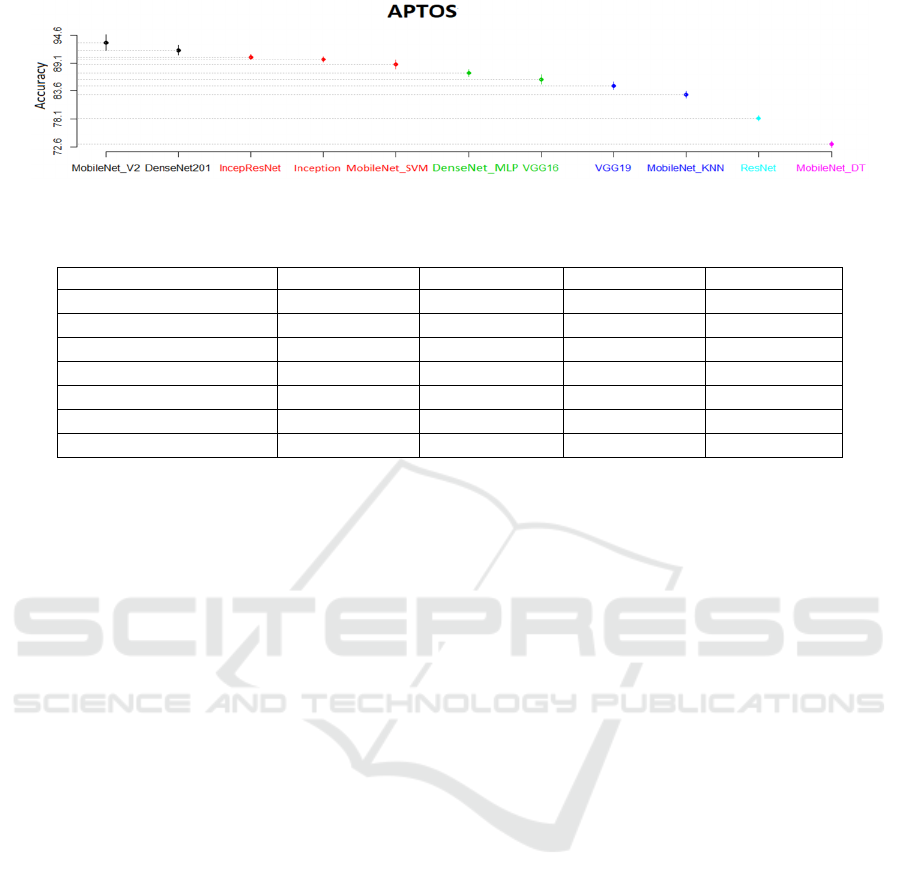
Figure 4: Results of SK test of the best hybrid architectures and the end-to-end techniques.
Table 5: Performance of the end-to-end DL techniques.
DL technique Accuracy Sensitivity Precision F1-score
VGG16 85.89% 77.41% 93.33% 84.63%
VGG19 84.63% 73.95% 94.24% 82.87%
DenseNet201 91.62% 90.06% 93.03% 91.52%
MobileNet
_
V2 93.09% 89.27% 98.22% 93.53%
Inception
_
V3 89.75% 90.34% 89.26% 89.80%
ResNet50 78.25% 67.30% 86.39% 75.66%
Inception
_
ResNet
_
V2 89.82% 90.31% 89.35% 89.83%
We conclude that in terms of accuracy the end-to-
end architectures in general outperformed the hybrid
ones. Note that the best cluster contains only the end-
to-end techniques, and therefore, there is no need to
use the Borda count voting method.
6 THREATS OF VALIDITY
This section presents the threats to this paper’s
validity with respect to external and internal validity.
Internal Validity: This paper used the K-fold cross
validation method to promote robustness of the mean
accuracy of the architectures (Xu and Goodacre,
2018). Another internal threat for this experiment is
the use of the most popular pre-trained models to
extract features from images over the APTOS dataset.
External Validity: This study used the APTOS
dataset which contains fundus images; therefore, we
cannot generalize the obtained results for all the
datasets with the same type of images. However, it
will be a good benefit to redo this study using other
DL techniques such as the UNET model with other
public or private datasets in order to confirm or refute
the findings of this study.
Construct Validity: For the reliability of the
classifier performances obtained, this study focused
on the accuracy and other three performance criteria
(precision, sensitivity and F1-score). The main reason
behind the choice of these performance criteria is that
most of the studies used them to measure the
classification performance (Islam et al., 2020).
Moreover, the conclusion was drawn by using the SK
test and Borda count voting system with equal
weights using these four performance criteria. This
strategy was adopted to make sure that we do not
favor a particular performance criterion more than
another.
7 CONCLUSION AND FUTURE
WORK
In this paper, we discussed and presented the results
of an empirical comparative study of twenty-eight
hybrid architectures using four classifiers (SVM, DT,
MLP and KNN) and seven DL techniques for feature
extraction (MobileNet_V2, DenseNet201,
Inception_V3, ResNet50, Inception_ResNet_V2,
VGG19 and VGG16) for referable DR classification.
All the empirical evaluations used four performance
criteria (accuracy, sensitivity, precision and F1-
score), SK statistical test, and Borda Count to assess
and rank these twenty-eight hybrid architectures over
the APTOS dataset. The main findings of this study
are:
RQ1: What is the overall performance of the
hybrid architectures in referable DR
classification?
The accuracy results of the constructed hybrid
architectures were highly influenced by the DL
techniques used as feature extractors and the
BIOIMAGING 2022 - 9th International Conference on Bioimaging
60

classifiers. Nevertheless, we observed that the use of
MobileNet_V2 for FE regardless the classifier,
DenseNet201 with SVM, MLP and DT,
Inception_ResNet_V2 regardless the classifier,
VGG16 with KNN and DT and finally the VGG19
and the InceptionV3 with KNN gave good results.
However, the use of ResNet50 regardless the
classifier underperformed the other techniques.
RQ2: Is there any deep learning technique for
feature extraction which distinctly outperformed
the others when used in the hybrid architectures?
The architectures using MobileNet_V2 gave the
best results, followed by the DenseNet201 and
InceptionResNetV2 since they appeared in the best
SK clusters. Finally, ResNet50 is the worst
performing compared to the other DL techniques.
RQ3: Is there any hybrid architectures which
distinctly outperforms the others regardless the
feature extractor technique and the classifier
used?
The hybrid architecture using SVM with
MobileNet_V2 gave the best results. Followed by the
hybrid architecture designed using MLP with
DenseNet201. Followed by the hybrid architectures
designed using the KNN classifier and
MobileNet_V2. The most underperforming
architectures are the ones designed using DT. As
results we recommend the use of SVM with
MobileNet_V2 hybrid architecture for the
classification of fundus images with referable DR.
RQ4: Is there any hybrid architectures which
distinctly outperformed the end-to-end classifiers?
The two end-to-end architectures DenseNet201
and MobileNet_V2 outperformed all the hybrid
architectures. Nevertheless, the hybrid architecture
designed using SVM with MobileNet_V2 is
promising and it was classified among the best end-
to-end architectures. Therefore, we recommend the
use of the hybrid architecture designed using SVM
with MobileNet_V2 since it is the best performing
hybrid architecture.
REFERENCES
Abràmoff, M. D. et al. (2016) ‘Improved automated
detection of diabetic retinopathy on a publicly available
dataset through integration of deep learning’,
Investigative Ophthalmology and Visual Science,
57(13), pp. 5200–5206. doi: 10.1167/iovs.16-19964.
APTOS 2019 Blindness Detection | Kaggle (2019).
Available at: https://www.kaggle.com/c/aptos2019-
blindness-detection (Accessed: 24 June 2021).
Asiri, N. et al. (2018) ‘Deep Learning based computer-
aided diagnosis systems for diabetic retinopathy: A
survey’, arXiv, (Dl).
Azzeh, M., Nassif, A. B. and Minku, L. L. (2015) ‘An
empirical evaluation of ensemble adjustment methods
for analogy-based effort estimation’, Journal of
Systems and Software, 103, pp. 36–52. doi:
10.1016/j.jss.2015.01.028.
Bandyopadhyay, S. et al. (2018) ‘Gradation of diabetic
retinopathy using KNN classifier by morphological
segmentation of retinal vessels’, Advances in Intelligent
Systems and Computing, 628, pp. 189–198. doi:
10.1007/978-981-10-5272-9_18.
Bhatkar, A. P. and Kharat, G. U. (2016) ‘Detection of
Diabetic Retinopathy in Retinal Images Using MLP
Classifier’, Proceedings - 2015 IEEE International
Symposium on Nanoelectronic and Information
Systems, iNIS 2015, pp. 331–335. doi:
10.1109/iNIS.2015.30.
Bony, S. et al. (2001) ‘The relationship between mycotoxin
synthesis and isolate morphology in fungal endophytes
of Lolium perenne’, New Phytologist, 152(1), pp. 125–
137. doi: 10.1046/j.0028-646X.2001.00231.x.
Calinski, T. and Corsten, L. C. A. (1985) ‘Clustering Means
in ANOVA by Simultaneous Testing’, Biometrics,
41(1), p. 39. doi: 10.2307/2530641.
Casanova, R. et al. (2014) ‘Application of random forests
methods to diabetic retinopathy classification
analyses’, PLoS ONE, 9(6), pp. 1–8. doi:
10.1371/journal.pone.0098587.
Deng, J. et al. (2010) ‘ImageNet: A large-scale hierarchical
image database’, (May 2014), pp. 248–255. doi:
10.1109/cvpr.2009.5206848.
Diabetic Retinopathy Detection | Kaggle (no date).
Available at: https://www.kaggle.com/c/diabetic-
retinopathy-detection/discussion/15801 (Accessed: 24
June 2021).
García-Lapresta, J. L. and Martínez-Panero, M. (2002)
‘Borda count versus approval voting: A fuzzy
approach’, Public Choice, 112(1), pp. 167–184. doi:
10.1023/A:1015609200117.
García, G. et al. (2017) ‘Detection of diabetic retinopathy
based on a convolutional neural network using retinal
fundus images’, Lecture Notes in Computer Science
(including subseries Lecture Notes in Artificial
Intelligence and Lecture Notes in Bioinformatics),
10614 LNCS, pp. 635–642. doi: 10.1007/978-3-319-
68612-7_72.
Gargeya, R. and Leng, T. (2017) ‘Automated Identification
of Diabetic Retinopathy Using Deep Learning’,
Ophthalmology, 124(7), pp. 962–969. doi:
10.1016/j.ophtha.2017.02.008.
He, K. et al. (2016) ‘Deep residual learning for image
recognition’, Proceedings of the IEEE Computer
Society Conference on Computer Vision and Pattern
Recognition, 2016-Decem, pp. 770–778. doi:
10.1109/CVPR.2016.90.
Classifying Diabetic Retinopathy using CNN and Machine Learning
61

Huang, G. et al. (2017) ‘Densely connected convolutional
networks’, Proceedings - 30th IEEE Conference on
Computer Vision and Pattern Recognition, CVPR 2017,
2017-Janua, pp. 2261–2269. doi:
10.1109/CVPR.2017.243.
Idri, A. et al. (2020) ‘Assessing the impact of parameters
tuning in ensemble based breast Cancer classification’,
Health and Technology, 10(5), pp. 1239–1255. doi:
10.1007/s12553-020-00453-2.
Idri, A. and Abnane, I. (2017) ‘Fuzzy Analogy Based Effort
Estimation: An Empirical Comparative Study’, IEEE
CIT 2017 - 17th IEEE International Conference on
Computer and Information Technology, (Ml), pp. 114–
121. doi: 10.1109/CIT.2017.29.
Idri, A., Abnane, I. and Abran, A. (2018) ‘Evaluating
Pred(p) and standardized accuracy criteria in software
development effort estimation’, Journal of Software:
Evolution and Process, 30(4), pp. 1–15. doi:
10.1002/smr.1925.
Islam, M. M. et al. (2020) ‘Deep learning algorithms for
detection of diabetic retinopathy in retinal fundus
photographs: A systematic review and meta-analysis’,
Computer Methods and Programs in Biomedicine, 191,
p. 105320. doi: 10.1016/j.cmpb.2020.105320.
Jelihovschi, E. G. and Faria, J. C. (2000) ‘ScottKnott : A
Package for Performing the Scott-Knott Clustering
Algorithm in R’, The R Journal, pp. 1–6.
Kaur, H. et al. (2019) A genetic algorithm-based
metaheuristic approach to customize a computer-aided
classification system for enhanced screen film
mammograms, U-Healthcare Monitoring Systems.
Elsevier Inc. doi: 10.1016/b978-0-12-815370-3.00010-
4.
Kibirige, D. et al. (2019) ‘Understanding the manifestation
of diabetes in sub Saharan Africa to inform therapeutic
approaches and preventive strategies: a narrative
review’, Clinical Diabetes and Endocrinology, 5(1),
pp. 1–8. doi: 10.1186/s40842-019-0077-8.
Lahmar, C. and Idri, A. (2021) ‘On the value of deep
learning for diagnosing diabetic retinopathy’, Health
and Technology 2021, pp. 1–17. doi: 10.1007/S12553-
021-00606-X.
Ottoni, A. L. C. et al. (2020) ‘Tuning of reinforcement
learning parameters applied to SOP using the Scott–
Knott method’, Soft Computing, 24(6), pp. 4441–4453.
doi: 10.1007/s00500-019-04206-w.
Poolsawad, N., Kambhampati, C. and Cleland, J. G. F.
(2014) ‘Balancing class for performance of
classification with a clinical dataset’, Lecture Notes in
Engineering and Computer Science, 1(November), pp.
237–242.
Razzak, M. I., Naz, S. and Zaib, A. (2018) ‘Deep learning
for medical image processing: Overview, challenges
and the future’, Lecture Notes in Computational Vision
and Biomechanics, 26, pp. 323–350. doi: 10.1007/978-
3-319-65981-7_12.
Samreen, R. (2009) ‘Diabetes mellitus’,
Diabetes mellitus,
4(5), pp. 367–373. Available at: http://search.ebs
cohost.com/login.aspx?direct=true&db=cat02024a&A
N=kku.b1289339&site=eds-live&authtype=ip,uid&
scope=cite.
Sandler, M. et al. (2018) ‘MobileNetV2: Inverted Residuals
and Linear Bottlenecks’, Proceedings of the IEEE
Computer Society Conference on Computer Vision and
Pattern Recognition, pp. 4510–4520. doi:
10.1109/CVPR.2018.00474.
Shahin, E. M. et al. (2012) ‘Automated detection of diabetic
retinopathy in blurred digital fundus images’, 2012 8th
International Computer Engineering Conference:
Today Information Society What’s Next?, ICENCO
2012, (May 2014), pp. 20–25. doi:
10.1109/ICENCO.2012.6487084.
Sharma, J. et al. (2003) ‘Symbiotic seed germination and
mycorrhizae of federally threatened Platanthera
praeclara (Orchidaceae)’, American Midland
Naturalist, 149(1), pp. 104–120. doi: 10.1674/0003-
0031(2003)149[0104:SSGAMO]2.0.CO;2.
Simonyan, K. and Zisserman, A. (2015) ‘Very deep
convolutional networks for large-scale image
recognition’, 3rd International Conference on Learning
Representations, ICLR 2015 - Conference Track
Proceedings, pp. 1–14.
Szegedy, C. et al. (2016) ‘Rethinking the Inception
Architecture for Computer Vision’, Proceedings of the
IEEE Computer Society Conference on Computer
Vision and Pattern Recognition, 2016-Decem, pp.
2818–2826. doi: 10.1109/CVPR.2016.308.
Szegedy, C. et al. (2017) ‘Inception-v4, inception-ResNet
and the impact of residual connections on learning’,
31st AAAI Conference on Artificial Intelligence, AAAI
2017, pp. 4278–4284.
Wong, K. K. L., Fortino, G. and Abbott, D. (2020) ‘Deep
learning-based cardiovascular image diagnosis: A
promising challenge’, Future Generation Computer
Systems, 110(xxxx), pp. 802–811. doi:
10.1016/j.future.2019.09.047.
Xu, Y. and Goodacre, R. (2018) ‘On Splitting Training and
Validation Set: A Comparative Study of Cross-
Validation, Bootstrap and Systematic Sampling for
Estimating the Generalization Performance of
Supervised Learning’, Journal of Analysis and Testing,
2(3), pp. 249–262. doi: 10.1007/s41664-018-0068-2.
Yau, J. W. Y. et al. (2012) ‘Global prevalence and major
risk factors of diabetic retinopathy’, Diabetes Care,
35(3), pp. 556–564. doi: 10.2337/dc11-1909.
Zerouaoui, H. and Idri, A. (2021) ‘Reviewing Machine
Learning and Image Processing Based Decision-
Making Systems for Breast Cancer Imaging’, Journal
of Medical Systems, 45(1). doi: 10.1007/s10916-020-
01689-1.
BIOIMAGING 2022 - 9th International Conference on Bioimaging
62
