
Improved Blood Vessels Segmentation of Retinal Image of Infants
Vijay Kumar
1
, Het Patel
1
, Kolin Paul
1
, Abhidnya Surve
2
, Shorya Azad
2
and Rohan Chawla
2
1
Khosla School of Information Technology, Indian Institute of Technology, Delhi, India
2
Dr. Rajendra Prasad Centre for Ophthalmic Sciences, All India Institute of Medical Sciences, Delhi, India
Keywords:
Fundus Image, Retinopathy of Prematurity (ROP), Computer Aided Diagnosis (CAD), Generative Adversarial
Network (GAN), U-Net, Blood Vessels Segmentation, Deep Convolutional Neural Network (DCNN).
Abstract:
Retinopathy of prematurity (ROP) is the leading cause of blindness in premature babies worldwide. ROP is
quantified through the structural information of the retinal vessel map, such as vessels width, tortuosity and
extent. Therefore, the accuracy of quantitative studies depends on the quality of the segmented blood vessels’
map. Fundus images used for neonatal eye examination are prone to many artefacts and noises due to patient
movement, erratic illumination, improperly focused camera sensor, etc. Existing vessel segmentation algo-
rithms work well on retinal images of adults but fail to detect underdeveloped vessel structures of neonatal’s
fundus images. At the same time, the unavailability of fundus images of infants has hindered the development
of the data-driven methods for vessel segmentation. This work proposes a new Deep Convolutional Neural
Network (DCNN) based vessels segmentation system for the screening for the neonatal eye disorder ROP. The
proposed system uses a DCNN, Generative Adversarial Network (GAN) Pix2Pix or U-Net for vessel segmen-
tation. Using publicly available fundus image datasets, we used an efficient and robust training procedure for
the proposed system and tested them with preterm neonatal eye images from a local hospital. Experimental
results show that the proposed system allows better screening of ROP with robustness to noises and inter-class
variation. It has achieved an average accuracy of 96.69% for vessels segmentation and a Dice coefficient
between 0.60 and 0.64. Our system is able to achieve an accuracy of 88.23% for Zone-1 case of ROP.
1 INTRODUCTION
Retinopathy of prematurity (ROP) is the leading cause
of blindness in premature infants worldwide (Orga-
nization et al., 2019). ROP is caused by the abnor-
mal development of retinal blood vessels in a preterm,
light-weight infant (Gilbert et al., 2021). The In-
ternational Classification of ROP (ICROP) classifies
the ROP disease severity based on vascular struc-
ture, anatomical variation, and extent (Kumar et al.,
2021). One such vascular activity is called Plus dis-
ease caused by changes in structural feature of blood
vessels, such as vessel dilation and tortuosity (Orga-
nization et al., 2019). Analysis of retinal vessel thus
holds great potential to assist the early diagnostics and
treatment of the ROP and Plus diseases. In addition,
it is also helpful to understand the improvement and
severity of the disease (Gilbert et al., 2021). Hence,
analysis of retinal vessel networks provides accurate
information of ROP disease conditions. During the
treatment of ROP, it is essential to accurately mea-
sure the width and tortuosity of the retinal vessels by
the Ophthalmologist and computer-assisted diagno-
sis (CAD) software to efficiently understand and de-
cide the line of treatment (Gilbert et al., 2021; Fielder
et al., 2019).
Therefore, an automated vessel segmentation
technique that accurately classifies and segments ves-
sels from the fundus image is required. However, the
structure and coloration of vessels depend on the reti-
nal imaging procedure, the surrounding condition and
the subject’s ocular condition, which are highly dy-
namic. Due to this, developing a correct and effective
technique for the segmentation of vessels becomes
more complex and challenging for the image process-
ing and computer vision communities. Specially, fun-
dus images uses for neonatal eye examination ROP
and Plus disease suffer from artifacts and noise caused
by patient movement, irregular illumination (under-
exposure), poor contrast, eye media capacities, iris
reflection and misalignment of device, etc. (Fielder
et al., 2019). Existing algorithms of blood vessels
segmentation have shown excellent performance with
adult persons’ retinal images and are based on im-
age processing, computer vision and machine learn-
ing (ML). In recent years, data driven Deep Convolu-
142
Kumar, V., Patel, H., Paul, K., Surve, A., Azad, S. and Chawla, R.
Improved Blood Vessels Segmentation of Retinal Image of Infants.
DOI: 10.5220/0010849800003123
In Proceedings of the 15th International Joint Conference on Biomedical Engineering Systems and Technologies (BIOSTEC 2022) - Volume 5: HEALTHINF, pages 142-153
ISBN: 978-989-758-552-4; ISSN: 2184-4305
Copyright
c
2022 by SCITEPRESS – Science and Technology Publications, Lda. All rights reserved
tional Neural Networks (DCNN) improve the perfor-
mance of various computer vision task, such as object
detection, classification, segmentation, and tracking
significantly even surpass the human experts ability
in many datasets (Gilbert et al., 2021). DCNN mod-
els such as Generative Adversarial Networks (GAN),
U-Net or its variant have significantly high accuracy
with the publicly available datasets of young person
for vessels segmentation task (Wang et al., 2021; Guo
et al., 2020b). These approaches, on the other hand,
are unable to distinguish and identify the small, weak,
and dilated branches of blood arteries. The vessels in
a premature newborn’s retina are smaller, thinner, and
dilated, and the retina is not fully matured. Current
methods for detecting and segmenting the blood ves-
sels of a newborn’s retina are ineffective. Deep learn-
ing (DL) models are also data-driven techniques that
necessitate a large quantity of data for training, test-
ing, and validation. There are no large public retinal
imaging datasets available for the preterm newborn.
This study presents a DL-based technique for seg-
menting retinal vessels during ROP examination us-
ing the existing DCNN models, GAN and U-Net.
These models are trained and fine-tuned using publi-
cally available image datasets of individuals with di-
abetic retinopathy (DR), glaucoma, and age-related
macular degeneration (AMD). The trained model is
tested on manually annotated neonatal retinal images
obtained from a hospital. Furthermore, for better di-
agnostic accuracy, our DL-based segmentation tech-
nique for ROP screening can be applied in works such
as (Kumar et al., 2021) for vascular segmentation.
The rest of the paper is organized as follows. Sec-
tion 2 presents the recent work related to blood ves-
sels segmentation. Section 3 gives the design details
of the proposed DL-based method for vessels seg-
mentation. Section 4 presents results, which comes at
different stages of the proposed technique’s pipeline.
Finally, Section 5 summaries the proposed tech-
nique’s shortcomings and future works.
2 RELATED WORK
Over the past several years, ophthalmologists have
been using retinal vessels to investigate and classify
retinal diseases. In this, the ophthalmologist exam-
ines the symptoms to image retinal vessels related to
the disease. For its investigation, two types of meth-
ods are used. One of them is manual screening. This
process is a highly biased and stressful exercise.
To overcome these limitations, ophthalmologists
and researchers have chosen CAD techniques in their
practice for medical diagnostic applications to de-
Table 1: Works related to blood vessel segmentation of reti-
nal images using DNN.
Method Dataset(Acc) Author
RV-
GAN
DRIVE (0.9790),
CHASE DB1
(0.9914), STARE
(0.9887)
(Kamran
et al., 2021)
U-Net DRIVE (0.9712) (Uysal et al.,
2021)
SA-
UNet
DRIVE (0.9698),
CHASE DB1
(0.9905)
(Guo et al.,
2020a)
IterNet DRIVE (0.9816),
CHASE DB1
(0.9851)
(Li et al.,
2020)
tect and track vessel structure. The CAD-based tech-
niques use image processing, computer vision, and
machine learning-based algorithms to analyze retinal
vessels and diagnose associated eye diseases. The
CAD-based methodologies are classified into two
sub-groups, one is a rule-based CAD system, and an-
other one is data-driven CAD system techniques. The
rule-based systems applications have been developed
for the standard protocols and procedures that are be-
ing formulated by the experts mainly deals with ves-
sel enhancement and segmentation. As mentioned
in previous article, some popular rule-based tech-
niques are model-based adaptive thresholding, en-
hance chain coding, active contours, matched filter
responses, morphological operation, entropy filtering,
Gabor wavelet transform, and so on (Megrabov et al.,
; Kumar et al., 2021; Krestanova et al., 2020; Kubicek
et al., 2019). Minor modifications or updates to the
CAD system that must be updated from scratch, on
the other hand, are manual and complex in rule-based
screening techniques. Several data-driven techniques
for medical applications have been developed in the
past few years, particularly for identifying, segment-
ing, and monitoring retinal blood vessels. Machine
learning (ML) and deep learning (DL) are data-driven
algorithms that excel at image segmentation, object
detection, and tracking in many medical applications.
Recently, researchers have developed many vessel ex-
traction techniques based on DCNN, which are pre-
sented in Table 1. These vessel segmentation ap-
proaches perform well on publicly available datasets
of young people’s retinal scans but not on infant reti-
nal images. As shown in Figure 1, the retinal blood
vessel structure does not grow properly in the preterm
infant fundus image. As a result, the blood vessels
of the preterm neonatal retina are blurred, and tra-
ditional vessel segmentation methods that work well
with publicly available retinal image datasets do not
Improved Blood Vessels Segmentation of Retinal Image of Infants
143
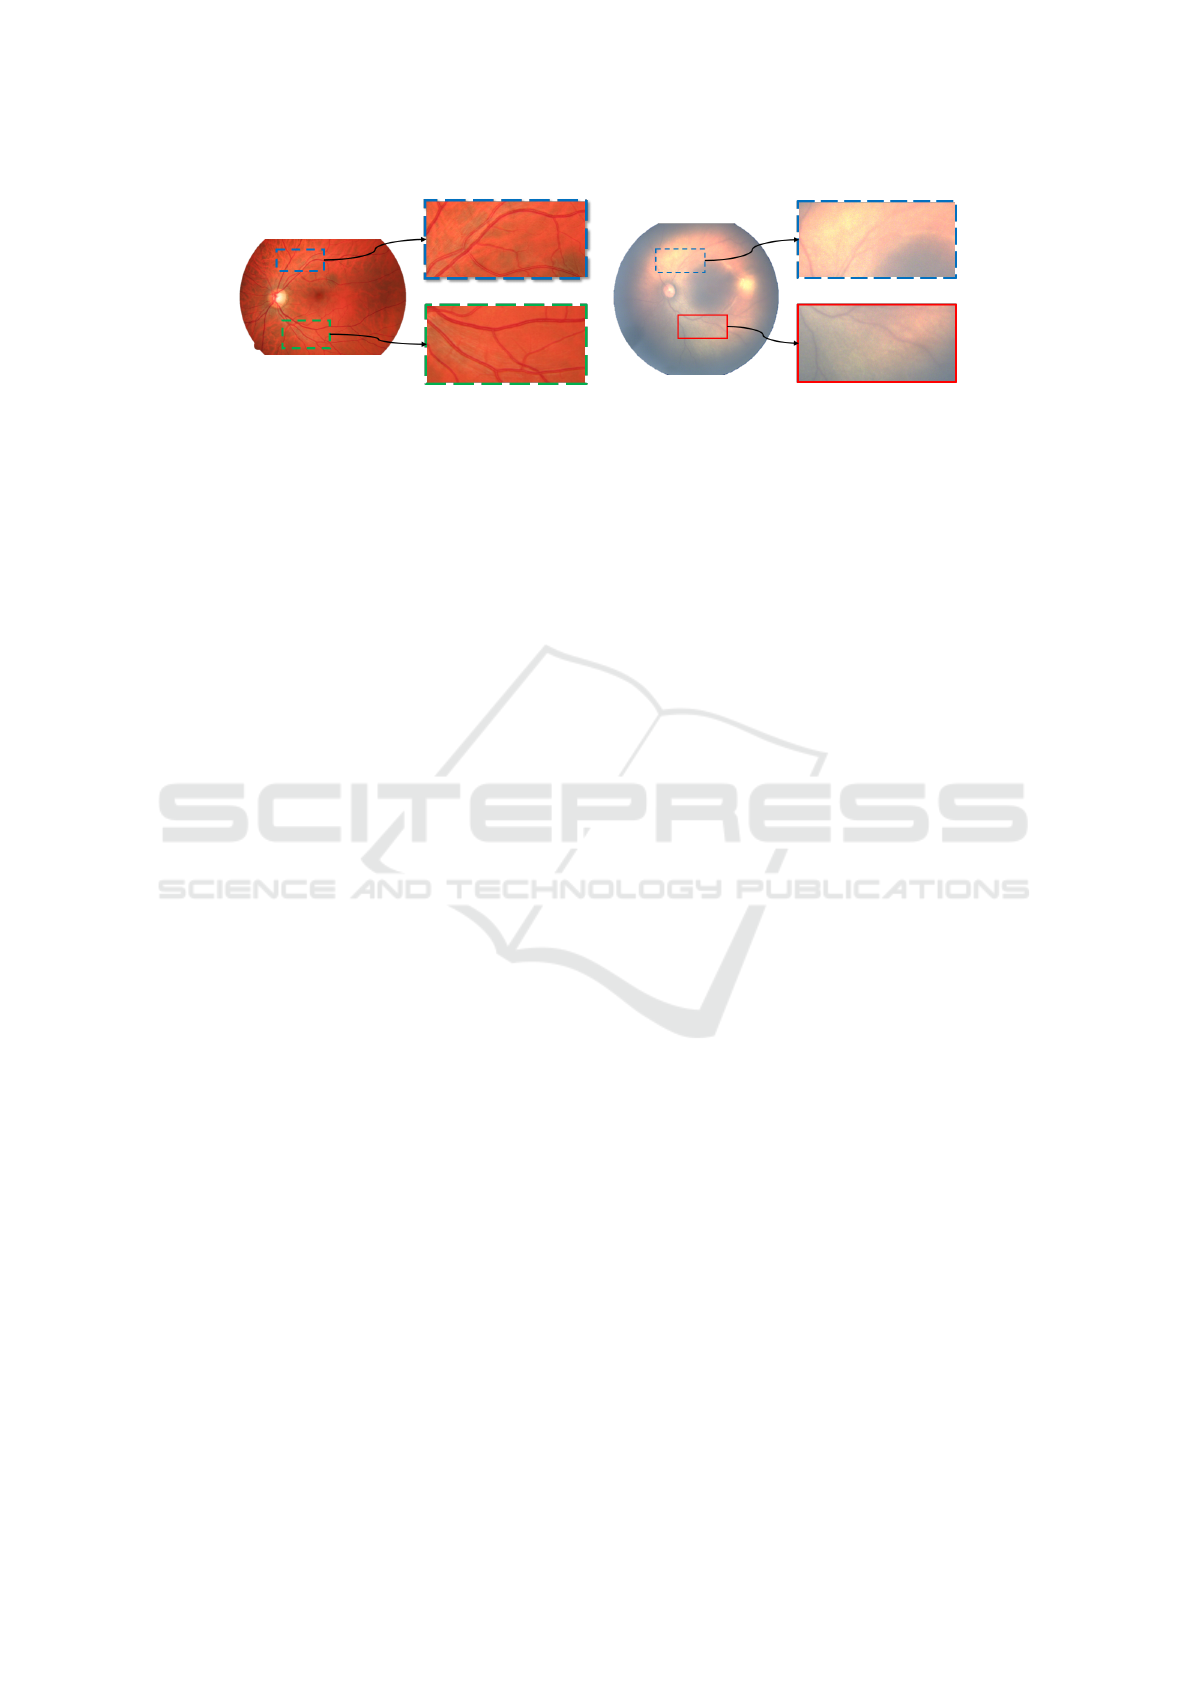
(a) Normal fundus image.
(b) Neonatal fundus image.
Figure 1: Analysis of retinal vessels segmentation problem. (a) Retinal images of elderly person and the enlarge patches. (b)
Neonatal fundus image and the enlarge patches.
work with the infant’s retinal images.
Recently, (Yildiz et al., 2020; Luo et al., 2020)
developed DCNN-based vessel segmentation tech-
niques to segment the preterm infant retinal vessels
map accurately. Here the authors used the DCNN
model U-Net to segment vessels, which segment the
exact vessels map of the retina image of the prema-
ture infants. The training dataset for the DL model
must be carefully chosen because it affects the sys-
tem’s performance. These DL systems include train-
ing datasets from specific populations influenced by
gender, race, age, and other factors.
To address the above problems, we have proposed
a DL-based system for vessels extraction, which can
operate in an environment where large-scale histori-
cal datasets are unavailable, and the accuracy of the
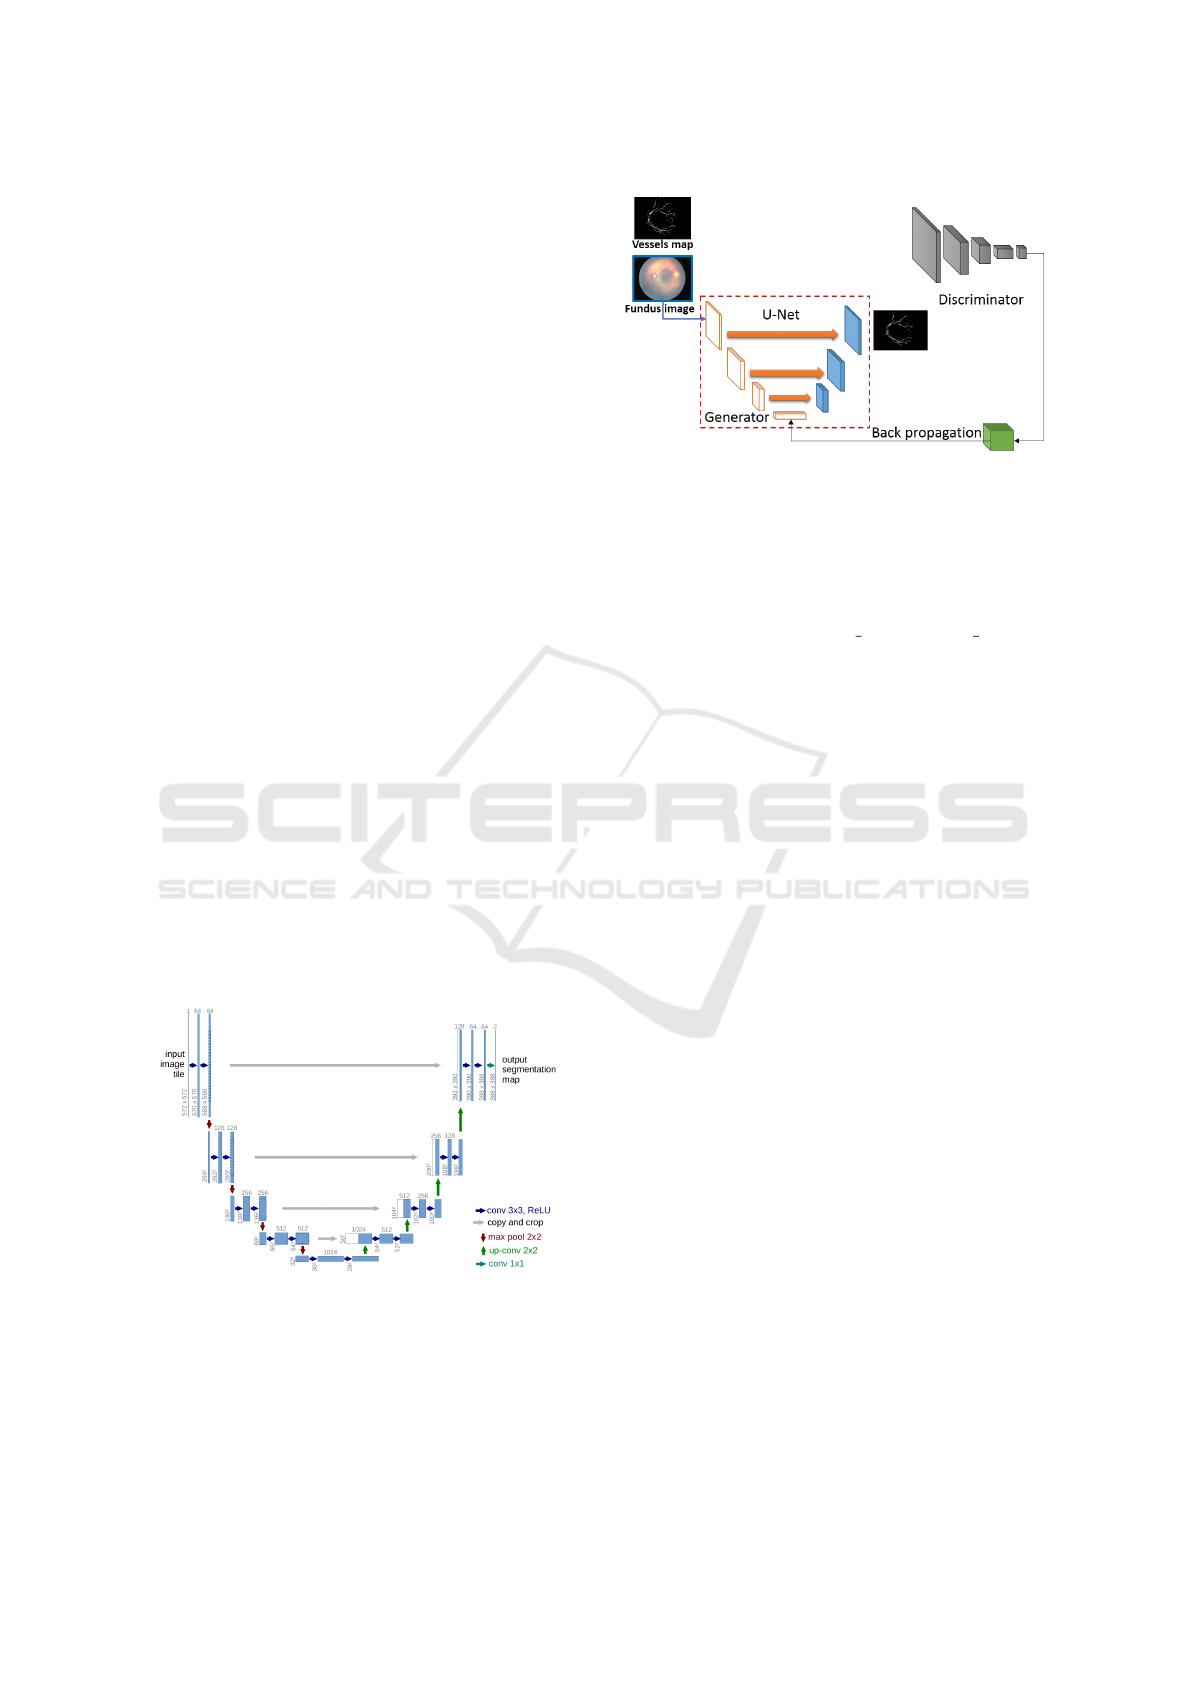
results is highly essential. The proposed system ar-
chitecture is shown in Figure 2. It mainly consists
of three sections named image preprocessing, DCNN
model training and testing.
3 PROPOSED APPROACH
The detailed architecture of the proposed system is
shown in Figure 2. It consists of four functional units:
• Fundus imaging (or retinal scanning) unit.
• Image pre-processing.
• Blood vessels segmentation.
• Post-processing.
The Fundus Imaging Unit is responsible for taking
and handling retinal scan images or videos used for
retinal disease diagnosis and screening information.
Ophthalmologists use a fundus camera to examine a
young person’s retina. However, the RitCam-3 shutter
(Clarity MSI, Pleasanton, CA, USA) wide-field imag-
ing fundus camera is used for ROP screening. A fun-
dus image is a color image of the retinal membrane
of the eye taken with a fundus camera that ophthal-
mologists use to diagnose and screen eye diseases.
Scanned images or video data are noisy and prone
to multiple errors due to uneven illumination, mo-
tion blur and sharp and sudden changes in the signal.
Therefore, there is a need to improve the quality of
these images. The second functional unit is the pre-
processing unit, which uses image reconstruction and
enhancement algorithms to reduce the impact of noise
and improve image quality.
The third functional unit processes the pre-
processed image using a DL-based model to segment
the vessels map from the fundus image. In this study,
we have considered two state-of-the-art pre-trained
DL models: U-NET and GAN for the segmentation
task. U-Net widely uses for image segmentation ap-
plications in the medical field. GAN is a machine
learning framework inspired by game theory, in which
two models, a generator and a discriminator, are com-
peting with each other simultaneously, making each
other more effective. The DL model is trained with a
publicly available fundus image dataset listed in Ta-
ble 2 and then used for blood vessel segmentation of
neonatal fundus images.
After that, the fourth functional unit is the post-
processing stage, which uses image processing and
computer vision-based algorithms to extract disease-
related features of the retina such as vessel width,
tourist, extent, etc., from the segmented vessel map.
The results exhibiting the usability of the proposed
approach for Zone-1 ROP screening are discussed in
Section 4.6.
3.1 Data Preparation
In this study, we have used a public dataset with a la-
belled blood vessels map for training and testing of
both DL-models (i.e., GAN and U-net). In the vali-
dation stage, we have used the local ROP dataset of
neonatal retinal images (Kumar et al., 2021). These
images are raw, noisy and their pre-labelled vessel
masks are also not available. However, verification of
its performance requires a ground truth or gold stan-
dard. Therefore, we manually labelled preterm in-
HEALTHINF 2022 - 15th International Conference on Health Informatics
144
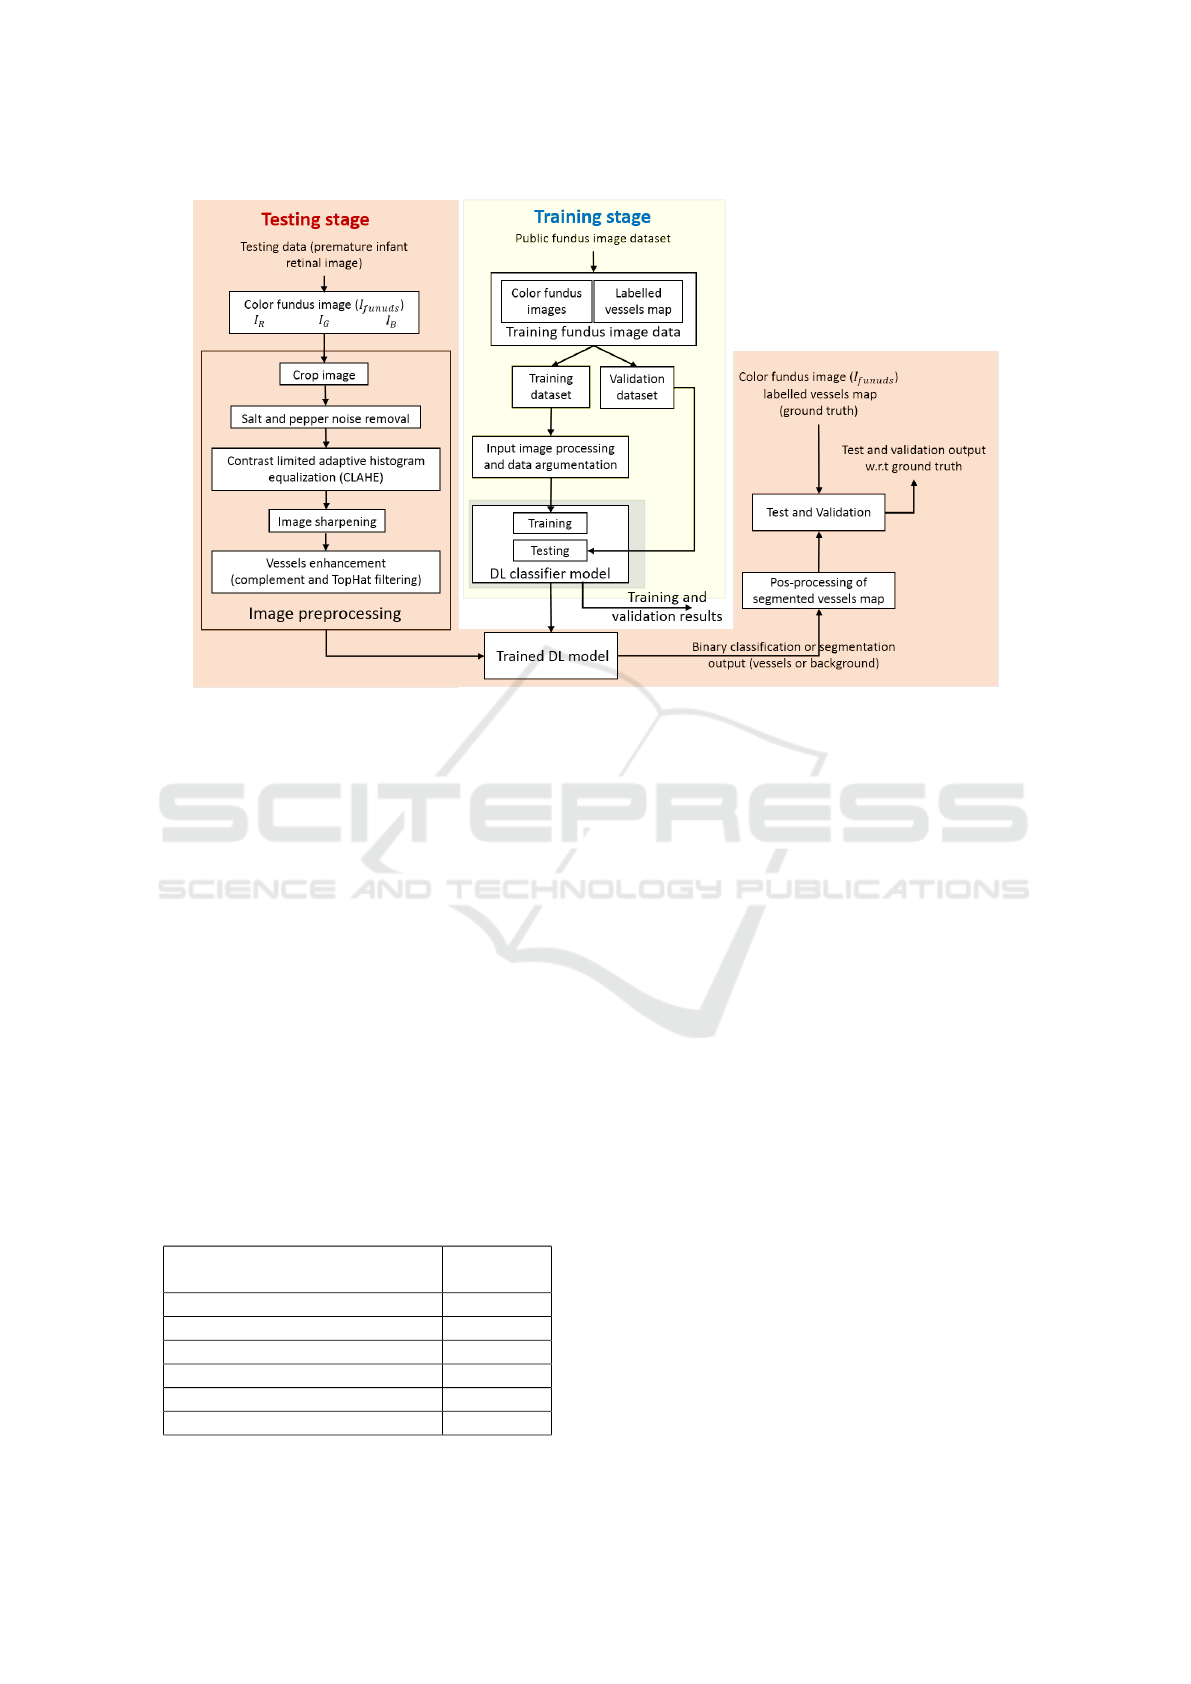
Figure 2: Block diagram representation of the full flow of Deep Learning based vessels segmentation.
fant retinal image’s blood vessels to create the vessel
mask. The labelling process is time consuming and
laborious method. Hence, we have labelled only six
image’s blood vessels.
For the vessel extraction module output label, i.e.
vessel map is required and generating these labels
manually for the local dataset is not feasible, so the
dataset for this task with the publicly available dataset
with vessel maps available was collected and trained
a DL based model which can generalize to the images
from local dataset. Details of the compiled datasets
are shown in Table 2
3.1.1 Data Pre-processing and Noise Modeling
Now to train DL based models for vessel segmenta-
tion like GAN and U-Net, the dataset mentioned in
Table 2 was used. The key challenge in this is that
the training dataset and test dataset is very different in
terms of image quality and nature of vessels in the im-
Table 2: Dataset for Vessel Segmentation.
Dataset Name Number
of Images
ARIA(Bankhead et al., 2012) 143
DRHAGIS(Holm et al., 2017) 40
DRIVE(Staal et al., 2004) 20
HRF(Budai et al., 2013) 45
STARE(Hoover et al., 2000) 20
Total 288
age as the collected images for training is from stan-
dard datasets, which contains images with very high
contrast for the vessels. So in order to make these
models work on ROP images, training of these mod-
els should be carried out such that they can generalize
well for the noise and low contrast images as well.
So in order to make this model work, there needs
to be some work done to replicate the noise and arte-
facts in the local dataset’s image in the standard train-
ing dataset. So a noise modelling approach is pro-
posed in which noise is added to the input image and
also done some other preprocessing steps to make the
training dataset(i.e. compiled dataset) more similar
to the test dataset (i.e. local dataset). Table 3 sum-
marises different functions used in noise modelling.
The flowchart of the noise modelling is shown in Fig-
ure 3. Results of this noise modelling based approach
can be visualized in Figure 4.
3.1.2 Data Augmentation by Mosaic Generation
One more experiment was carried out to increase the
train dataset size by generating a synthetic dataset
from the existing 288 images from the standard
dataset. This synthetic dataset has been generated by
following these steps. This experiment was carried
out because the vessel segmentation task does not re-
quire that much global information, and also even if
it would require then also normal DCNN layers em-
ployed by the proposed model is not efficient in con-
veying information over longer spatial distances, or
Improved Blood Vessels Segmentation of Retinal Image of Infants
145
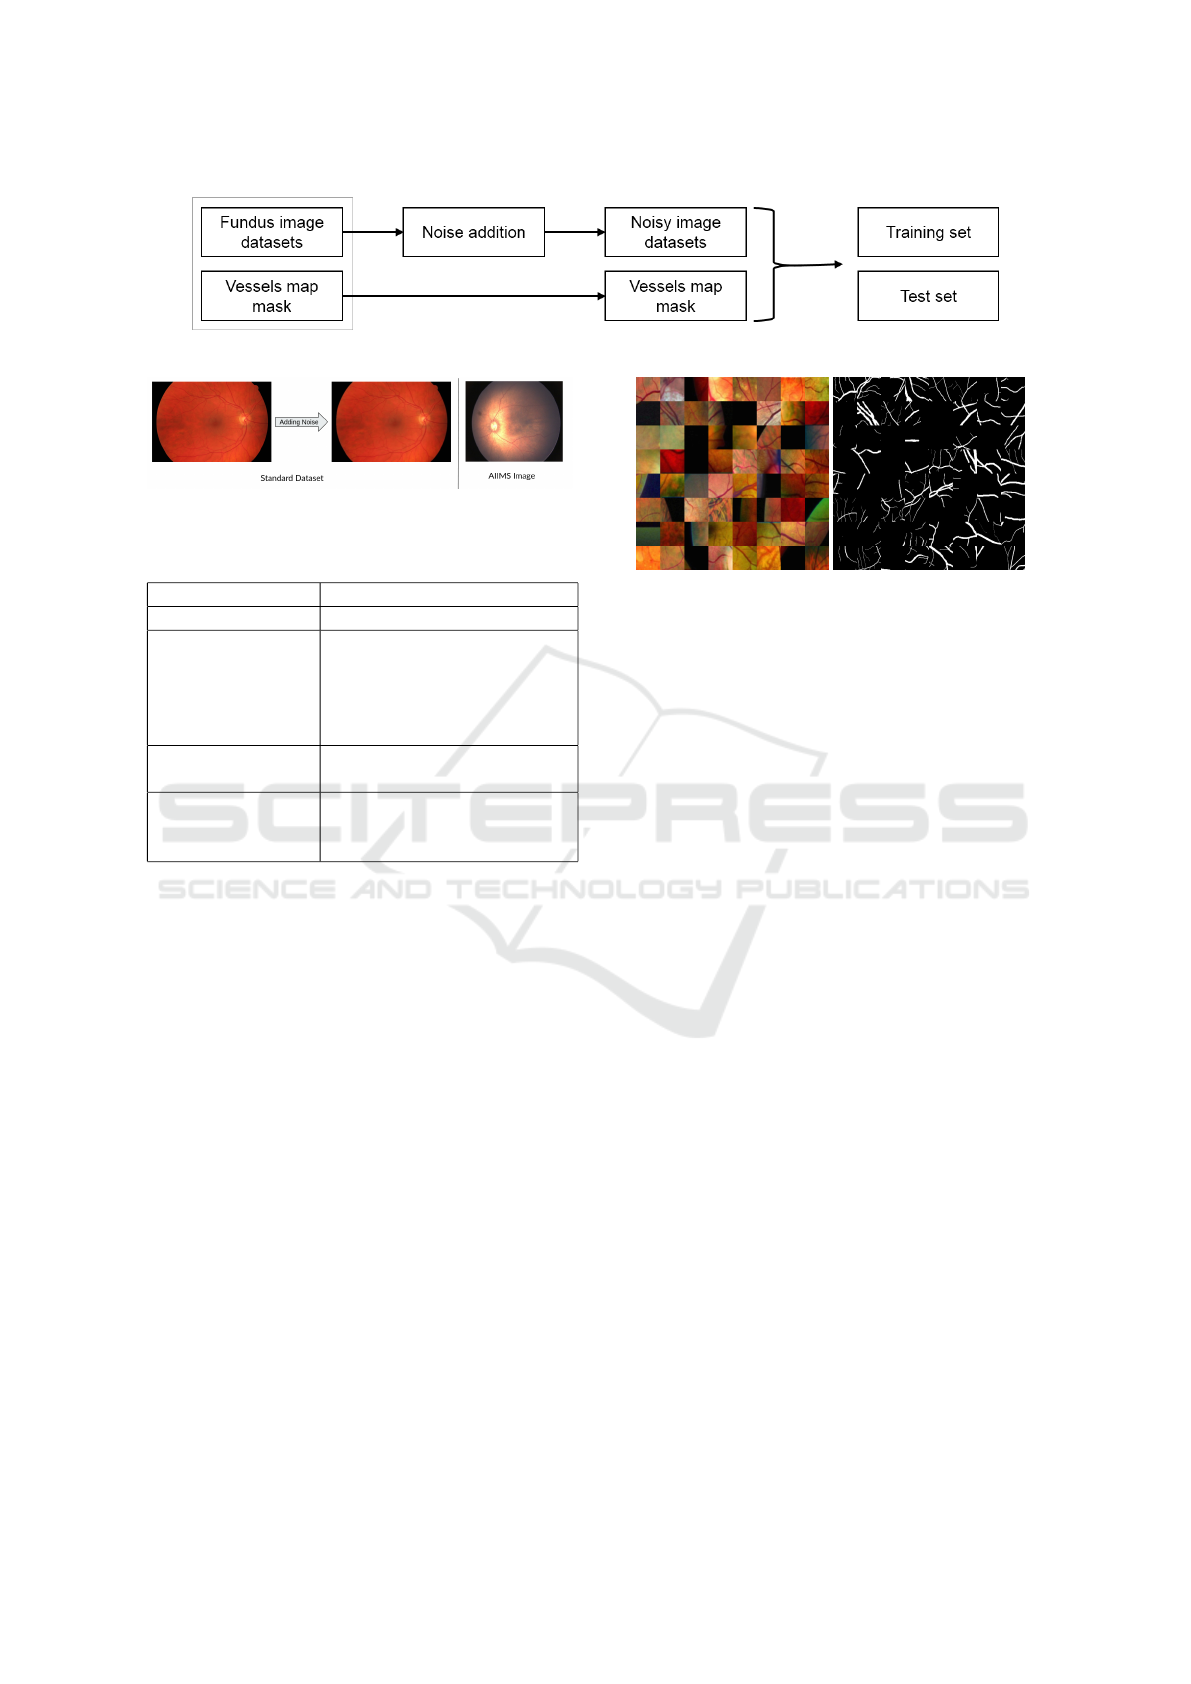
Figure 3: Training data preparation steps using noise modeling.
Figure 4: Results of Noise modeling and comparison with
local dataset.
Table 3: Noise modeling functions.
Noise modeling Description
crop Image resize to 512x512
CLAHE or
CLAHE(3.5,
(5,5))
Contrast Limited Adap-
tive Histogram Equalization
(CLAHE) operation with Cli-
pLimit 3.5 and tileGridSize
is (5,5).
medianBlur(3) Median blur operation with
Kernel size is 3
noise or Gaussi-
naNoise((5,5),0)
Gaussian smoothing function
with Kernek size (5,5) and
standard deviation is Zero.
one can use dilated convolution layers which would
require a much deeper network. So as in vessel seg-
mentation, the model is mostly working with local in-
formation, so such augmentation methods can be use-
ful to increase our training sample size, which can re-
sult in a better-generalized model.
1. Resize image and vessel mask to 1024x1024.
2. Break each image into 128x128 size smaller grids
which will create a pool of 18432 smaller partial
images.
3. Then takes 64 random samples to create one
1024x1024 mosaic image and create 500 such im-
ages to create a training dataset.
A sample image and its corresponding vessel map
used while training with this augmented dataset is
shown in Figure 5.
3.2 Image Pre-processing
The retinal images collected by the ophthalmologist
during the retinal examination of premature infants
are in a raw format and suffer from various noises,
such as motion blur, irregular illumination, sudden
(a) Input Image. (b) Vessel Map.
Figure 5: Sample image from augmented dataset.
disturbances in image signals, etc. Noise affected im-
ages may reduce the accuracy of the proposed system
result. Therefore, the image quality needs to be en-
hanced before these images can be used for disease
detection. Preprocessing an image makes the retinal
blood vessels better viewable for subsequent segmen-
tation.
A color fundus image of a premature infant
(shown in the Figure 1) is pale yellow with a map
of blurred blood vessels, in which blood vessels can-
not be easily seen with the naked eye. A color image
frame has three color channels: red (R), green (G)
and blue (B). The R-channel is saturated, while the
B-channel is underexposed. Because of this, the dif-
ference between the luminance of blood vessels and
the background in the R and B channel’s image is
indistinguishable. In G-channel, these features are
clear and distinguishable for biomedical applications.
Therefore, we preferred the G-channel (or gray im-
age) and used it in further imaging experiments. We
also used a mean filter and CLAHE to improve color
image quality to reduce the effects of uneven illumi-
nation and motion blur.
3.3 Vessels Segmentation
Retinal blood vessels are the essential ocular system
that supplies oxygen-rich blood to the cells of the
retina. The small dysfunctioning, blockage or leak-
age of retinal blood supply to retinal cells cause ocular
disorders because essential oxygen in that section of
the retina is not reached. To understand and diagnose
the effect ophthalmologist often uses the retinal vas-
cular structure in diseases such as diabetic retinopa-
HEALTHINF 2022 - 15th International Conference on Health Informatics
146
thy, hypertension, AMD and ROP. Especially for ROP
and Plus diseases, ICROP classifies the disease extent
and severity based on the retinal vessels character-
istics such as tortuosity, width, extent, branches and
branches angles (Gilbert et al., 2021; Kumar et al.,
2021). Precise measurement of vessel characteristics
by ophthalmologists or CAD software decides the ef-
fectiveness of diagnosing and investigating ROP and
Plus disease (Ataer-Cansizoglu et al., 2015).
Deep learning is a technique in which a DCNN
network is trained through historical pathological in-
formation related to various diseases. In the following
section, we have introduced two state-of-the-art DC-
NNs for vessel segmentation: U-Net and GAN, which
we have used in the proposed system.
3.3.1 U-Net
The architecture of the U-Net model is shown in
Figure 6; it is similar to an encoder-decoder net-
work. This network works well with biomedical
segmentation as this model was designed such that
it provides quality segmentation results with few
training examples. The authors of (Ronneberger
et al., 2015) have achieved this by proposing to
replace pooling operators with up-sampling layers,
due to which the model has a large number of fea-
ture channels, which allow the network to propa-
gate context information to higher resolution lay-
ers. This model uses the simple pixel-wise soft-max
p
k
(x) = exp(a
k
(x))/(Σ
K
k‘=1
exp(a
k‘
(x)) loss combined
with cross-entropy loss E. For more detailed archi-
tecture, refer to the paper (Ronneberger et al., 2015).
E = Σ
xεΩ
w(x)log(p
l(x)
(x)) (1)
Figure 6: Architecture of U-Net (Ronneberger et al., 2015).
3.3.2 Pix2Pix GAN Model
A conditional GAN based model called Pix2Pix
model developed by (Isola et al., 2018) in 2016,
Figure 7: Pix2Pix GAN architecture in training phase.
which uses U-Net based model as a generator and an-
other CNN model as a discriminator in the GAN train-
ing process (shown in Figure 7). These conditional
GAN based models work in a way that discrimina-
tor D learns to classify between fake (synthesized by
the generator) and real input image, vessel map tu-
ples and Generator G learns to fool the discriminator.
The Objective function to train the GAN is made up
of two parts, Conditional GAN loss L
C
GAN
and tradi-
tional L1 loss L
L
1
which are mentioned in the equa-
tion below.
L
C
GAN
(G,D) = E
x,y
[logD(x, y)]+
E
x,z
[log(1 − D(x,D(x,z)))] (2)
L
L
1
(G) = E
x,y,z
[ky − G(x, z)k
1
] (3)
And final objective function is combination of both of
these.
G
∗
= arg min
G
max
D
L
C
GAN
(G,D) + λL
L
1
(G) (4)
4 RESULTS
The proposed system and its different modules are im-
plemented and tested on a workstation with Intel(R)
Xeon(R) 40-Core CPU E5-2630 v4 @ 2.20GHz with
64 GB RAM and 8 GB NVIDIA GeForce GTX 1070
GPU.
In this section, we discuss the usability of the pro-
posed method of vessels segmentation for the infants
retinal color image capture through the RetCam. The
section uses qualitative as well as quantitative meth-
ods to prove the significance of the proposed methods.
4.1 Evaluation Metrics
We have used the following evaluation metrics to
evaluate the quality of the segmented blood vessels
map:
Improved Blood Vessels Segmentation of Retinal Image of Infants
147
1. Accuracy: The accuracy of the segmented result
is the percentage of pixels correctly classified as
True. The given equation calculates accuracy:
Accuracy =
(T P + T N)
(T P + T N + FP + FN)
(5)
Where TP: True Positive, TN: True Negative, FP:
False Positive and FN: False Negative are calcu-
lated to measure the effect of the classifier during
pixel classification as foreground or background.
2. Root Mean Square Error (RMSE): This met-
ric used the non-binary images generated by the
model before the binary threshold is applied, and
this finds the root of the mean squared error in
these probabilities. This metric helps us find out
how confident our model is. RMSE is calculated
by given equation:
RMSE =
s
1
N
N
∑
i=1
(y
i
− ˆy
i
)
2
(6)
Where,
∑
= summation (“add up”), y
i
= actual im-
age pixel, ˆy
i
= predicted image pixel and N = total
number of image pixels.
3. Peek Signal to Noise Ratio (PSNR): This func-
tion is used mainly in signal processing and it cor-
relates to the RMSE. Formulae for PSNR is as fol-
lows.
PSNR = 20log
10
(MAX
I
) − 10log
10
(MSE) (7)
where, MSE = Mean Squared Error = (RMSE)
2
and MAX
I
= 255, as image pixel has max value of
255.
4. Structural Similarity Index (SSIM): The SSIM
index is a method for measuring the similarity
between two images. The SSIM index can be
viewed as a quality measure of one of the images
being compared, provided the other image is re-
garded as of perfect quality. This method helps us
find out the quality of the index in terms of how
similar the structure is. Detailed explanation for
this metric can be found in (Wang et al., 2004).
5. Dice Coefficient: The Dice coefficient is simi-
larity measure used to evaluate the segmentation
task. Formula for the Dice coefficient is as fol-
lows:
Dice coefficient =
2 ∗ Area of overlap
Total pixels combined
(8)
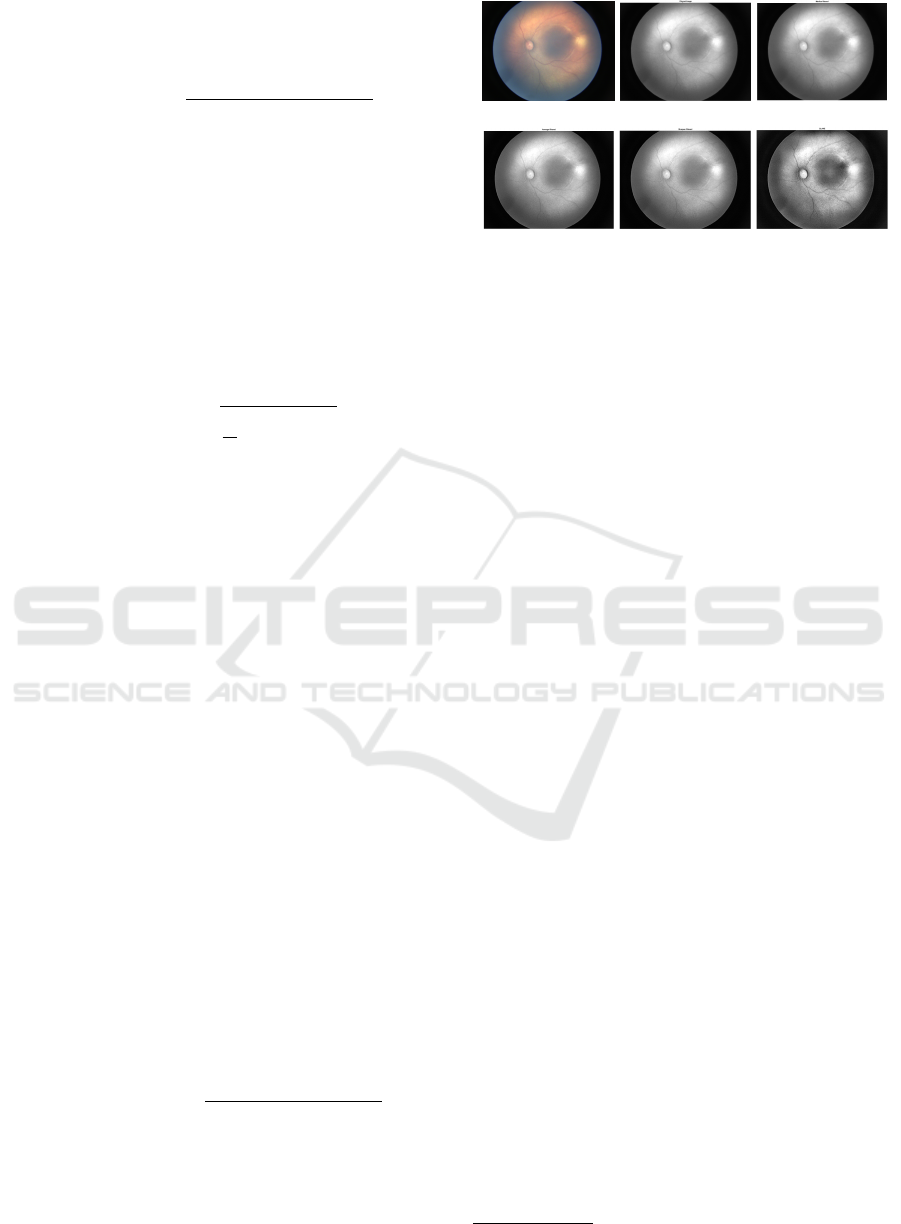
4.2 Pre-processing of Fundus Images
We select the green channel (I
g
) for analysis since
it contains maximum contrast between blood vessels
(a) Original.
(b) Green channel.
(c) Median filter.
(d) Average filter.
(e) Sharpen.
(f) Enhanced.
Figure 8: Output images of different stages of preprocessing
of original color (RGB) image.
and background. Further, in preprocessing stage, we
have to use a median filter to remove the effect of
impulse noises. Impulse noise can be generated by
sharp and sudden changes in image signal during ac-
quisition. The average filter is used in the next stage,
which will be reduced the effect of intensity variations
across the neighbouring pixels. Further, sharping and
CLAHE are used to enhance the image quality, as
shown in the preprocessing results in Figure 8. In the
sharpening filter, we have used unsharp masking with
the standard deviation of Gaussian low pass filter is
4 and strength of sharpening effect is 1.0. Contrast-
limited Adaptive Histogram Equalization (CLAHE)
is used to enhance the contrast of an image by trans-
forming the values in the intensity image. Here, we
have specified the number of tiles in a row, column
and contrast enhance limit is 8 × 8 and 0.005 respec-
tively and remaining all parameters such as the num-
ber of bins for histogram (= 256), output image in-
tensity range (= 0 to 255), histogram distribution type
(= uni f orm), and distribution parameters (= 0.4) are
selected default value of MATLAB R2020b CLAHE
1
function.
4.3 DL-Model Training and Testing
Deep learning is a technique, in which DCNN model
get trained through the historical labelled images re-
lated to pathological information related to different
disease. In the following section, we have discussed
two state-of-art DL-based networks for vessels seg-
mentation.
4.3.1 GAN based Approach
Now after preparing the data by noise modeling and
data augmentation, a conditional-GAN based model
called pix2pix (Isola et al., 2018) was trained.
1
mathworks.com/help/images/ref/adapthisteq
HEALTHINF 2022 - 15th International Conference on Health Informatics
148
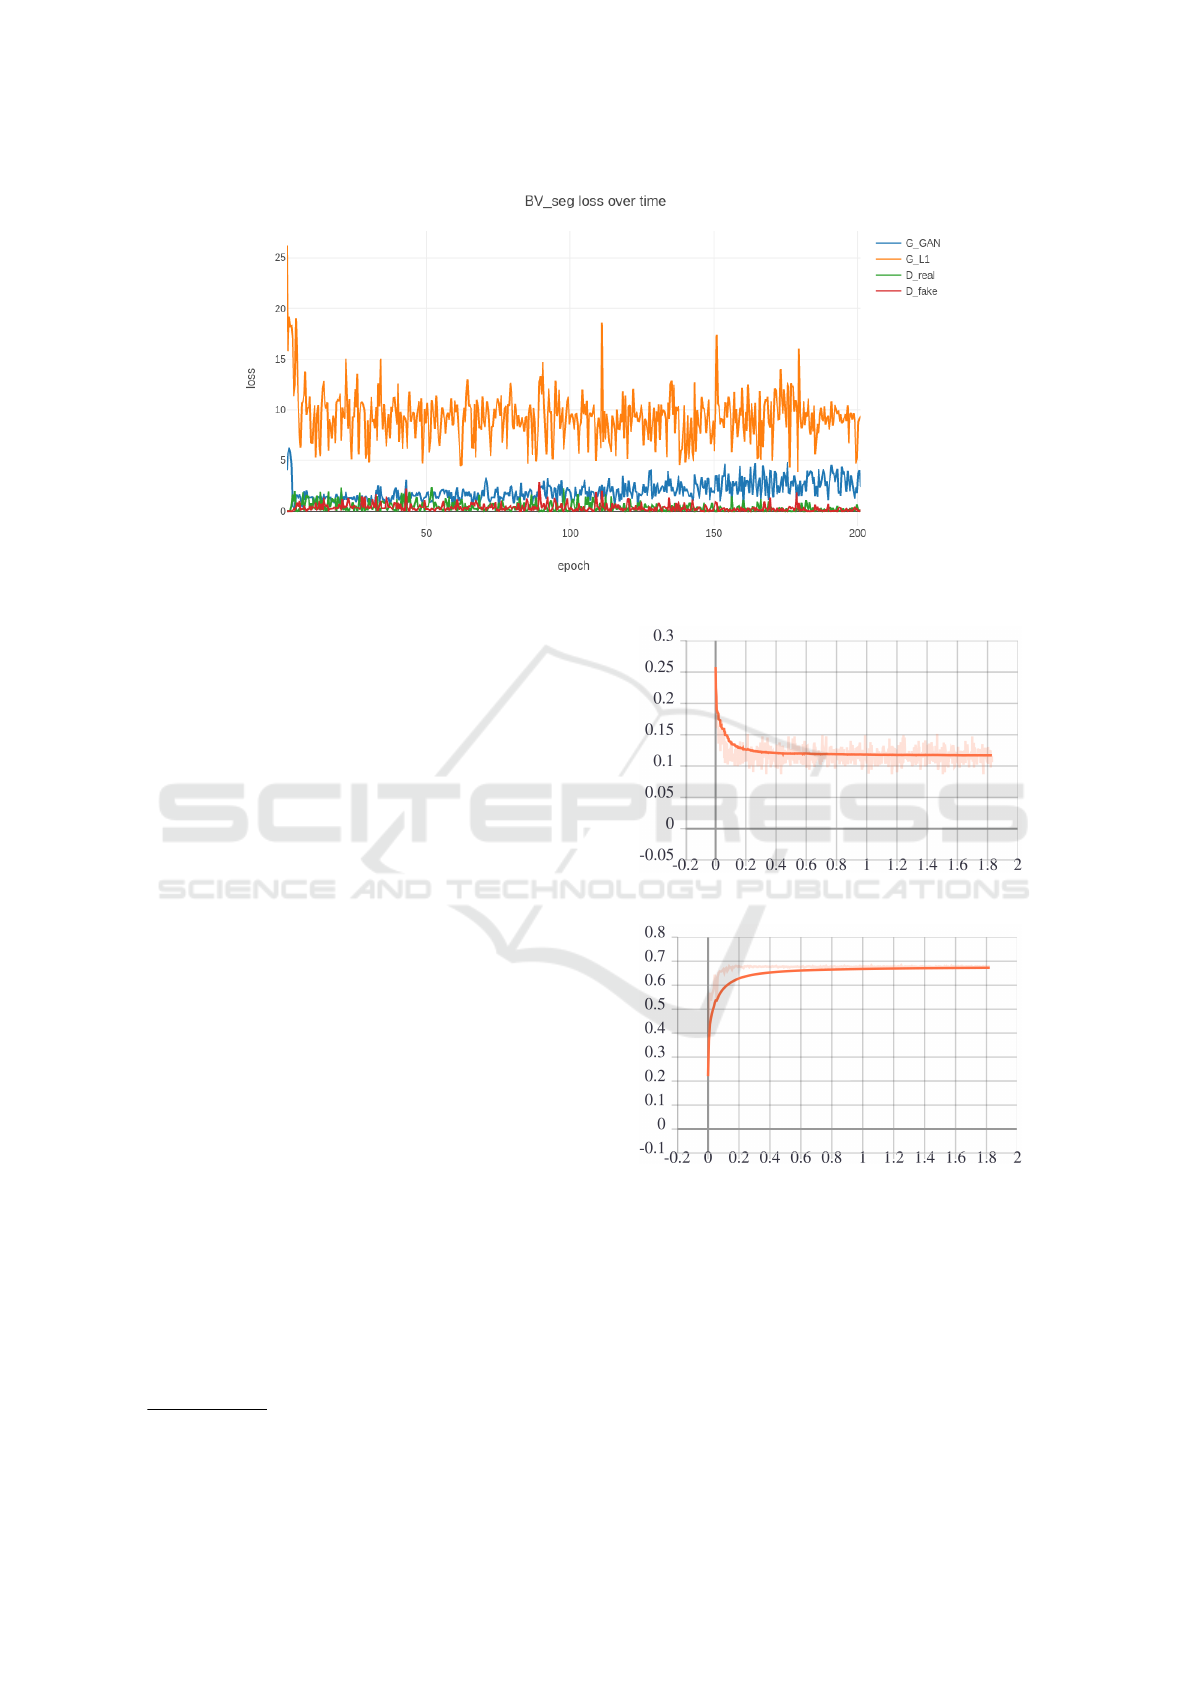
Figure 9: Training History plot for GAN model.
Now during training, the plot for generator and
discriminator loss functions for each step is shown in
Figure 9 for each model. In this plot, the loss value
is very high due to random weight assignment, but
as training progresses, it has reduced, but loss val-
ues oscillate. This is due to a general characteristic
of GAN as both of them works against and for each
other. The base code for the pix2pix model can be
found on GitHub repository
2
.
To obtain the optimal model, multiple combina-
tions of input image size, different model parameters,
data without noise modelling, data with noise mod-
elling, augmented dataset during training and model
using input image type are used during training, and
the best model was found among them. More details
about all these combinations are shown in Table 6.
4.3.2 U-Net based Approach
The conditional GAN based model that was discussed
in the past section uses U-Net as Generator and the
main difference between GAN and any other encoder-
decoder based networks like U-Net is in training the
network as GAN has conditional-GAN’s objective
function in the training process. So sometimes, this
would lead to overfitting with a smaller dataset. So
experiments were carried out by trying out vanilla U-
Net (Ronneberger et al., 2015), without GAN loss,
which was developed for the biomedical image seg-
mentation.
So to train the U-Net model, the same dataset
mentioned in Table 2 was used, and the noise mod-
elling shown in 3.1.1 was also used on top of raw im-
ages. Augmented dataset discussed in 3.1.2 was also
2
github.com/junyanz/pytorch-CycleGAN-and-pix2pix
Figure 10: Loss Function v/s time for Train Dataset.
Figure 11: Dice coefficient v/s time for Validation Dataset.
used to train the U-Net model. A similar combination
of models used for training the GAN model was used
here also to train various U-Net models to find out the
best model amongst all these combinations. All these
models were trained for 100 epochs with a constant
learning rate of 0.0001(Refer to Table 6 for more in-
formation).
While training the model, the plot for the best
model and almost all models looked like as shown in
the Figure 10 and 11, from these plots, one can infer
Improved Blood Vessels Segmentation of Retinal Image of Infants
149
that dice co-efficient for the Validation dataset is in-
creasing, which is a metric to find the performance of
the segmentation model and loss function on training
dataset is decreasing as training progresses. So one
can say that model should generalize well in the test-
ing, which is reflected in the results. The codebase
used for U-Net can be found on GitHub repository
3
.
4.4 Blood Vessels Segmentation
In this section, we evaluate the performance of the
proposed system to segment the nascent corpuscle im-
ages vessels. We used accuracy, RMSE, PSNR and
SSIM as performance metrics to measure the quality
of the segmentation, and its high value indicates the
best quality.
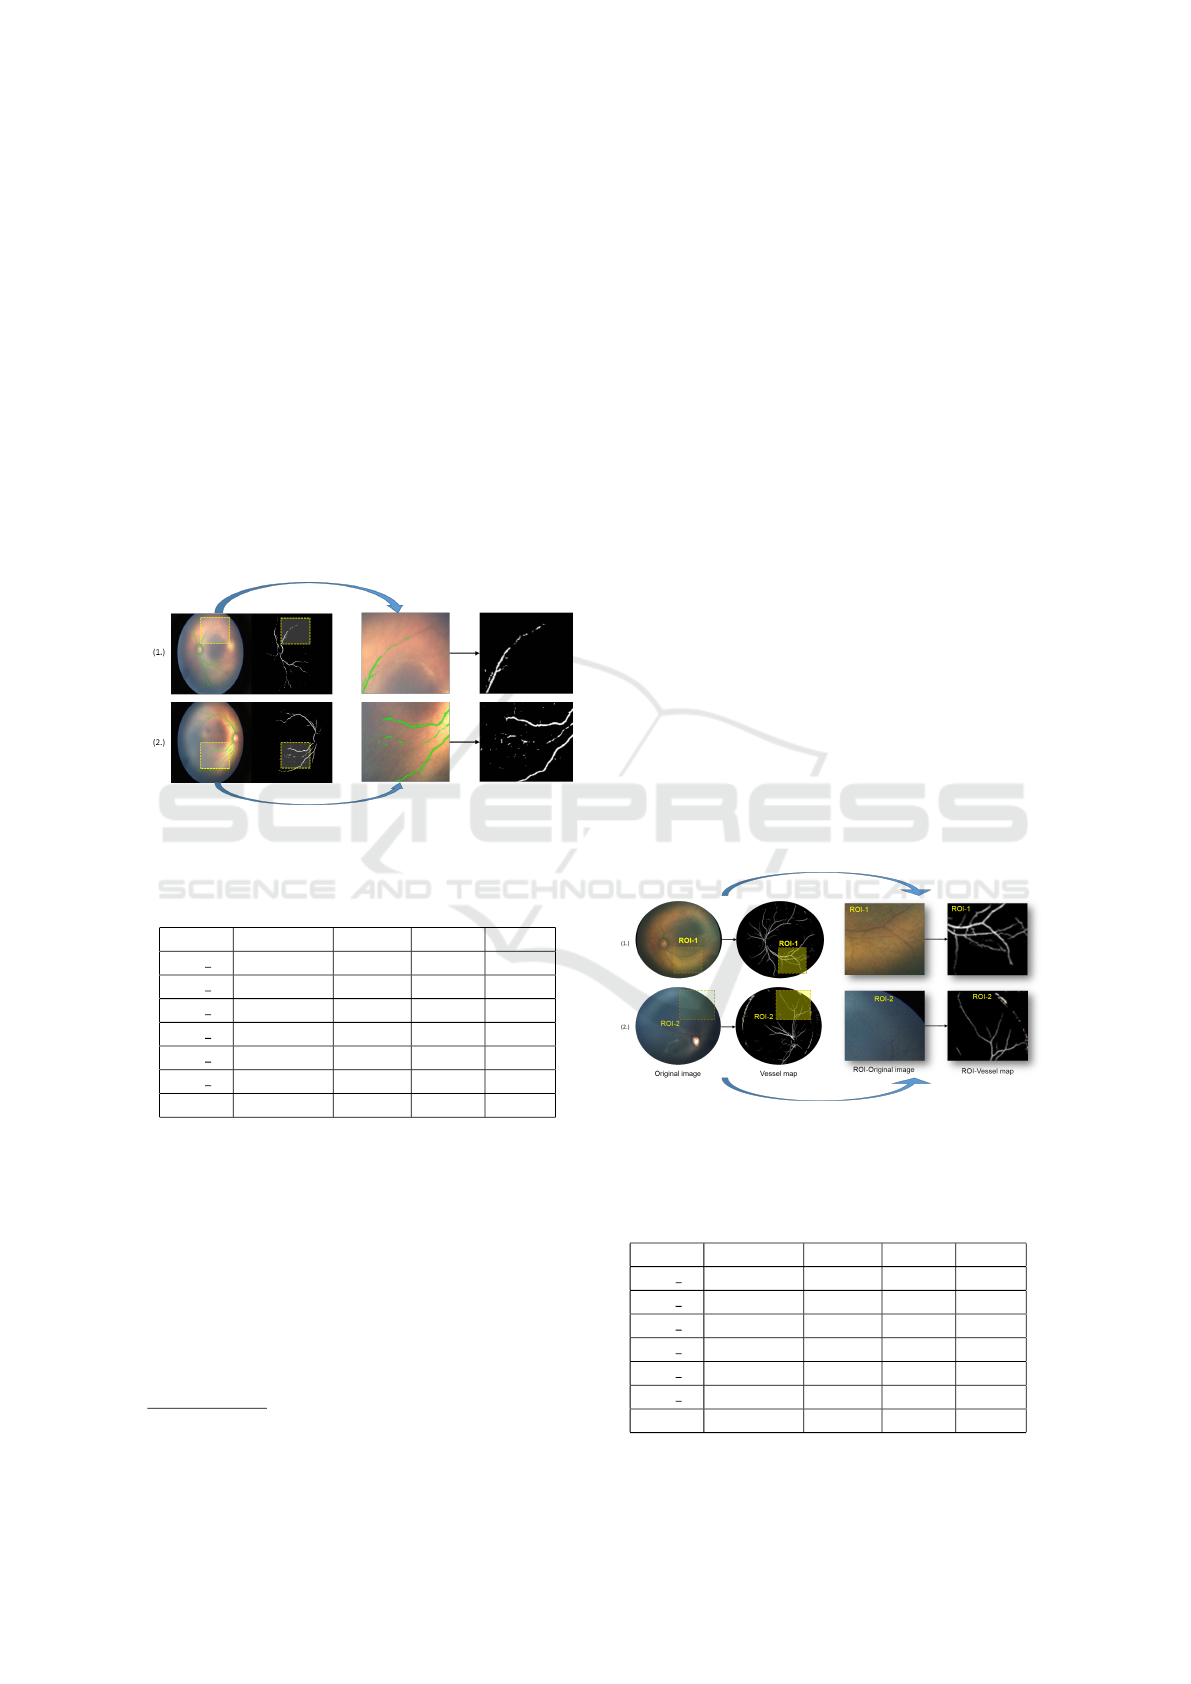
Figure 12: Retinal vessel segmentation using U-net. In im-
age (1) and (2) patch ROI-1 and ROI-2 are used to analyze
the segmented blood vessels map in detail.
Table 4: Bench-marking Results from U-Net model.
Image Accuracy RMSE PSNR SSIM
Img 1 97.56 0.15 16.82 0.93
Img 2 97.55 0.16 16.80 0.92
Img 3 92.66 0.27 11.60 0.85
Img 4 97.27 0.16 16.14 0.92
Img 5 97.46 0.15 16.70 0.93
Img 6 97.26 0.17 16.31 0.92
Mean 96.63 0.18 15.73 0.91
4.4.1 Segmentation using U-Net
Among all of the trained models, the model with the
augmented dataset performed the best in the case of
U-Net. Now to get the general overview of the per-
formance of the model, the qualitative analysis was
carried out for the local dataset, and this model is gen-
erating good results for our dataset (as shown in Fig-
ure 12). Quantitative analysis was also done on the
few labelled examples from the local dataset as it was
also done for the GAN model. Refer to Table 4 for the
3
github.com/milesial/Pytorch-UNet
results. This table reflects that this model is perform-
ing well for the image with noise and over-exposed
shots where vessels are not well separated from the
background, and also the performance figures are also
very much similar to what the GAN model has pro-
duced, but this model is much simpler compared to
GAN model in terms of training as well as detection.
4.4.2 Segmentation using GAN
Now for the evaluation of the vessel extraction model,
qualitative methods were employed, which required
manual inspection of all the results generated by the
model for the local dataset. The models trained by
noise modelling gave good results, although models
trained with augmented dataset displayed some edge
like artefacts in the test images due to the nature of
mosaic images used in training, this dataset will be
used afterwards, and it has shown promising results
for other models. The result from the GAN model is
shown in the Figure 13.
Table 5 summarized the vessels segmentation re-
sults with preterm retinal images from local ROP dis-
tastes. In which, we have reported proposed segmen-
tation techniques’ result when trainable DL-model is
used for vessels segmentation. Statistically, the eval-
uation metrics such as Accuracy, RMSE, PSNR and
SSIM score is high and comparable with respect to
the U-net network. However, for the GAN model,
Figure 13: Retinal vessel segmentation using GAN on local
dataset. In image, (1) and (2) patch ROI-1 and ROI-2 are
used to analyze the segmented blood vessels map in detail.
Table 5: Bench-marking Results from GAN(pix2pix)
model.
Image Accuracy RMSE PSNR SSIM
Img 1 97.51 0.16 16.89 0.89
Img 2 97.76 0.15 16.14 0.91
Img 3 92.80 0.27 11.70 0.81
Img 4 97.62 0.15 17.15 0.90
Img 5 97.30 0.16 16.74 0.89
Img 6 97.15 0.17 16.29 0.88
Mean 96.69 0.18 16.15 0.88
HEALTHINF 2022 - 15th International Conference on Health Informatics
150
Table 6: Different combinations of models trained for U-net/GAN.
Model name Pre-processing steps Color Resolution Dice-
coeff.
orig crop rgb 512x512 0.42-0.44
noise crop+GaussianNoise((9,9),0) rgb 512x512 0.38-0.42
noise+clahe noise+clahe(3.5,(5,5))+medianBlur(3) rgb 512x512 0.58-0.6
orig bw crop gray 512x512 0.58-0.59
noise bw crop+GaussianNoise((5,5),0) gray 512x512 0.52-0.53
noise+clahe bw noise+clahe(3.5,(5,5))+medianBlur(3) gray 512x512 0.59-0.60
noise bw crop+GaussianNoise((9,9),0) gray 512x512 0.54-0.55
noise+clahe bw noise+clahe(3.5,(5,5))+medianBlur(3) gray 512x512 0.55-0.56
noise+clahe bw+bicubic upscal noise+clahe(3.5,(5,5))+medianBlur(3) gray 512x512 0.60-0.64
noise+clahe+bicubic upscal noise+clahe(3.5,(5,5))+medianBlur(3) rgb 512x512 0.57-0.59
noise+clahe bw+bicubic upscal noise+clahe(3.5,(5,5))+medianBlur(3) gray 256x256 0.60-0.62
noise+clahe+bicubic upscal noise+clahe(3.5,(5,5))+medianBlur(3) rgb 256x256 0.59-0.60
noise+clahe bw+bicubic upscal noise+clahe(3.5,(5,5))+medianBlur(3) gray 1024x1024 0.61-0.62
noise+clahe+bicubic upscal noise+clahe(3.5,(5,5))+medianBlur(3) rgb 1024x1024 0.48-0.50
we achieve an average accuracy of 96.69% is sightly
higher than the accuracy value of the U-Net model
96.63.
4.5 Various Combinations for Vessel
Extraction Models
Now in order to get the model for the vessel extrac-
tion, multiple experiments were carried out by chang-
ing various fields, and while training these models,
due to the lack of ground truth for the local dataset,
the validation using any kind of performance metric
for segmentation was not carried out. So many experi-
ments were carried out, tweaking multiple parameters
and after doing qualitative analysis of the generated
results, carried out the next experiments.
• Noise Modeling: Proposed noise modelling
based approach in 3.1.1 during for training
dataset to bridge the gap between training and test
dataset as they have a very distinct characteristic.
• Pre-Processing: This is applied to test as well as
training examples to enhance the contrast using
the CLAHE Filter.
• Color Channels: Noticed during the initial phase
of experiments that models with only single-
channel (i.e., G-channel) gray-scale images can
give better results for vessel segmentation so, for
some combinations, both RGB and gray-scale im-
ages were used as input.
• Resolution: This was a major part of the given
model as it decided the time taken to train and ex-
tract the blood vessels from the image as it can
change the size of the model.
• Grid Size for Augmented Dataset: Tried out
multiple grid sizes for the dataset that was aug-
mented as mentioned in 3.1.2.
• Upscaling Algorithm: Both models use U-Net
either directly or indirectly, and de-convolution
is part of it, and upscaling can be done in two
ways, either bilinear upscaling or bicubic upscal-
ing (Ronneberger et al., 2015). By default, U-Net
uses Bilinear upscaling as it has a lower computa-
tional cost, but some experiments have also tried
out bicubic upscaling algorithm as it is known to
give better results, but it results in higher compu-
tational time.
Now all the combinations that were tried out with
specific pre-processing steps are listed in Table 6 for
the original dataset(i.e. without image mosaic based
augmentation). Keep in mind that in all these experi-
ments training dataset is of size 224, and the model
was trained for 100 epochs with a learning rate of
0.0001.
The models trained using the augmented dataset
from Section 3.1.2 using mosaic is listed in Table 7
and in all these experiments training dataset has 450
samples and models were trained for 100 epochs with
a 0.0001 learning rate.
Without noise modelling and preprocessing, the
U-Net and GAN model gives dice coefficient be-
tween 0.42-0.44 for vessels segmentation with the
local dataset. However, for the same network and
task (Kamran et al., 2021; Uysal et al., 2021; Guo
et al., 2020a; Li et al., 2020), reported dice coefficient
more than 0.70 with publicly available dataset such
as DRIVE STARE or CHASE DB1. However, using
the proposed system, we get significant improvement
in the Dice Coefficient and accuracy of vessels seg-
Improved Blood Vessels Segmentation of Retinal Image of Infants
151
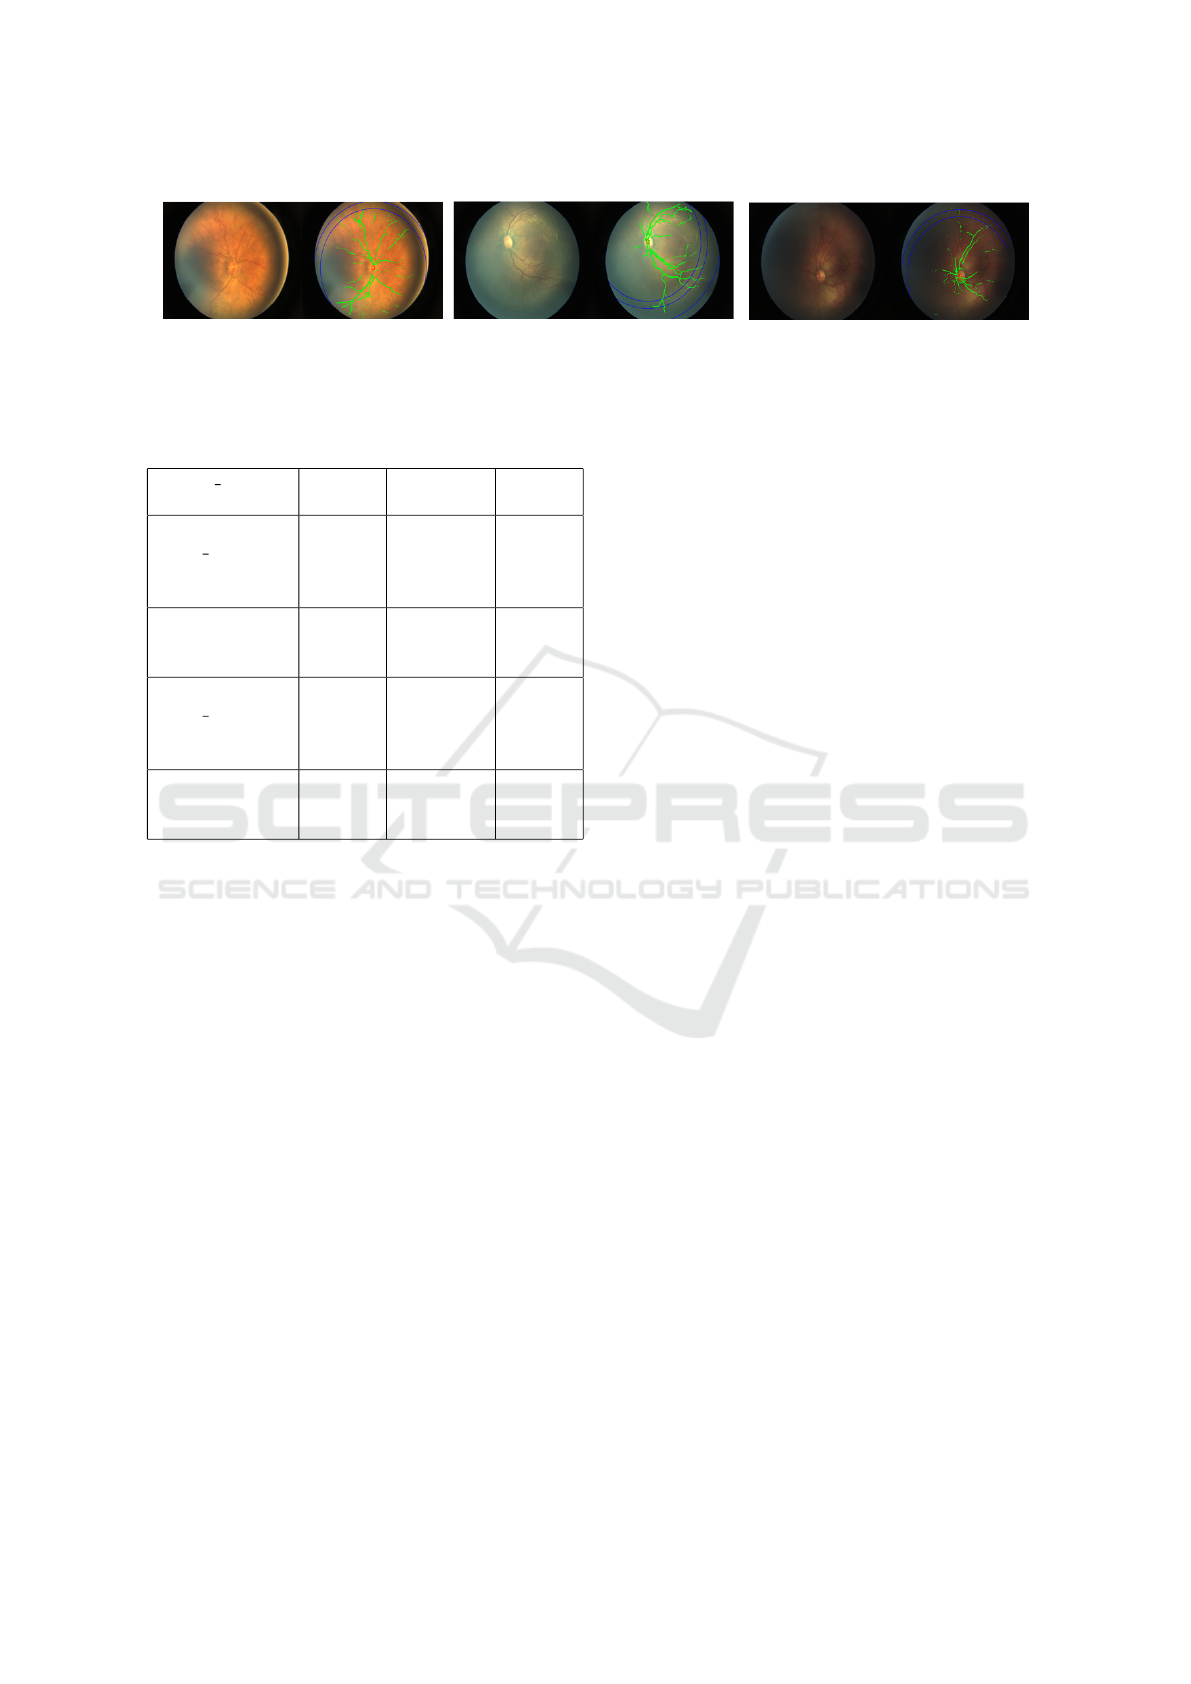
Figure 14: Visualization of Zoning algorithm.
Table 7: Different Combinations of models trained for U-
Net/GAN with dataset augmented using mosaic generation
in input image of size 512x512 pixels and its Dice coeffi-
cient in the last step.
Model name rgb/gray Dice-
coeff.
Grid
Size
noise+
clahe bw+
bicubic upscal-
ing
gray 0.678-
0.68
32x32
noise+ clahe+
bicubic upscal-
ing
rgb 0.685+ 32x32
noise+
clahe bw+
bicubic upscal-
ing
gray 0.67-0.68 64x64
noise+ clahe+
bicubic upscal-
ing
rgb 0.67+ 64x64
mentation with the ROP dataset. At the same time, its
performance got reduced for the public datasets, as we
have used preprocessed (or noise modelling) images.
4.6 Zone-1 ROP Screening
Our next set of experiments showed that the GANs
based vessel detection had better generalization in
terms of quality of vessel maps generated and detect
thinner vessels on the posterior regions of the fundus
image helping in the zoning algorithm (ICROP) (Ku-
mar et al., 2021). Zoning algorithm gave the accuracy
of 88.23% on the local dataset. The image 14 shows
detection of the extent of vessel growth pretty accu-
rately even in case of some tricky images with noise
or high exposure or even in case of very dark images,
using GANs based vessel detection.
5 CONCLUSION AND
DISCUSSION
Precise segmentation and detection of blood ves-
sels is an essential task for efficiently diagnosing
and monitoring ROP and Plus disease in neonatal-
ophthalmology. In this paper, we propose a new reti-
nal vessel segmentation method using the DCNN ar-
chitectures, in which retinal scans are indistinguish-
able from image/video noise, blur, and vessels map
background. We have used two existing Pix2Pix of U-
Net and GAN model for same. The proposed method
of dataset preparation are used to trained and tested
on publicly available datasets and evaluated its per-
formance on the ROP dataset. The proposed system
achieves a high Dice coefficient and accuracy rate for
the retinal vessel segmentation task.
In addition, we tested our approach on retinal
scans of premature newborns at a nearby hospi-
tal. Our approach significantly improves the Zoning
based ROP classification as it is based on the extent of
blood vessels. However, for the Plus disease requires
structural information of the vessel such as tortuosity,
branch angle and width. The proposed work provides
greater interest in utilising deep learning-based sys-
tems in the future to develop similar applications such
as disease screening, diagnosis and monitoring using
biomedical (retinal) images. The proposed system
can be specially used to develop automated applica-
tions for fundus imaging-based affordable health care
in the future (Moshfeghi and Capone, 2018; Kumar
and Paul, 2016; Paul and Kumar, 2015; Patel et al.,
2019). Therefore, this will require a research study
that we expect to significantly improve using the new
DL-based vessel segmentation technique in resource-
constraint environments.
REFERENCES
Ataer-Cansizoglu, E., Bolon-Canedo, V., Campbell, J. P.,
Bozkurt, A., Erdogmus, D., Kalpathy-Cramer, J., Pa-
tel, S., Jonas, K., Chan, R. P., Ostmo, S., et al. (2015).
Computer-based image analysis for plus disease diag-
nosis in retinopathy of prematurity: performance of
the “i-rop” system and image features associated with
expert diagnosis. Translational vision science & tech-
nology, 4(6):5–5.
Bankhead, P., Scholfield, C. N., McGeown, J. G., and Cur-
tis, T. M. (2012). Fast retinal vessel detection and
measurement using wavelets and edge location refine-
ment. PloS one, 7(3):e32435.
HEALTHINF 2022 - 15th International Conference on Health Informatics
152

Budai, A., Bock, R., Maier, A., Hornegger, J., and Michel-
son, G. (2013). Robust vessel segmentation in fundus
images. International journal of biomedical imaging,
2013.
Fielder, A. R., Wallace, D. K., Stahl, A., Reynolds, J. D.,
Chiang, M. F., and Quinn, G. E. (2019). Describing
retinopathy of prematurity: Current limitations and
new challenges. Ophthalmology, 126(5):652–654.
Gilbert, C., Malik, A. N., and Vinekar, A. (2021). Artificial
intelligence for rop screening and to assess quality of
care: Progress and challenges. Pediatrics, 147(3).
Guo, C., Szemenyei, M., Yi, Y., Wang, W., Chen, B.,
and Fan, C. (2020a). Sa-unet: Spatial attention u-
net for retinal vessel segmentation. arXiv preprint
arXiv:2004.03696.
Guo, X., Chen, C., Lu, Y., Meng, K., Chen, H., Zhou,
K., Wang, Z., and Xiao, R. (2020b). Retinal ves-
sel segmentation combined with generative adversar-
ial networks and dense u-net. IEEE Access, 8:194551–
194560.
Holm, S., Russell, G., Nourrit, V., and McLoughlin, N.
(2017). Dr hagis—a fundus image database for
the automatic extraction of retinal surface vessels
from diabetic patients. Journal of Medical Imaging,
4(1):014503.
Hoover, A. D., Kouznetsova, V., and Goldbaum, M. (2000).
Locating blood vessels in retinal images by piecewise
threshold probing of a matched filter response. IEEE
Transactions on Medical Imaging, 19(3):203–210.
Isola, P., Zhu, J.-Y., Zhou, T., and Efros, A. A. (2018).
Image-to-image translation with conditional adversar-
ial networks.
Kamran, S. A., Hossain, K. F., Tavakkoli, A., Zuckerbrod,
S. L., Sanders, K. M., and Baker, S. A. (2021). Rv-
gan: Segmenting retinal vascular structure in fundus
photographs using a novel multi-scale generative ad-
versarial network. In International Conference on
Medical Image Computing and Computer-Assisted In-
tervention, pages 34–44. Springer.
Krestanova, A., Kubicek, J., Penhaker, M., and Timkovic,
J. (2020). Premature infant blood vessel segmentation
of retinal images based on hybrid method for the de-
termination of tortuosity. L
´
eka
ˇ
r a technika-Clinician
and Technology, 50(2):49–57.
Kubicek, J., Timkovic, J., Penhaker, M., Oczka, D., Ko-
varova, V., Krestanova, A., Augustynek, M., and
Cerny, M. (2019). Detection and segmentation of reti-
nal lesions in retcam 3 images based on active con-
tours driven by statistical local features. Advances
in Electrical and Electronic Engineering, 17(2):194–
201.
Kumar, V., Patel, H., Paul, K., Surve, A., Azad, S., and
Chawla, R. (2021). Deep learning assisted retinopathy
of prematurity screening technique. In HEALTHINF,
pages 234–243.
Kumar, V. and Paul, K. (2016). mnetra: A fundoscopy
based optometer. In HEALTHINF, pages 83–92.
Li, L., Verma, M., Nakashima, Y., Nagahara, H., and
Kawasaki, R. (2020). Iternet: Retinal image segmen-
tation utilizing structural redundancy in vessel net-
works. In Proceedings of the IEEE/CVF Winter Con-
ference on Applications of Computer Vision, pages
3656–3665.
Luo, Y., Chen, K., Mao, J., Shen, L., and Sun, M. (2020).
A fusion deep convolutional neural network based on
pathological features for diagnosing plus disease in
retinopathy of prematurity. Investigative Ophthalmol-
ogy & Visual Science, 61(7):2017–2017.
Megrabov, E., Jamshidi, A., and Patange, S. Retinel vessel
segmentation using u-net and gans.
Moshfeghi, D. M. and Capone, A. (2018). Economic barri-
ers in retinopathy of prematurity management. Oph-
thalmology Retina, 2(12):1177–1178.
Organization, W. H. et al. (2019). World report on vision.
Technical report, Geneva: World Health Organization.
Patel, T. P., Aaberg, M. T., Paulus, Y. M., Lieu, P.,
Dedania, V. S., Qian, C. X., Besirli, C. G., Mar-
golis, T., Fletcher, D. A., and Kim, T. N. (2019).
Smartphone-based fundus photography for screening
of plus-disease retinopathy of prematurity. Graefe’s
Archive for Clinical and Experimental Ophthalmol-
ogy, 257(11):2579–2585.
Paul, K. and Kumar, V. (2015). Fundus imaging based af-
fordable eye care. In HEALTHINF, pages 634–641.
Ronneberger, O., Fischer, P., and Brox, T. (2015). U-net:
Convolutional networks for biomedical image seg-
mentation.
Staal, J., Abramoff, M., Niemeijer, M., Viergever, M., and
van Ginneken, B. (2004). Ridge based vessel segmen-
tation in color images of the retina. IEEE Transactions
on Medical Imaging, 23(4):501–509.
Uysal, E. S., Bilici, M. S¸., Zaza, B. S.,
¨
Ozgenc¸, M. Y.,
and Boyar, O. (2021). Exploring the limits of data
augmentation for retinal vessel segmentation. arXiv
preprint arXiv:2105.09365.
Wang, Z., Bovik, A. C., Sheikh, H. R., and Simoncelli, E. P.
(2004). Image Quality Assessment: From Error Vis-
ibility to Structural Similarity. IEEE Transactions on
Image Processing, 13(4):600–612.
Wang, Z., She, Q., and Ward, T. E. (2021). Generative
adversarial networks in computer vision: A survey
and taxonomy. ACM Computing Surveys (CSUR),
54(2):1–38.
Yildiz, V. M., Tian, P., Yildiz, I., Brown, J. M., Kalpathy-
Cramer, J., Dy, J., Ioannidis, S., Erdogmus, D.,
Ostmo, S., Kim, S. J., et al. (2020). Plus disease in
retinopathy of prematurity: Convolutional neural net-
work performance using a combined neural network
and feature extraction approach. Translational Vision
Science & Technology, 9(2):10–10.
Improved Blood Vessels Segmentation of Retinal Image of Infants
153
