
Hybrid Gene Regulation Models of Mammalian Circadian Cycles
Lelde Lace
a
, Karlis Cerans
b
, Karlis Freivalds, Gatis Melkus and Juris Viksna
c
Institute of Mathematics and Computer Science, University of Latvia, Raina bulvaris 29, Riga, Latvia
Keywords:
Gene Regulatory Networks, Hybrid System Models, Circadian Cycle Modelling, Behavioural Periodicity.
Abstract:
We present hybrid system based gene regulation models of mammalian circadian cycle and the results of model
behaviour analysis. The models cover genes of two recently proposed biological models with 5 and 3 gene
’core oscillators’. The advantage of the used HSM framework is limited model dependence on parameter val-
ues, which are described only at qualitative level at the extent they affect models’ observable behaviour. The
models represent gene regulatory networks in terms of genes, proteins, binding sites, regulatory functions,
and constraints on growth rates and binding affinities. Although such models do provide limited accuracy,
they are less dependent from parameter fitting and can provide predictions on some biological aspects of gene
regulation that are not dependent form the choice of particular parameter values. The models can provide bio-
logically feasible predictions about synchronised oscillation of the involved genes and functions that regulate
gene activity on basis of regulatory network topology alone. The work also includes developments of new
analysis methods, in particular, for analysis of available trajectories in HSM state spaces and derivation of
constraints that are needed for state transition trajectories to satisfy the required specific properties.
1 INTRODUCTION
Circadian rhythm is well known process of gene ac-
tivity variation during a 24 hour cycle in response to
external stimulus, such as light or heat, which is usu-
ally referenced to as ’Zeitgeber’. The cyclic process
of gene activity variation in general is self-sustaining,
with Zeitgeber acting as synchronizer of the activ-
ity to 24 hours long period. In good level of detail
the underlying gene regulatory processes of circadian
rhythm have been studied for a variety of organisms,
in particular for mammals, for which several consis-
tent and partially overlapping models of gene activ-
ity regulation have been proposed. More formalised
models based on differential equations have been de-
veloped (Korencic et al., 2014) as well.
The focus of our study is modelling of these mam-
malian circadian cycle regulatory processes using hy-
brid system model (HSM) based formalism (Brazma
et al., 2015), with the aim to understand the suitabil-
ity of HSM based approach for description of mam-
malian circadian cycle gene regulatory process. We
have developed a number of concrete models for this
purpose, and have evaluated how well these models
a
https://orcid.org/0000-0001-7650-2355
b
https://orcid.org/0000-0002-0154-5294
c
https://orcid.org/0000-0003-2283-2978
can replicate experimentally known data, and how
useful they might be for better understanding of bi-
ological mechanism driving circadian cycle rhythm.
The development of HSM framework (Brazma
et al., 2013; Brazma et al., 2015) was motivated
by analysis of lambda phage virus model described
initially by Finite State Linear Model formalism
(Brazma and Schlitt, 2003; Schlitt and Brazma,
2006). The main conclusion drawn from this analysis
was relative unimportance of assumptions about con-
crete numerical model parameters and it was recog-
nised that qualitative (experimentally measurable) be-
haviour of the model depends only on comparative
relations between growth functions and binding site
affinities and not on their exact form or values. Re-
placing these functions and parameter values with set
of constraints provides the initial HSM frame of the
model. One of the achievements of HSM framework
was lambda phage model, for which it was shown that
the only possible stable behaviours (described by at-
tractor regions in state spaces) well correspond to bi-
ologically known lysis and lysogeny processes, and
that, according to the model, no other types of be-
haviour can occur. A number of hypotheses regarding
constraints of the model have also been derived al-
lowing to propose experiments of virus genome rear-
rangements have been proposed that could allow ei-
130
Lace, L., Cerans, K., Freivalds, K., Melkus, G. and Viksna, J.
Hybrid Gene Regulation Models of Mammalian Circadian Cycles.
DOI: 10.5220/0010834400003123
In Proceedings of the 15th International Joint Conference on Biomedical Engineering Systems and Technologies (BIOSTEC 2022) - Volume 3: BIOINFORMATICS, pages 130-137
ISBN: 978-989-758-552-4; ISSN: 2184-4305
Copyright
c
2022 by SCITEPRESS – Science and Technology Publications, Lda. All rights reserved

ther to validate or refute these hypotheses (Ruklisa
et al., 2019).
Since circadian rhythms are ones of the best stud-
ied and best understood gene regulatory processes,
they are are well suited for further assessing of ca-
pabilities of the modelling framework and for devel-
opment of its extensions.
2 CIRCADIAN CYCLE GENE
REGULATORY PROCESSES
In this Section we briefly summarise the main details
on the biologically widely acknowledged mechanism
of mammalian circadian regulation.
The circadian system is composed of a series of
molecular oscillators. These oscillators are realized
through feedback loops of transcriptional regulation
involving several core clock components. The pri-
mary feedback loop is based on the action of CLOCK
and Bmal1 transcription factors which form a het-
erodimer that positively regulates several genes via
the E-box cis-regulatory sequence, among which are
the Period or Per and Cryptochrome or Cry genes
whose products dimerize into a PER:CRY dimer
that acts as the negative component of the loop,
shutting off the transcription of both CLOCK and
BMAL1 (and, through these, its own transcription).
A secondary feedback loop is also present, and in-
volves CLOCK:Bmal1-mediated transcriptional ac-
tivation of retinoic acid-related orphan nuclear re-
ceptors RevErbα and Rorα which bind competi-
tively to sequences known as retinoic acid-related or-
phan receptor response elements (ROREs or RREs),
which further modulate Bmal1 expression through ei-
ther Ror-mediated activation or RevErbα-mediated
repression (Ko and Takahashi, 2006; Morris et al.,
2020; Ueda et al., 2005). There is also an addi-
tional regulatory mechanism at play realized via tran-
scription factor DBP which binds to the D-box cis-
regulatory sequence, causing its own activation events
independent of RREs or the E-box, but the physiolog-
ical role of this activation remains unclear, though it
is hypothesized to modulate both the output and input
of the circadian system (Morris et al., 2020; Yoshi-
tane et al., 2015). Together, with some additional
functionality imparted by post-translational modifica-
tions these molecular feedback loops produce an ac-
tivation/repression cycle approximately 24 hours in
length: the mammalian circadian clock (Ko and Taka-
hashi, 2006; Morris et al., 2020; Ueda et al., 2005).
Modelling this clock is non-trivial. Though sim-
plified models can sometimes omit them, even the
core regulatory circuitry of the circadian clock in-
cludes over a dozen core clock genes, and the mam-
malian circadian clock is known to have hundreds
of molecular inputs that modulate the various states
of the clock and thousands of outputs that the cycle
is able to regulate (Morris et al., 2020; Ueda et al.,
2005). Beyond this, the circadian clock genes also
have tissue-specific effects potentially linked to hun-
dreds of clock-controlled genes (CCGs). This creates
fertile ground for explaining tissue-specific patterns
of gene expression with circadian clock models of
varying levels of sophistication, allowing for reason-
ably accurate (though by no means complete) expla-
nations of these patterns even with relatively simple 5-
gene models encompassing the interplay of some core
clock genes (Korencic et al., 2014). Mathematical
modelling of these patterns can reveal the principal
dynamics of the gene regulatory network underpin-
ning the circadian clock, such as the idea that while
the circadian clock is ultimately complex and tissue-
specific in its action, the minimal requirements for
keeping its rhythmic oscillation and thus the core el-
ement of all circadian clocks specific to tissues might
in fact amount to a single repressilator motif (three
genes that each inhibit the next gene and are inhib-
ited by the previous gene in a loop) comprising three
genes – Per2, Cry1 and RevErbα (Pett et al., 2016).
The approaches described above inform our ap-
proach in this work, where we hope to model the cir-
cadian clock with a minimal array of core clock genes
in order to analyse their interplay and validate our
modelling approach as a useful one in approximating
the properties of the circadian clock.
3 MODELLING FRAMEWORK
For describing models of gene regulatory networks
we use HSM framework (for a detailed technical de-
scription see (Brazma et al., 2015)). The models are
specified by 6-tuples H =
h
M, X, C, T, F, MF
i
, where
M = {µ
1
, . . . , µ
k
} is a set of modes, X = {x
1
, . . . , x
m
}
is a set of continuous variables with real non-negative
values, C = {c
1
, . . . , c
r
} is a set of real non-negative
transition thresholds, T is a set of mode transitions
(in which transitions have form τ = α →
x≤c
β or
τ = α →
x≥c
β, where α, β ∈ M, x ∈ X, c ∈ C), F =
{ f
1
, . . . , f
n
} is a set of continuous and monotonous
growth/degradation functions, and MF : M × X → F
is a mapping providing mode-function assignments
assigning to each mode α ∈ M and each variable
x ∈ X a function g ∈ F. This is consistent with other
widely used hybrid system definitions, but imposes
additional restrictions in order to keep the formalism
as simple as possible for analysis purposes, and at the
Hybrid Gene Regulation Models of Mammalian Circadian Cycles
131

same time still to provide sufficient modelling power
for describing known biological processes.
Intuitively modes from M of HSM are meant to
represent ’states’ on uneventful evolution of biologi-
cal system during which no observable ’events’ (such
as occupation or vacation of a regulatory binding site,
molecular interactions that can potentially change the
system’s behaviour etc.) occur. Variables from X de-
scribe concentration levels of biological substances
(such as proteins), and T describe allowed transitions
between the modes that can be triggered by substance
concentrations reaching specific thresholds or drop-
ping below them. Functions from F describe changes
of substance concentrations with time, for each of the
substances these changes are mode-specific, the be-
haviour at each of the nodes is specified by mode-
function assignment MF.
We assume that a biological system is described
by a deterministic HSM model, in which substance
rate changes are governed by well-defined functions
from F. At the same time, we also assume that our
knowledge about the modelled system is limited to
what can be experimentally observed about the sys-
tem’s behaviour, i.e. whether concentration rates are
growing or decreasing and (possibly) at what rates.
This uncertainly allows to model not strictly deter-
ministic behaviour of system (a more realistic as-
sumption from biological perspective) and incorpo-
rate such features as time delays and randomness.
In formal terms our knowledge about HSM that is
limited only to qualitative and not precise quantitative
information about substance concentrations that can
be represented by a notion of HSM frame F (H ) in
which concrete functions from F are replaced by val-
ues from {%, &, →} that indicate whether concentra-
tions are growing, decreasing, or remaining constant
(usually at zero and saturation levels). Such replace-
ment can change a strictly deterministic time evo-
lution of the model states to very non-deterministic
state evolution which will include mode transitions
that contradict the known biological evidence. How-
ever, at qualitative level known experimental evidence
can be incorporated in the HSM frame in form of con-
straints on allowed mode transitions.
At technical level this is described it terms of con-
strained frames, which additionally impose orderings
on mode transitions. The general modelling workflow
is as follows: 1) start with HSM model frame that is
constructed based on the known biological knowledge
and incorporates known ordering constraints; 2) anal-
yse the set of all constrained state spaces that are built
in accordance to different ordering constraint assump-
tions and partition them into equivalence classes; 3)
select the set of equivalence classes in which state
trajectories are consistent with experimentally known
behaviour as hypothetically valid models of the bio-
logical system. The classes of state spaces that are not
consistent with experimentally measured behaviour
can be used to derive additional constraints on gene
regulation that in principle can be validated by ex-
periments (thus, HSM models potentially can provide
testable predictions that can be used either to recon-
firm or to refute the model validity).
Given a constrained HSM frame model for a gene
regulatory network, we can simulate the network be-
haviour by choosing any set of appropriate functions
F that satisfy the given constraints. The main ad-
vantage of hybrid models, however, is the possibility
to analyse the entire range of possible dynamic be-
haviours of the modelled system. We are interested in
the following questions about the modelled system.
Stable behaviour Regions in Model State Space.
For Boolean models the regions of stable behaviour
are simply described by attractors – simple cycles in
state space graph. Cyclic attractors, however, can be
obtained only for state spaces with a single outgoing
transition for each vertex. The most straightforward
generalisation of attractors in general digraphs can be
obtained by partitioning state spaces in strongly con-
nected components (SCC). In addition we can exclude
SCCs for which we can prove that the state evolution
cannot remain within them for infinitely long time –
this will be the case if there is a gene that is active (in-
active) in all SCC vertices, and for all vertices there is
transition that is triggered by the protein correspond-
ing to this gene reaching (dropping below) certain
threshold. If this is the case we call SCC transitional
and define as attractors all the remaining SCCs.
A given HSM model usually will provide only
partial constraints on transitions and there can be a
large number of different sets of full constraints and
different state spaces that correspond to them. In this
case the task of analysis is partitioning the state space
set into equivalence classes up to isomorphism of at-
tractor SCCs and assessing the biological merit and
validity of each class separately.
Switching Conditions that Irrevocably Leads the
System to reaching a Single Region of Stability. We
are interested to identify sets of states with corre-
sponding transitions such that there are fewer reach-
able attractors from destination vertex than there are
from the source vertex. Such states can be grouped
together according to attractors reachable from them
and genes that trigger the discriminating transitions.
In general case these vertex groups will form a deci-
sion forest.
Available Trajectories in State Spaces. An impor-
tant question for assessing model validity is whether
BIOINFORMATICS 2022 - 13th International Conference on Bioinformatics Models, Methods and Algorithms
132
available trajectories in state space are consistent with
the known experimental data. Queries about the avail-
able trajectories can be naturally described by regu-
lar expressions and the state space itself can be re-
garded as Non-deterministic Finite Automaton (with
given pair of vertices specifying initial and accepting
states) and will satisfy the requirement on trajectories
if and only if languages defined by query expression
and state space automaton are equal. The problem is
NP-complete, however, the available algorithms are
sufficiently fast for the current use cases.
In the context of previously developed HSM mod-
els for phage viruses the most important part of anal-
ysis was identification of attractors (stability regions)
in model state spaces – this led to dramatic reduction
of number of states that merits further analysis (while
the initial state spaces contained up to hundreds of
thousands of nodes, the attractor regions were limited
to few tens of nodes). Trajectory analysis has played a
part, but only in providing suggestions whether mod-
els with different attractor topologies can be differ-
entiated on basis of additional experimental measure-
ments. For circadian cycle models (already by their
design) most of the states are expected to belong to
single attractor region (which, in this case, fortunately
tend to be small). This also exclude the need for
switching condition analysis, since there are none.
The model assessment thus is largely based on analy-
sis of available trajectories in model state spaces and
deriving constraints that are needed to exclude spe-
cific undesirable behaviours. As noted, this task is
closely related to automata equivalence problem, but
for comparatively small state spaces of circadian cy-
cle models that we have proposed the analysis still
has been done semi-manually. More exact formal de-
scription of this problem and development of algo-
rithms for automated analysis remains an interesting
research challenges.
4 CIRCADIAN CYCLE MODELS
For representation in HSM framework we have cho-
sen five gene ’core oscillator’ formed by genes
Bmal1, Per2, RevErb, Cry1 and Dbp proposed and
analysed in very detailed level in (Korencic et al.,
2014). The model is based on numerous semi-formal
mammalian circadian cycle models developed and
published earlier (Relogio et al., 2011; Ukai and
Ueda, 2010; Leloup and Goldbetter, 2003). In general
these models are in good agreement about the under-
lying mechanism behind the circadian cycle, but usu-
ally consider a larger set of involved genes. At the
same time, tissue specificity of expression of genes
involved in circadian rhythm is also well known, and
the proposed core oscillator was designed to cover the
genes whose oscillatory behaviour is observed among
all the tissues, and to be self-sufficient to dictate ex-
pression patterns of other genes involved in circadian
regulatory networks. The model was further fine-
tuned (Pett et al., 2016; Schmal et al., 2019), includ-
ing identification and analysis of smaller three gene
Bmal1, Per2 and RevErb sub-network.
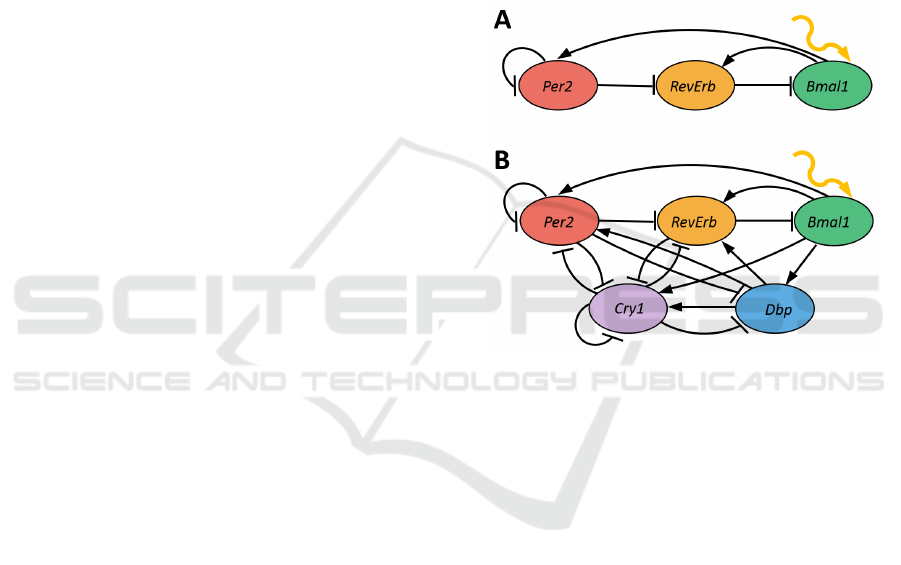
These models (genes and their regulatory interac-
tions) are shown in Figure 1. The external Zeitgeber
regulator acts as a synchronisation factor, but is not
required for oscillatory behaviour.
Figure 1: Core oscillators of mammalian circadian cycles
with 3 genes (A) and 5 genes (B). Activation or inhibition
regulatory properties of specific genes are well established,
however, from modelling perspective, the exact form of reg-
ulatory functions can be a subject of interpretation.
In order to represent the model in HSM frame-
work two important things that have to be decided
are: 1) level of details that will be represented by the
model, and 2) concrete forms of regulatory functions
for each of the genes.
Regarding the level of details that should be in-
cluded, for bacteriophage models important role has
differences in same protein binding affinities at differ-
ent sites. For circadian networks, however, there is no
evidence about notably distinct affinities of sites bind-
ing the same proteins. Moreover, at core oscillator
model’s abstraction level several biologically similar
genes are grouped together, thus binding site affini-
ties may not have clear biological meaning. High
level of connectivity in circadian regulatory network
will also allow many very different affinity assign-
ments to match a specific desired model behaviour,
thus severely limiting the usefulness and credibility
of such type of models. For these reasons our pro-
posed HSM models include just a single binding site
Hybrid Gene Regulation Models of Mammalian Circadian Cycles
133

for each protein.
Regarding the choice of exact form of regulatory
functions, a natural constraint is that biologically ac-
knowledged positive and negative regulatory actions
of specific genes have to be respected – thus a regu-
latory formula for gene G with activating regulators
A
1
, . . . , A
k
and repressing regulators R
1
, . . . , R
l
should
be given as a Boolean expression of conjunctions ∧
and disjunctions ∨ with variables A
i
, i = 1 . . . k and
¬R
j
, j = 1. . . l. This still leaves many candidates for
multi-variable formulas, although without additional
assumptions a conjunction of all involved variables
appears to be the most widely used choice. There is,
however, a convincing evidence for grouping certain
regulatory factors together in what are known as E-
boxes, D-boxes and RRE-s. From five gene core os-
cillator model two genes Per2 and Cry1 are included
in a single E-box, thus it is useful also to consider the
case where for transcription repression both of these
genes have to be active.
Based on these considerations we have con-
structed two different 5 gene HSM models Circa-
dian5A and Circadian5B. Circadian5A model con-
tains 5 genes Bmal1, Per2, RevErb, Cry1 and Dbp,
a single binding site for each of the genes, and uses
conjunctions for all gene regulatory functions:
Bmal1 = ¬RevErb,
Per2 = Bmal1 ∧ Dbp ∧ ¬Per2 ∧ ¬Cry1,
RevErb = Bmal1 ∧ Dbp ∧ ¬Per2 ∧ ¬Cry1,
Dbp = Bmal1 ∧ ¬Per ∧ ¬Cry1,
Cry1 = Bmal1 ∧ Dbp ∧ ¬RevErb ∧ ¬Per2 ∧ ¬Cry1.
Circadian5B model assumes that Per2 and Cry1
can act as repressors only when both of these genes
are active (i.e. all genes from a single E-box must be
present for regulatory activity:
Bmal1 = ¬RevErb,
Per2 = Bmal1 ∧ Dbp ∧ (¬Per2 ∨ ¬Cry1),
RevErb = Bmal1 ∧ Dbp ∧ (¬Per2 ∨ ¬Cry1),
Dbp = Bmal1 ∧ (¬Per2 ∨ ¬Cry1),
Cry1 = Bmal1 ∧ Dbp ∧ ¬RevErb ∧ (¬Per2 ∨ ¬Cry1).
Model Circadian3 contains only 3 genes Bmal1,
Per2, RevErb. With at most two regulators per gene
there is only a single natural choice for each of regu-
latory functions:
Bmal1 = ¬RevErb,
Per2 = Bmal1 ∧ ¬Per2,
RevErb = Bmal1 ∧ ¬Per2.
5 RESULTS
The main conclusions that have been obtained from
the proposed differential equation models (Korencic
et al., 2014; Pett et al., 2016) are that they allow to
model gene activity oscillation changes consistently
with experimentally measured values. The models fo-
cus on peak concentrations of oscillation phases, that
according to models are observed at the following se-
quence: Bmal1, RevErb, Dbp, Per2, Cry1. The exact
peak ordering, however, seems not very strongly de-
fined and can depend from the values of parameters
(which include explicit timing delays) that have been
fitted for specific version of the model. In particular,
the order of Per2 and RevErb concentration peak off-
sets in relation to Bmal1 can differ between the mod-
els and there appears to be lack of experimental evi-
dence for preference of one phase ordering versus an-
other for these two genes (Schmal et al., 2019). More-
over, model simulation results indicate that phase or-
der of concentration minimums can be different from
the order of concentration peaks (e.g. can be swapped
for Bmal1 and Cry1), and there is also experimental
evidence that phase order of concentration peaks for
some genes varies between different cell types. There
is very strong evidence, however that concentrations
growths alternate for Bmal1 and Per2/RevErb, with
timing of Bmal1 concentration peak approximately
coinciding with Per2 and RevErb concentration min-
imums.
In the context of analysis of our hybrid system
based models it should be noted, that the HSM for-
malism is actually designed for assessing the mod-
elled system’s behaviour as independently from the
exact values of protein concentrations as it possibly
can, thus the models are not necessarily expected to
provide information about the exact timing of concen-
tration maximum and minimum values. The explic-
itly modelled, however, are state transitions triggered
by association and dissociation of proteins from their
binding sites. Thus the minimal expectations for va-
lidity and usefulness of the models are the following:
1) all involved genes must participate in regulatory ac-
tivities; 2) the model state space should contain cyclic
trajectories that for each of the genes involve exactly
one transition triggered by its growth and exactly one
transition triggered by its decrease. A particular tran-
sition trajectory will place also certain constraints on
phase orders on concentration peaks and drops, but
generally several alternatives for such order shall be
possible.
The initial step of model analysis consists of iden-
tification of attractors. This has been a crucial step
for phage virus models that we have analysed pre-
viously, reducing the sizes of state spaces from tens
of thousands to few tens of nodes. For circadian cy-
cle models, however, we are interested in properties
of cyclic trajectories in model state spaces, which by
definition will belong to attractor regions, thus the re-
BIOINFORMATICS 2022 - 13th International Conference on Bioinformatics Models, Methods and Algorithms
134
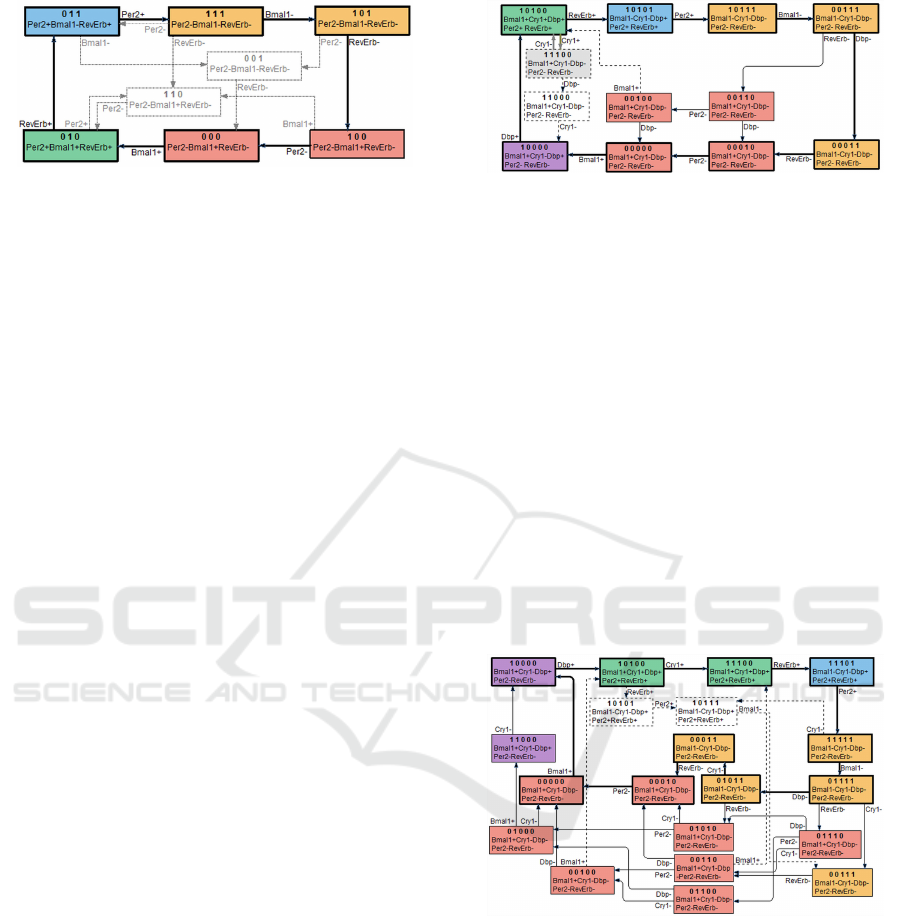
Figure 2: The stable region of state space of 3 gene cir-
cadian cycle model. The dotted transitions and states can
excluded by priority constraints, leaving as the only possi-
bility a single cyclic trajectory of 6 states. This is consistent
with the observed periodic activity oscillations.
duction of state space sizes, whilst useful, is less sig-
nificant. The state spaces consist of 8 nodes for Cir-
cadian3 model and 32 nodes for Circadian5A and
Circadian5B models, with single attractor regions of
sizes 8, 18 and 32 correspondingly.
The next step involves applying constraints to ex-
clude some transitions and nodes that during this step
become disconnected. Here use two priority con-
straints: 1) transitions triggered by RevErb are priori-
tised over transitions triggered by Per2; and 2) tran-
sitions triggered by a gene that have been growing
or decreasing in two or more consecutive states are
prioritised over transitions that are triggered by gene
growing or decreasing only at transition origin’s state.
The second of these constraints follows from a
natural assumption about transition delays – a protein
concentration needs some time either to grow or to
decrease to make a change in the modelled system’s
state. The first constraint can be interpreted either
as higher concentration change rate or lower binding
threshold for RevErb compared to Per2. In combina-
tion both these priority constraints are well consistent
with explicit conditions on transition delays that are
imposed on ODE models.
With attractor regions further restricted by these
constraints the Circadian3 model state space retains
6 nodes linked in a simple cycle with the follow-
ing transition triggering order: Bmal1+, RevErb+,
Per2+, Bmal1−, RevErb−, Per2− (Figure 2). Here
00
+
00
and
00
−
00
signs after the gene names indicate
whether the transition is triggered correspondingly
either by growth or decrease of the product of the
particular gene. The model predicts alternating and
synchronised oscillation patterns of genes Bmal1 and
Per2/RevErb, consistent with known experimental
data.
In five gene model Circadian5A with indepen-
dent repressory activities of Per2 and Cry1 genes the
attractor part of state space consists of 18 nodes and is
further reduced to 12 nodes by the applied reduction
rules (Figure 3). The model as one of behavioural tra-
Figure 3: The stable region and available trajectories in 5
gene model with independent repressory activity of Per and
Cry1 genes. The periodic activity oscillation of all 5 genes
in principle is feasible according to the model, but requires
synchronised traversing of two interlocked cycles.
jectories allows the same 6 state transition cycle that
is present in Circadian3 with genes Dpb and Cry1
not being involved in regulatory processes. There
are, however, several alternative 8-transition cycles
that additionally include regulatory activity by Dbp.
A more problematic is inclusion of Cry1 in regula-
tory activities – this can be achieved only by requiring
transitions to follow in alternating order one of the 8
transition cycles and a single 2 state cycle triggered
by Cry regulatory activity. Although such behaviour
in principle is possible according to the model, the
lack of any synchronisation between Cry1 and other
gene regulatory activities makes its biological accu-
racy very questionable.
Figure 4: The stable region and available trajectories in 5
gene model with repressory action requiring co-activity Per
and Cry1 genes. The model allows only cyclic trajectories
with periodic activity oscillation of all 5 involved genes,
consistently with biologically observed behaviour.
The situation is significantly more promising for
Circadian5B model. The attractor contains all 32
state space nodes, application of reducing rules re-
moves some of transitions, but not the nodes (Fig-
ure 4). The model allows 18 different types of 10 state
transition cycles (Table 1). Here transitions are refer-
enced by the first letter of the gene triggering them,
in upper case if triggered by growth and in lower case
if triggered by decrease of the gene’s product – e.g.
Hybrid Gene Regulation Models of Mammalian Circadian Cycles
135
B stands for Bmal1+ and b for Bmal1−). The model
does not give preference for each of these cycle types,
but of particular interest is cycle in the 4th row of the
table: Bmal1+, Dbp+, Cry1+, RevErb+, Per2+,
Bmal1−, Dbp−, Cry1−, RevErb−, Per2−, as it is
the only cycle that includes identical phase offsets
for activation and deactivation transitions triggered by
each of the genes.
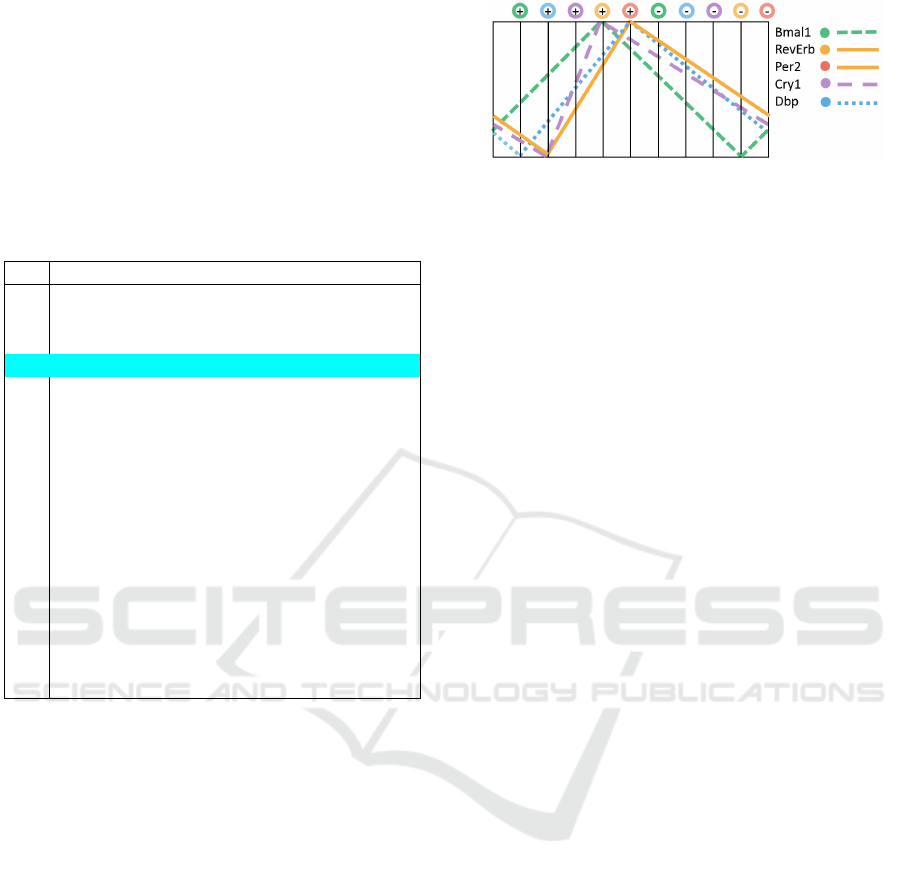
Table 1: All the possible sequences of gene activity state
transitions according to Circadian5B model.
1 2 3 4 5 6 7 8 9 10
1 B D C R P b c d r p
2 B D C R P b c r d p
3 B D C R P b c r p d
4 B D C R P b d c r p
5 B D C R P b d r p c
6 B D C R P b d r c p
7 B D C R P b r c d p
8 B D C R P b r c p d
9 B D C R P b r p d c
10 B D C R P b r p c d
11 B D C R P b r d p c
12 B D C R P b r d c p
13 B D C R c P b d r p
14 B D C R c P b r d p
15 B D C R c P b r p d
16 B c D C R P b r p d
17 B c D C R P b d r p
18 B c D C R P b r d p
In general this behaviour can be considered rea-
sonably consistent with predictions obtained from
ODE models, taking into account that in HSM frame-
work the focus is on the order of transitions between
gene regulatory states rather than offsets of concen-
tration peak phases (some of which appear to be more
the result of fitted parameter values rather than based
on experimental observations). As a strength of our
Circadian5B model should be emphasised the fact
that it predicts synchronised oscillation of all 5 genes
of core oscillator as the only behaviour that is possible
according to the model, independently from the val-
ues of any numerical parameters. Another strength is
the fact that comparison of both 5 gene circadian cy-
cle models indicates strong preference for collabora-
tive repressory action of Per2 and Cry1 genes, which
seems to be well supported by experimental evidence.
The changes of gene concentrations that are con-
sistent with Bmal1+, Dbp+, Cry1+, RevErb+,
Per2+, Bmal1−, Dbp−, Cry1−, RevErb−, Per2−
transition cycle are shown in Figure 5. Growth and
degradation of protein concentrations are shown as
linear functions for illustrative purpose only – accord-
Figure 5: Oscillations of gene expression activities that are
consistent with available trajectories in HSM model.
ing to the model these can be any monotone functions
reaching their maximal and minimal values at the
shown order (and not providing more detailed predic-
tions about the order at points in which depicted max-
imums and minimums for several genes coincide).
The figure also does not provide any indications about
the absolute concentration values of proteins nor any
comparison of concentrations rates between different
proteins. Since the model uses the same regulatory
functions for Per2 and RevErb genes, their concen-
tration changes are shown to be identical.
The predictions that can be obtained about pro-
tein concentration peak at minimum phases, assum-
ing that this particular 10 state transition cycle per-
sistently holds, are the following. For maximal values
the peaks of proteins Bmal1 and Cry1 must strictly al-
ternate with peaks of proteins RevErb, Per2 and Dbp
(without giving specific precedence for order of peak
phases in these two groups – these are also allowed
to vary between different cycles). The predicted se-
quence of minimal value phases is Bmal1, followed
by Dpb and then the group RevErb, Per2 and Cry1.
This is largely consistent with ODE simulation re-
sults as shown in (Pett et al., 2016). In particular,
the HSM model allows the same ordering of maxi-
mal peak phases, and (quite interestingly) also sug-
gests lower degradation rate for Cry1 in comparison
to Bmal1, which also seems to be implied by ODE
simulations. An outlier in this aspect is phase of min-
imal value of Dbp, which has different offset in com-
parison to ODE model predictions. As we already
have noted, however, the strengths of HSM based
models is prediction of state transition sequences, and
limited information can be derived about behaviour of
functions describing protein concentration changes.
6 DISCUSSION
The aim of this work was to assess the suitability of
HSM modelling framework for description of mam-
malian circadian cycle gene regulatory process, to de-
velop a number of concrete models for this purpose,
and to evaluate how well these models perform to
BIOINFORMATICS 2022 - 13th International Conference on Bioinformatics Models, Methods and Algorithms
136

replicate experimentally known data, and how useful
they might be for better understanding of biological
mechanism driving circadian cycle rhythm.
The proposed models can be regarded as suc-
cessful at these aspects. The models 3 gene Circa-
dian3 and 5 gene Circadian5B core oscillator mod-
els demonstrate cyclic activity switching for all the
included genes as the only type of behaviour that is
allowed under assumptions of these models. More-
over, the models allow only strictly synchronised ac-
tivity oscillations for all the involved genes. Such re-
sult might be less surprising for Circadian3 model,
where the potential of cyclic oscillations of all the 3
genes can be deduced from gene regulation ’wiring
diagram’ (Figure 1), still the fact that oscillations in-
volving only 1 or 2 genes can be excluded by simple
priority constraints was not immediately obvious.
For 5 gene model we can derive a concrete pre-
diction regarding gene regulatory functions – namely,
that to obtain biologically feasible model behaviour
genes Per2 and Cry1 should act in collaboration for
their repressory activity. Such collaborative action of
these genes is well supported by biologically known
facts about circadian cycle gene regulatory mecha-
nism. The corresponding model Circadian5B also
predicts synchronised oscillation of all 5 genes of
core oscillator as the only behaviour that is possi-
ble according to the model. There are several dif-
ferent sequences of transition orders that can lead
to this behaviour, with one of them in reasonably
good agreement with simulation results obtained from
ODE based models. There is a also good potential to
refine this model further (i.e. by explicitly including
in the model several different binding site affinities
for the same protein, introducing more complex reg-
ulatory functions, or additional priority constraints),
provided that there are some experimental/biological
data supporting specific modifications.
In a broader context HSM models for circadian
cycle that we describe here are the first attempt to ap-
ply HSM framework for modelling gene regulation in
more complex organisms, since all the previous mod-
els have been designed for viruses. As a use case
of modelling more complex organisms our proposed
models appear to be successful. They also allow to
identify challenges and research priorities that need to
be considered for development of such type of mod-
els.
REFERENCES
Brazma, A., Cerans, K., Ruklisa, D., Schlitt, T., and Viksna,
J. (2015). Modeling and analysis of qualitative be-
havior of gene regulatory networks. Lecture Notes in
Computer Science, 7699:51–66.
Brazma, A. and Schlitt, T. (2003). Reverse engineering of
gene regulatory networks: a finite state linear model.
Genome Biol., 4:P5:1–31.
Brazma, R., Cerans, K., Ruklisa, D., Schlitt, T., and Viksna,
J. (2013). HSM – a hybrid system based approach for
modelling intracellular networks. Gene, 518:70–77.
Ko, C. and Takahashi, J. (2006). Molecular components
of the mammalian circadian clock. Human Molecular
Genetics, 15(S2):R271–R277.
Korencic, A., Kasir, R., Bordyugov, G., Lehmann, R., Roz-
man, D., and Herzel, H. (2014). Timing of circa-
dian genes in mammalian tissues. Scientific Reports,
4:5782.
Leloup, C. and Goldbetter, A. (2003). Toward a detailed
computational model for the mammalian circadian
clock. PNAS, 100:7051–7056.
Morris, A., Stanton, D., Roman, D., and Liu, A. (2020).
Systems level understanding of circadian integration
with cell physiology. J Mol. Biol., 432(12):3547–
3564.
Pett, J., Korencic, A., Wessener, F., and Herzel, H. (2016).
Feedback loops of the mammalian circadian clock
constitute repressilator. PLOS Comp. Biol., 12(12).
Relogio, A., Westermark, P., Wallach, T., Schellenberg, K.,
Kramer, A., and Herzel, H. (2011). Tuning the mam-
malian circadian clock: robust synergy of two loops.
PLOS Comp. Biol., 7(12).
Ruklisa, D., Brazma, A., Cerans, K., T., S., and Viksna, J.
(2019). Dynamics of gene regulatory networks and
their dependence on network topology and quantita-
tive parameters – the case of phage lambda. BMC
Bioinformatics, 20:296.
Schlitt, T. and Brazma, A. (2006). Modelling in molec-
ular biology: describing transcription regulatory net-
works at different scales. Philos. Trans. R. Soc. Lond.
B, 361:483–494.
Schmal, C., Ono, D., Myung, J., Pett, J., Honma, S., and
Herzel, H. (2019). Weak coupling between intracellu-
lar feedback loops explains dissociation of clock gene
dynamics. PLOS Comp. Biol., 15(9):e1007330.
Ueda, H., Hayashi, S., Chen, W., Sano, M., Machida, M.,
Shigeyoshi, Y., Iino, M., and Hashimoto, S. (2005).
System-level identification of transcriptional circuits
underlying mammalian circadian clocks. Nature Ge-
netics, 37(2):187–192.
Ukai, H. and Ueda, H. (2010). Systems biology of
mammalian circadian clocks. Ann. Rev. Physiology,
72(1):579–603.
Yoshitane, H., Asano, Y., Sagami, A., Sakai, S., Suzuki, Y.,
Okamura, H., Iwasaki, W., Ozaki, H., and Fukada, Y.
(2015). Functional D-box sequences reset the circa-
dian clock and drive mRNA rhythms. Communica-
tions Biology, 2(1):300.
Hybrid Gene Regulation Models of Mammalian Circadian Cycles
137
