
A Robust Approach for a Real-time Accurate Screening of ST Segment
Anomalies
Giovanni Rosa
1 a
, Marco Russodivito
1
, Gennaro Laudato
1 b
, Angela Rita Colavita
2
,
Simone Scalabrino
1 c
and Rocco Oliveto
1 d
1
STAKE Lab, University of Molise, Pesche (IS), Italy
2
ASREM – Regione Molise, Italy
Keywords:
ST Anomalies, Temporal Window, Decision Support System, Machine Learning.
Abstract:
Nowadays, Computerized Decision Support Systems (CDSS) play an important role in medical support and
preventative care. In those scenarios, the monitoring of biomedical data, such as the ECG signal, is funda-
mental. The ECG signal may reveal a variety of abnormalities or pathological conditions. Some examples are
Ischemia and Myocardial Infarction (MI), with a significant impact on the world’s population. Both these con-
ditions can be diagnosed by observing changes in specific sections of the ECG, such as the ST segment and/or
T-wave of heartbeats. Much effort was devoted by the scientific community to aim at automatically identifying
ST anomalies. The main drawback of such approaches is often a trade-off between the accuracy in the clas-
sification, the robustness to noise, and the real-time responsiveness. In this work, we present RAST, a robust
approach for a Real-time Accurate screening of ST segment anomalies. RAST takes as input a sequence
of 10 successive heartbeats extracted from an ECG recording and provides as output the classification of the
ST segment trend. We evaluated two versions of RAST, namely RAST-BINARY, and RAST-TERNARY:
the first capable of distinguishing only between an ST anomaly and Normal Sinus Rhythm and the second
able to distinguishing between ST elevation, ST depression, and normal rhythm. Moreover, we conducted an
extensive study by experiment also (i) the validation within the intra- and inter-patient strategies and (ii) the
ideal number of successive heartbeats in which to observe an anomalous episode of change in the ST segment.
As a result, both RAST-BINARY and RAST-TERNARY can achieve an F1 score of 0.94 with a window of
4 heartbeats in the inter-patient validation. For the intra-patient validation, both versions achieve an F1 score
of 0.73 using a longer observation window.
1 INTRODUCTION
Decision Support Systems (DSS) have been estab-
lished as tools for applying guidelines and support
medical decisions in the industrialized world. Such
systems can be defined as ”any intervention that pro-
vides physicians with clinical knowledge and patient-
specific information to enhance patient care deci-
sions” (Berner, 2007). Many works, focused on the
review of the scientific literature, have found that
Computerized Decision Support Systems (CDSS) im-
prove preventative care, clinical performance and in-
a
https://orcid.org/0000-0002-5241-1608
b
https://orcid.org/0000-0002-3776-2848
c
https://orcid.org/0000-0003-1764-9685
d
https://orcid.org/0000-0002-7995-8582
fluence clinical decision making (Kawamoto et al.,
2005; Balas et al., 1996). This is the case where such
systems are used in a computerized system for medi-
cal support. Indeed, when used in this context, CDSS
considerably improve decision quality (Sintchenko
et al., 2004).
ECG is an important signal to investigate since it
is both noninvasive and suggestive of a variety of ab-
normalities. Ischemia and Myocardial Infarction (MI)
are two of the most severe of these abnormalities.
According to recent research (Khan et al., 2020),
ischemic heart disease affects roughly 126 million
people worldwide therefore around 1.72 percent of
the world’s population. On the other hand, by con-
sidering only the United States, roughly 1.5 million
instances of myocardial infarction occur each year,
with a yearly incidence rate of around 600 cases per
Rosa, G., Russodivito, M., Laudato, G., Colavita, A., Scalabrino, S. and Oliveto, R.
A Robust Approach for a Real-time Accurate Screening of ST Segment Anomalies.
DOI: 10.5220/0010824000003123
In Proceedings of the 15th International Joint Conference on Biomedical Engineering Systems and Technologies (BIOSTEC 2022) - Volume 5: HEALTHINF, pages 69-80
ISBN: 978-989-758-552-4; ISSN: 2184-4305
Copyright
c
2022 by SCITEPRESS – Science and Technology Publications, Lda. All rights reserved
69

100,000 persons
1
. Changes in the ST segment (and/or
T-wave) of ECG heartbeats are indicative of both of
these abnormalities (Hadjem et al., 2016).
Therefore it would be extremely important to have
accurate and rapid automatic ECG analysis tools in
order to detect these events and thus allow the medical
team to manage them in a timely manner. Consider-
ing that digital clinical data are now well-established
and available in large amounts, this procedure would
also avoid the burden on the medical staff of having
to manually analyze the various electrocardiographic
recordings.
Harun-Ar-Rashid et al. (2020) proposed a method
to identify five categories of ST segment using the
correlation algorithm. Their approach embedded the
following steps (i) ECG filter and detrend (ii) R and
S waves identification (iii) detection of ST segment
start and endpoint (iv) comparison between this signal
with supervised data (v) classification of the ST seg-
ment based on the correlation value. This approach
allowed to reach an overall accuracy of 92,1 % but, as
stated by the same authors, it presented some limita-
tions, such as the strict dependency on the ECG pre-
processing and annotation stages (for R and S waves
with low amplitudes, it is too complicated the identifi-
cation of the ST segment) and the computational cost
(for long term ECG signal this method took time to
elaborate).
In this paper, we present RAST (a robust ap-
proach for a Real-time Accurate screening of ST seg-
ment anomalies), an approach for the real-time iden-
tification of ST anomalies. RAST does not provide
much information on the specific ST-change, but—in
its most accurate version—it provides only the dis-
tinction between an ST change and a Normal rhythm.
In this case, RAST outperforms state of the art.
Specifically, the baseline work proposed by Harun-
Ar-Rashid et al. (2020) was kept as reference due to
its recent release and high accuracy.
RAST has been an experiment on a well-
consolidated dataset in the scientific community,
namely the Physionet European ST-T Database
2
(Goldberger et al., 2000).
RAST is part of the DSS embedded in ATTICUS
(Laudato et al., 2021), an innovative system aimed
at improving healthcare services thanks to the adop-
tion of a wearable device (De Vito et al., 2021) which
is in charge of acquiring several vital signals, such as
1
MEDSCAPE ”What is the incidence of myocardial
infarction (MI, heart attack) in the US?” accessed on
8-sep-2021 https://www.medscape.com/answers/155919-
15093/what-is-the-incidence-of-myocardial-infarction-mi-
heart-attack-in-the-us
2
https://physionet.org/content/edb/1.0.0/
ECG, respiration waves, body temperature, and dy-
namics) and a strong Artificial Intelligence oriented
software solution (Balestrieri et al., 2019).
With respect to this state of the art method, RAST
shows the following advantages:
• it is independent of ECG annotation algorithms,
which are not very robust to noise due to the de-
tection of waves characterized by very low electri-
cal amplitudes (Tateno and Glass, 2000; Lake and
Moorman, 2011; Sun and Thakor, 2015)
• it has higher computational efficiency
• it is (near) real-time
• it provides better global accuracy
As a disadvantage, RAST provides less refine-
ment in the classification because we propose a bi-
nary or ternary classification while the baseline work
is able to distinguish ST changes in 5 classes.
For this reason, we believe that RAST is more
for use in high-precision rapid screening applications,
and then leave the work to algorithms with more re-
fined classifications or directly to specialized medical
staff.
The rest of the paper is structured as follows: Sec-
tion 2 describes the background and related works on
the ECG anomalies due to ST change and a brief re-
view of the scientific literature dedicated to the au-
tomatic detection of ST change episodes. Section 3
provides details on the proposed approach, and Sec-
tion 4 describes the details of the design of the study,
in particular for the experimental procedure adopted.
Section 5 reports on the results obtained by RAST
and Section 6 contains a discussion on the limitations
of this study. Finally, Section 7 concludes the paper.
2 BACKGROUND AND RELATED
WORKS
In this section, first is reported a background on the
ST anomalies in terms of clinical features and inci-
dence of the connected pathologies. The second sub-
section is focused on the state-of-the-art works dedi-
cated to the automatic analysis of ST anomalies, with
a particular focus on the chosen baseline.
2.1 ST Anomalies
The oxygen requirement in the heart muscle varies de-
pending on the state of the body. The deviation of
the ST segment in the ECG is caused by an imbal-
ance between oxygen demand and supply. Myocar-
dial ischemia is a cardiac function problem caused by
HEALTHINF 2022 - 15th International Conference on Health Informatics
70

a lack of oxygen delivery to the heart muscle. Silent
ischemia is a type of transitory ischemia that occurs
without causing any symptoms, such as an unpleasant
feeling in the breast. If this imbalance frequently oc-
curs over time without appropriate therapy, the dam-
aged heart tissue dies and the damage becomes per-
manent, resulting in cardiac infarction (Jeong and Yu,
2006).
Hyperacute or Inverted T-wave are typical signs of
ischemia, which is usually the initial stage. The next
step is MI—which is marked by ST segment elevation
Figure 1 C—which is usually iso-electric in healthy
people. ST segment depression (Figure 1 B) can also
be a symptom of a MI (Hadjem et al., 2016).
2.2 Automatic Detection of ST
Anomalies
Monitoring the endpoint of the S wave to the start
point of the T wave identifies myocardial ischemia.
This section of the ECG signal is known as the ST
segment.
The scientific literature has done many efforts to
contribute the research dedicated to the automatic de-
tection of ST changes.
One of the first papers that took into account the
automatic analysis of ST change is the one proposed
by Maglaveras et al. (1998). The final aim of this
work was to develop an automatic approach—based
on an adaptive Backpropagation Neural Network—
for real-time ischemia episodes detection. Their re-
sults showed that the average ischemia episode detec-
tion sensitivity was 88.62 % while the ischemia dura-
tion sensitivity is 72.22 %. The method employed in
this study was different from prior algorithms in that it
did not rely on the J-point—which could be difficult
to identify—and instead relied on information from
the whole ST pattern. By averaging the ST segments
of the first 10 beats, the average template offered an
initial assessment of each patient’s physiological ST
depression (or elevation). For the same patient, in-
deed, the authors stated that this estimate did not ap-
pear to alter significantly over time.
Xiao et al. (2018) proposed a study in which
introduced an image-based method combined with
a deep learning technique for the detection of is-
chemic ST change from an ECG. A CNN model was
trained using a transfer learning technique and eval-
uated on independent sessions in the Long Term ST
database
3
utilizing 24-hour ambulatory ECG record-
ing sessions. The suggested CNN model was able to
identify testing images in real-time with an AUC of
3
https://physionet.org/content/ltstdb/1.0.0/
89.6 %. At the 10-second sample level, their model
achieved an average sensitivity of 84.4 % at selected
optimum cutoff levels.
Wang et al. (2018) developed a beat-by-beat clas-
sification method based on multiple feature extrac-
tion. The ST section was found first. The ST
segment’s morphological and Poincar
´
e characteristics
were then retrieved and merged with the global fea-
ture. Finally, the ST segment change was classified as
normal, high, or depressed using random forest. The
algorithm was tested on the European ST-T Database,
with average sensitivity of 85.2 %, 86.9 %, and 88.8
% for normal, depressed, and high ST segments, re-
spectively. The results demonstrate that the proposed
method was effective in identifying ST segment ele-
vation and depression automatically, revealing addi-
tional information about the ischemia condition.
From the above review, we opted for adopting the
preprocessing stage as the one proposed in Maglav-
eras et al. (1998), which will be further detailed in
Section 3.
Harun-Ar-Rashid et al. (2020) automatically iden-
tified ST segments and classified those into five
classes. The authors, according to a set of rules they
designed, opted for using five classes (Concave, Con-
vex, Elevation, Depression, Normal) instead of the
three ones provided by Physionet (Elevation, Depres-
sion, Normal) within the annotations of the dataset
4
.
The work proposed in this paper embedded ini-
tial denoising preprocessing based on the application
of the Savitzky-Golay Smoothing filter and then the
ECG signal’s detrend to get rid of linear and non-
linear trends.
After completing the above steps, to identify an
ST segment, this method embedded two stages of
ECG annotations:
1. a method to detect R waves;
2. depending on the outcome of the previous R peak
detector, the next steps depended on the full anno-
tation of an ECG segment to have available S and
T waves and J point.
Finally, this approach used cross correlation based
on supervised data: indeed, for each ST segment, the
cross correlation with a supervised ST segment was
performed to measure the similarity between the iden-
tified ST segment and the category of ST change.
The authors experimented their approach on two
datasets: (i) the Physionet European ST-T change
database where they obtained 95,58 %, 95,92 %,
97,86 %, 95,18 % and 96,36 % and (ii) the Physionet
MIT-BIH ST change database where they achieved
4
https://physionet.org/content/edb/1.0.0/annotations.shtml
A Robust Approach for a Real-time Accurate Screening of ST Segment Anomalies
71

Figure 1: (a) Normal heartbeat, (B) ST segment depression, (C) ST segment elevation.
98,77 %, 97,47 %, 90,35 %, 85,03 %, 69,42 % re-
spectively for the five categories of ST shapes Con-
cave, Convex, Up slope, Down slope and Horizontal.
In the discussion of their paper, the authors stated
that there are some threats to validity and limitations.
For example, they confirmed that the approach was
too dependent on the outcome of the preprocessing
stage. Indeed, without proper ECG preprocessing, ST
segments could not be correctly identified. One of the
biggest problem with their method is that the annota-
tion of R and S waves is often complicated due to their
typical low amplitude (Tateno and Glass, 2000; Lake
and Moorman, 2011; Sun and Thakor, 2015). Finally,
the authors commented on the computational perfor-
mance of their method by reporting that for long-term
ECG signals, the approach took time to evaluate.
However, the overall accuracy obtained was 92,1
%. This value will be kept as a reference for the com-
parison of RAST with respect to one of the most ac-
curate and recent work from state-of-the-art.
3 RAST- A ROBUST APPROACH
FOR A REAL-TIME ACCURATE
SCREENING OF ST SEGMENT
ANOMALIES
The complete workflow of RAST is depicted in Fig-
ure 2.
As the first step, the approach needs a digital ECG
pattern composed of 10 successive heartbeats. To do
so RAST buffers and evaluates the ECG until 10 R
waves are detected—this latter condition is validated
through the Pan-Tompkins method (Pan and Tomp-
kins, 1985), and it is necessary to define a pattern of
10 heartbeats. Once acquired such an ECG segment, a
multi-domain algorithm generates the features vector
for the final classification stage.
3.1 Preprocessing
A first stage of preprocessing is applied to the ECG
signal as described in the method proposed by (Pan
and Tompkins, 1985). This procedure for the R waves
detection needs to apply two successive filters—low-
pass and high-pass—in order to get rid of the base-
line wander and select the frequency band where the
R peaks are contained. Then, a derivated filter has to
be applied to the signal. The remaining steps are not
strictly related to the ECG filtering but are dedicated
to improving the R peak detection (e.g., squaring and
dynamic thresholding).
A second stage of preprocessing is expected in
RAST once the ECG pattern of 10 successive heart-
beats is successfully acquired. In this case, the signal
is submitted to a detrend operation.
3.2 Generation of the Features Vector
The features vector is generated through the evalu-
ation of multi-domain features calculated from the
ECG pattern of 10 heartbeat signals. Specifically, for
each pattern, the following features are evaluated:
• Energy of Maximal Overlap Discrete Wavelet
Transform (EMO-DWT) (Ghaemi et al., 2019).
• Autoregressive Model (AR) coefficients of order
4 (Zhao and Zhang, 2005).
• Multifractal Wavelet (MFW) leader estimates
of the log-cumulants of the scaling exponents
(Leonarduzzi et al., 2010).
• Fast Fourier Transform (FFT).
These features have demonstrated their informa-
tion power in other scientific works (Rosa et al.,
2021a,b).
HEALTHINF 2022 - 15th International Conference on Health Informatics
72
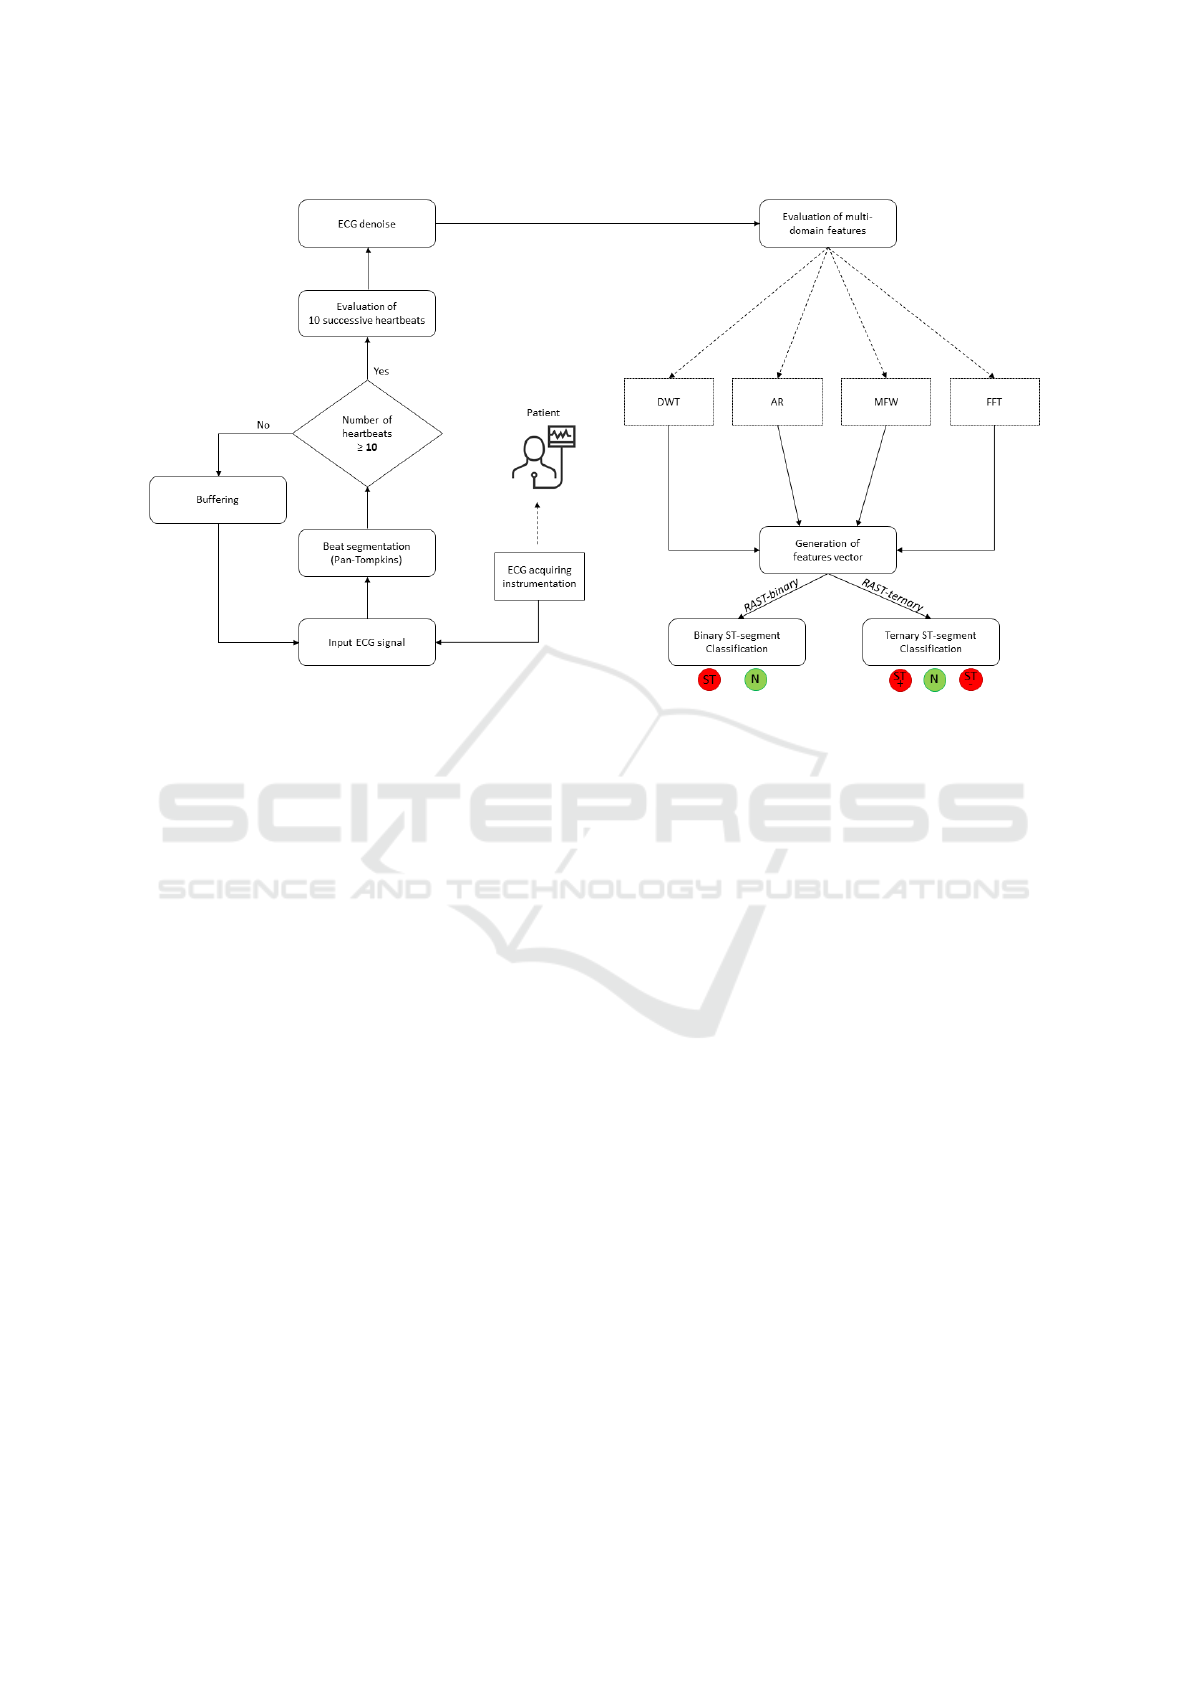
Figure 2: The complete workflow of RAST.
3.3 Classification Stage
The classification stage is the final step of RAST.
This is composed of an ML algorithm in charge of
providing information on the category for each pat-
tern of heartbeats.
To conduct exhaustive experimentation, we pro-
pose in this study a more high-level classification
experiment where we studied the performance of
RAST in distinguishing between Normal and ST
anomaly (RAST-BINARY in Figure 2) and a more
refined classification experiment where we evaluated
RAST in the capability of identification between Nor-
mal, ST Elevation and Depression anomalies (RAST-
TERNARY in Figure 2).
This way of studying the performances of RAST
led to the version of the tool: RAST-binary and
RAST-ternary depending on the number of outputs.
With this choice, we aimed at measuring the perfor-
mance of the tool in two different scenarios: (i) when
used in applications of rapid screening, such as when
only a rapid and accurate detection is requested and
(ii) when the medical constraints request information
also on the category of the ST segment.
More details will be reported in Section 4, focused
on the design of the study.
4 DESIGN OF THE STUDY
The goal of this paper is to study the performances
of a real-time screening algorithm for ST anomalies
detection. To do so, we implemented RAST, a tool
designed to be robust to noise because it is indepen-
dent of any ECG annotator algorithm except for the R
waves—that are the most prominent clinical features
of an ECG and the least susceptible to various kinds
of noise (Huang et al., 2010).
This study is steered by the following research
question:
RQ
1
: To what extent does the accuracy of
a binary or ternary detector of ST-segment
anomalies vary?
RQ
2
: Can a real-time and noise-robust ap-
proach outperform the accuracy of a state-of-
the-art method?
With the first research question, we aim at inves-
tigating the capability of a Machine Learning model
in identifying ST segment in a binary problem (ST
anomaly vs Normal Rhythm) and in a more specific
problem (ST segment depression and elevation and
Normal Rhythm). With the second research ques-
tion, we aim at studying the overall accuracy of the
above methods and compare it with the updated state
of the art of reference. Therefore, as a baseline ap-
proach, we chose one of the most recent and accurate
A Robust Approach for a Real-time Accurate Screening of ST Segment Anomalies
73

methods from the scientific literature of reference, the
work proposed by Harun-Ar-Rashid et al. (2020).
4.1 Context of the Study
The European ST-T Database is designed for use in
evaluating methods for ST and T-wave change analy-
sis. This resource contains 90 annotated ambulatory
ECG recordings from 79 individuals. The participants
included 70 males ranging in age from 30 to 84, and
8 women ranging in age from 55 to 71. (For one sub-
ject, information is absent.)
With lengths ranging from 30 seconds to several
minutes, the database contains 367 occurrences of ST
segment change and 401 episodes of T-wave change.
Each two-hour record comprises two signals sam-
pled at 250 samples per second with 12-bit resolution
across a notional 20-millivolt input range.
Two cardiologists annotated each record beat by
beat, looking for changes in ST segment and T-wave
shape, rhythm, and signal quality. The ST annotations
in this database mark transient ST changes superim-
posed on any fixed elevation or depression.
We did not use the MIT-BIH ST Change DB
5
be-
cause the annotation files contain only beat labels;
they do not include ST change annotations, as in the
European ST-T Database.
4.2 Experimental Procedure
To conduct an exhaustive study, we experimented
with a large set of parameters within several vali-
dation schemes. This way to conduct the study is
in the perspective of research that aims at observing
the classification performances under many points of
view. More details are provided in the next subsec-
tions.
4.2.1 Tuning of the Parameters
We opted for studying the performances of RAST as
different parameters vary, such as:
• The TWHO (Temporal Window for the Heart-
beat Observation): the literature work (Maglav-
eras et al., 1998) proposed an observation of 10
successive heartbeats. We opted to evaluate the
performances of RAST for the observation win-
dows in the set [4, 6, 8, 10, 16, 32, 64] where each
value corresponds to the number of heartbeats to
be evaluated. We opted for the typical length in
terms of powers of 2 [4, 8, 16, 32, 64] with two
more lengths of 6 and 10 heartbeats in order to as-
5
https://physionet.org/content/stdb/1.0.0/
sess, with more efficacy, the best length close to
the one proposed in the literature.
• The SAMPLING Technique: we opted to keep
this choice as a parameter, in the sense that we
measured the performances of RAST with and
without the application of the SMOTE (Chawla
et al., 2002) technique for the balancing of the
dataset.
• The ALGORITHM: in order to assess the most
fitting Machine Learning algorithm for RAST,
we experimented several classification models.
The tuning of these parameters was performed on
the whole dataset.
This phase of tuning of the parameters was un-
dertaken to look for the best configuration of RAST.
Considered that the experimentation was undertaken
for only one dataset, to avoid any data overfitting,
we experimented with each tuning phase under two
robust validation schemes: 80-20 random-split and
L1SO.
4.2.2 Validation Schemes
To avoid any data overfitting and to offer a complete
overview of the results, two validation schemes were
adopted for the assessment of the RAST’s perfor-
mances. In detail, the tool was experimented through
the:
• 80-20 random-split validation: in this scenario,
the dataset is decomposed in 80 % and 20 % of
the instances for the training and testing set, re-
spectively. With this kind of data separation, the
cardiac data related to a subject can be found both
in the training and testing dataset. To avoid any
favorable data division and, therefore, to decrease
the randomness of the results, we repeated the ex-
periment 1000 times. This validation scheme can
be interpreted as the scenario in which RAST has
to provide an outcome on a patient and its model
may have observed in the past data of the same
patient.
• L1SO (Leave 1 Subject Out): this procedure im-
plies that one person is left out of the training set
at a time, resulting in the training set containing
no data of the person being tested (the classifier
was not tuned with the test data of that person).
This is possible because each data segment has
an anonymous label that corresponds to an indi-
vidual. Thus, this validation scheme can be in-
terpreted as the scenario in which RAST has to
provide an outcome on a patient and its model has
never been trained on the data of that patient.
HEALTHINF 2022 - 15th International Conference on Health Informatics
74

4.3 Screening Experiments
To answer RQ1, we studied the performances of
RAST under two different screening experiments:
• RAST-BINARY: in this case, the classification
performances of RAST have been studied only
depending on its capabilities in distinguishing be-
tween an ECG segment Normal and with ST
anomaly.
• RAST-TERNARY: with this configuration,
RAST provides three outcomes Therefore, it
is studied for the identification of Normal, ST
Depression, and ST Elevation.
RAST-BINARY is an algorithm more suitable
when used in rapid and accurate screening applica-
tions because it is capable only of distinguishing be-
tween a generic ST anomaly and a Normal ECG. On
the other hand, RAST-TERNARY could be used in
applications of detection (and not simple screening)
because it is capable of providing additional informa-
tion on the ST anomaly, as in the case of depression
or elevation.
The authors of the paper chosen as baseline
(Harun-Ar-Rashid et al., 2020) for the comparison of
RAST opted for defining two more classes of ST seg-
ment categories (i.e., Convex and Concave), accord-
ing to a set of rules they designed. We opted to work
with the only annotations provided by the Physionet
cardiologists. Therefore, the comparisons between
RAST and the baseline can be mostly made in terms
of overall accuracy.
5 ANALYSYS OF THE RESULTS
The results of RAST are reported according to the
screening experiment. For the sake of space limita-
tion, we report here only part of the results. The full
report can be found at the following replication pack-
age
6
.
We used the typical classification metrics to assess
the capability of the several configurations of RAST
in the detection of ST anomalies. These metrics are:
• Accuracy =
T P+T N
T P+T N+FP+FN
• Specificity =
T N
T N+FP
• Precision =
T P
T P+FP
• Recall =
T P
T P+FN
• F1 Score =
2T P
2T P+FP+FN
6
https://github.com/grosa1/healthinf2022-st-anomalies-
replication-package
Table 1: The performances of RAST-BINARY in terms
of the main classification metrics for the experiment with
L1SO among all the heartbeat windows.
Window Acc Spec Prec Recall F1 Score
4 beats 76,31 33,09 84,57 76,31 72,79
6 beats 75,98 32,88 84,63 75,98 72,47
8 beats 76,37 33,33 85,48 76,37 72,78
10 beats 75,11 31,57 84,66 75,11 71,09
16 beats 76,49 24,94 86,21 76,49 70,17
32 beats 76,11 23,57 86,70 76,11 69,73
64 beats 75,00 30,28 83,52 75,00 70,83
Table 2: The performances of RAST-BINARY in terms of
the main classification metrics for the experiment with 80-
20 validation scheme among all the heartbeat windows.
Window Acc Spec Prec Recall F1 Score
4 beats 92,93 81,20 92,89 92,93 92,69
6 beats 92,76 80,60 92,73 92,76 92,49
8 beats 92,76 80,68 92,72 92,76 92,49
10 beats 92,60 80,08 92,58 92,60 92,31
16 beats 92,38 79,42 92,35 92,38 92,07
32 beats 91,70 77,50 91,67 91,70 91,32
64 beats 90,97 75,35 90,96 90,97 90,50
5.1 Selecting the Most Fitting ML
Algorithm
The performances of the algorithms under validation
are depicted in Figure 3 for RAST-BINARY. This fig-
ure is only illustrative because it was obtained with
a specific configuration of parameters. However, the
Random Forest model was found to be the most ac-
curate model among all the parameters tuning and
validation schemes and for both RAST-BINARY and
RAST-TERNARY.
5.2 RAST-BINARY
The results of RAST-BINARY within the L1SO are
depicted in Table 1 and Figure 4. The best accuracy
found was 76,49 % obtained with a pattern of 16 suc-
cessive heartbeats.
On the other hand, RAST-BINARY when submit-
ted to a 80-20 random-split validation scheme shows
the performances reported in Table 2 and Figure 5.
The best accuracy found was 92,93 % obtained with
a pattern of 4, 6, 8 or 10 successive heartbeats (with
slightly more precision for 6 heartbeats).
Finally, the results of RAST-BINARY with the
dataset balanced according to SMOTE and within the
80-20 random-split validation scheme are reported in
Table 3 and Figure 6. In this case, the best accuracy
was 93,61 % obtained with a window of 4 heartbeats.
A Robust Approach for a Real-time Accurate Screening of ST Segment Anomalies
75
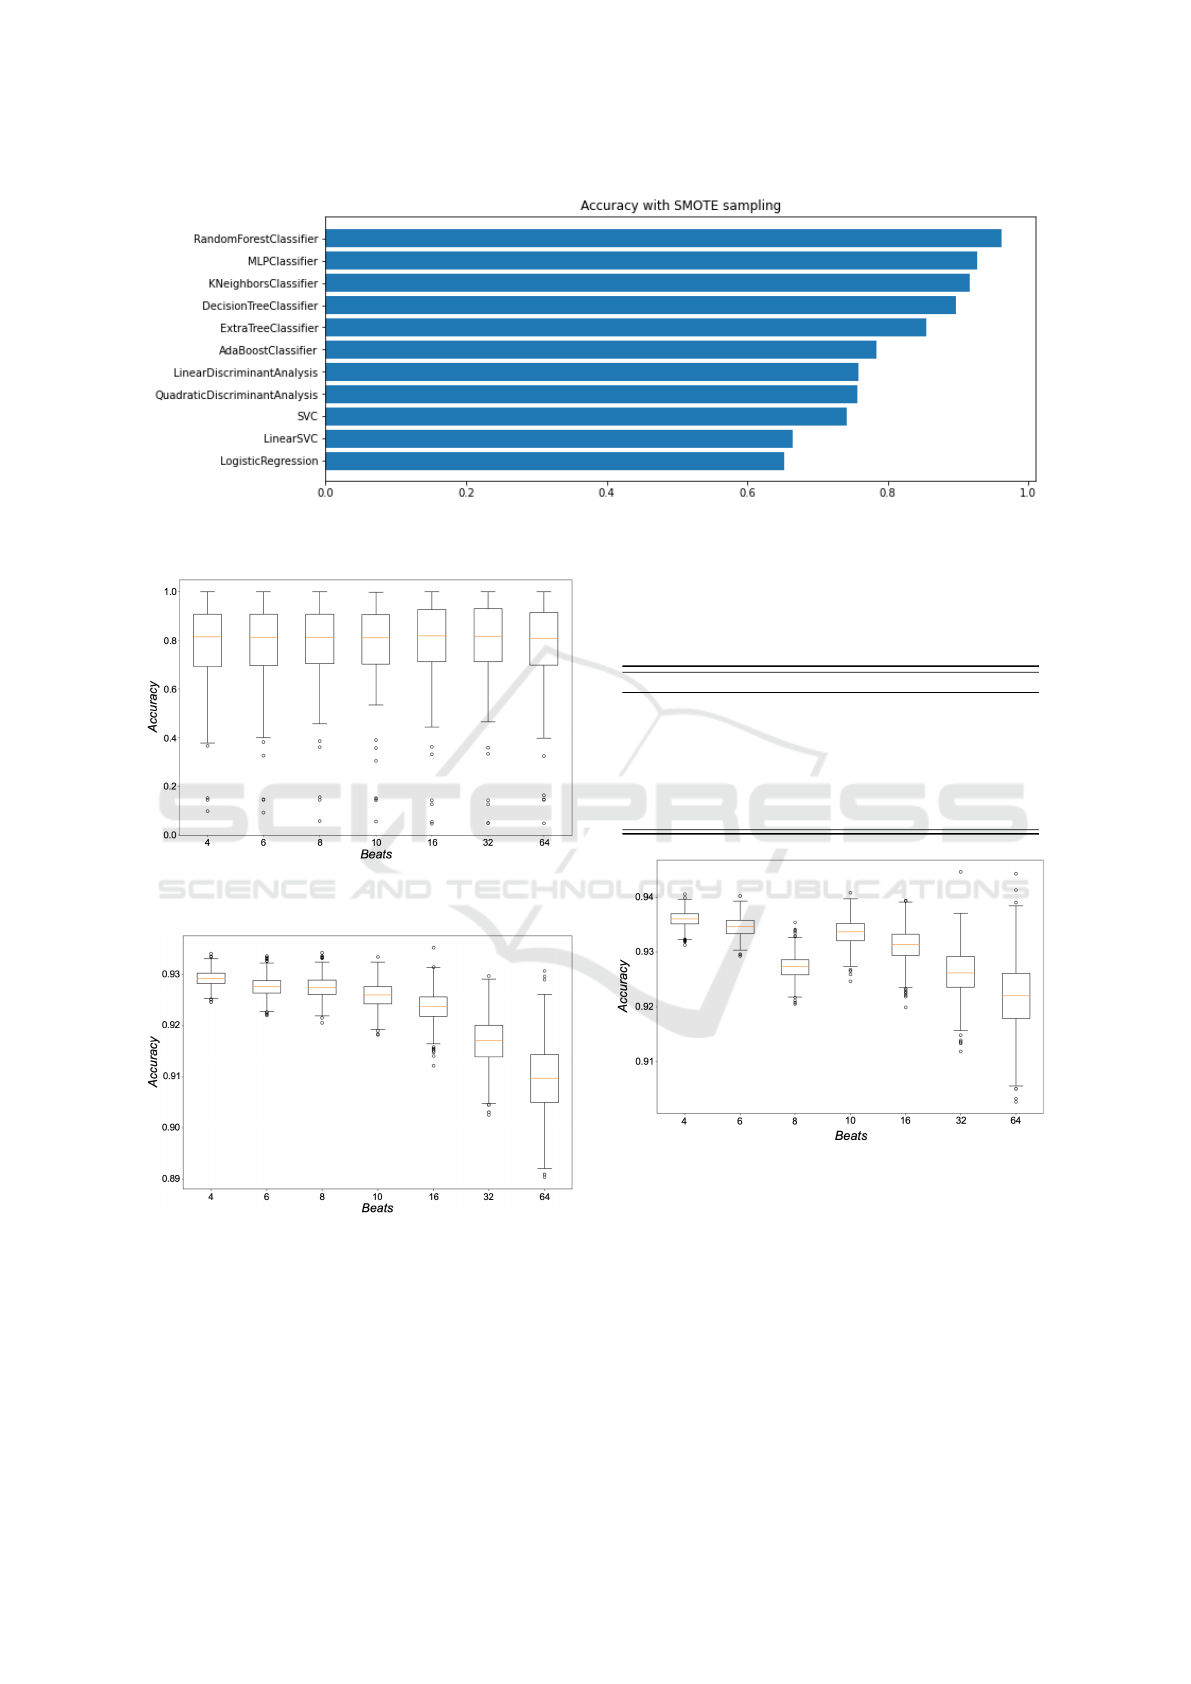
Figure 3: A demonstrative iteration for all the evaluated Machine Learning algorithms with the configuration of 10 heartbeat
window length and 80-20 validation scheme for RAST-BINARY.
Figure 4: Boxplot of the accuracies obtained within the
L1SO validation scheme for RAST-BINARY.
Figure 5: Boxplot of the accuracies obtained within the 80-
20 random-split validation scheme for RAST-BINARY.
5.3 RAST-TERNARY
The results of RAST-TERNARY within the L1SO
are depicted in Table 4 and Figure 7. The best accu-
racy found was 77,35 % obtained with a pattern of 4,
6 or 8 successive heartbeats (with slightly more pre-
cision with 8 heartbeats).
Table 3: The performances of RAST-BINARY in terms of
the main classification metrics for the experiment with 80-
20 random-split validation scheme and SMOTE among all
the heartbeat windows.
Window Acc Spec Prec Recall F1 Score
4 beats 93,61 88,62 93,61 93,61 93,61
6 beats 93,46 88,33 93,47 93,46 93,46
8 beats 92,73 88,60 92,88 92,73 92,79
10 beats 93,36 88,13 93,37 93,36 93,37
16 beats 93,13 87,79 93,14 93,13 93,14
32 beats 92,63 86,71 92,63 92,63 92,62
64 beats 92,21 85,63 92,19 92,21 92,19
Figure 6: Boxplot of the accuracies obtained within the
80-20 random-split validation scheme for RAST-BINARY
with the application of the SMOTE technique.
On the other hand, RAST-TERNARY when sub-
mitted to an 80-20 random-split validation scheme
shows the performances reported in Table 5 and Fig-
ure 8. The best accuracy found was 92,76 % ob-
tained with a pattern of 4, 6 successive heartbeats
(with slightly more precision for 4 heartbeats).
Finally, the results of RAST-TERNARY with the
dataset balanced according to SMOTE, and within the
80-20 random-split validation scheme are reported in
HEALTHINF 2022 - 15th International Conference on Health Informatics
76
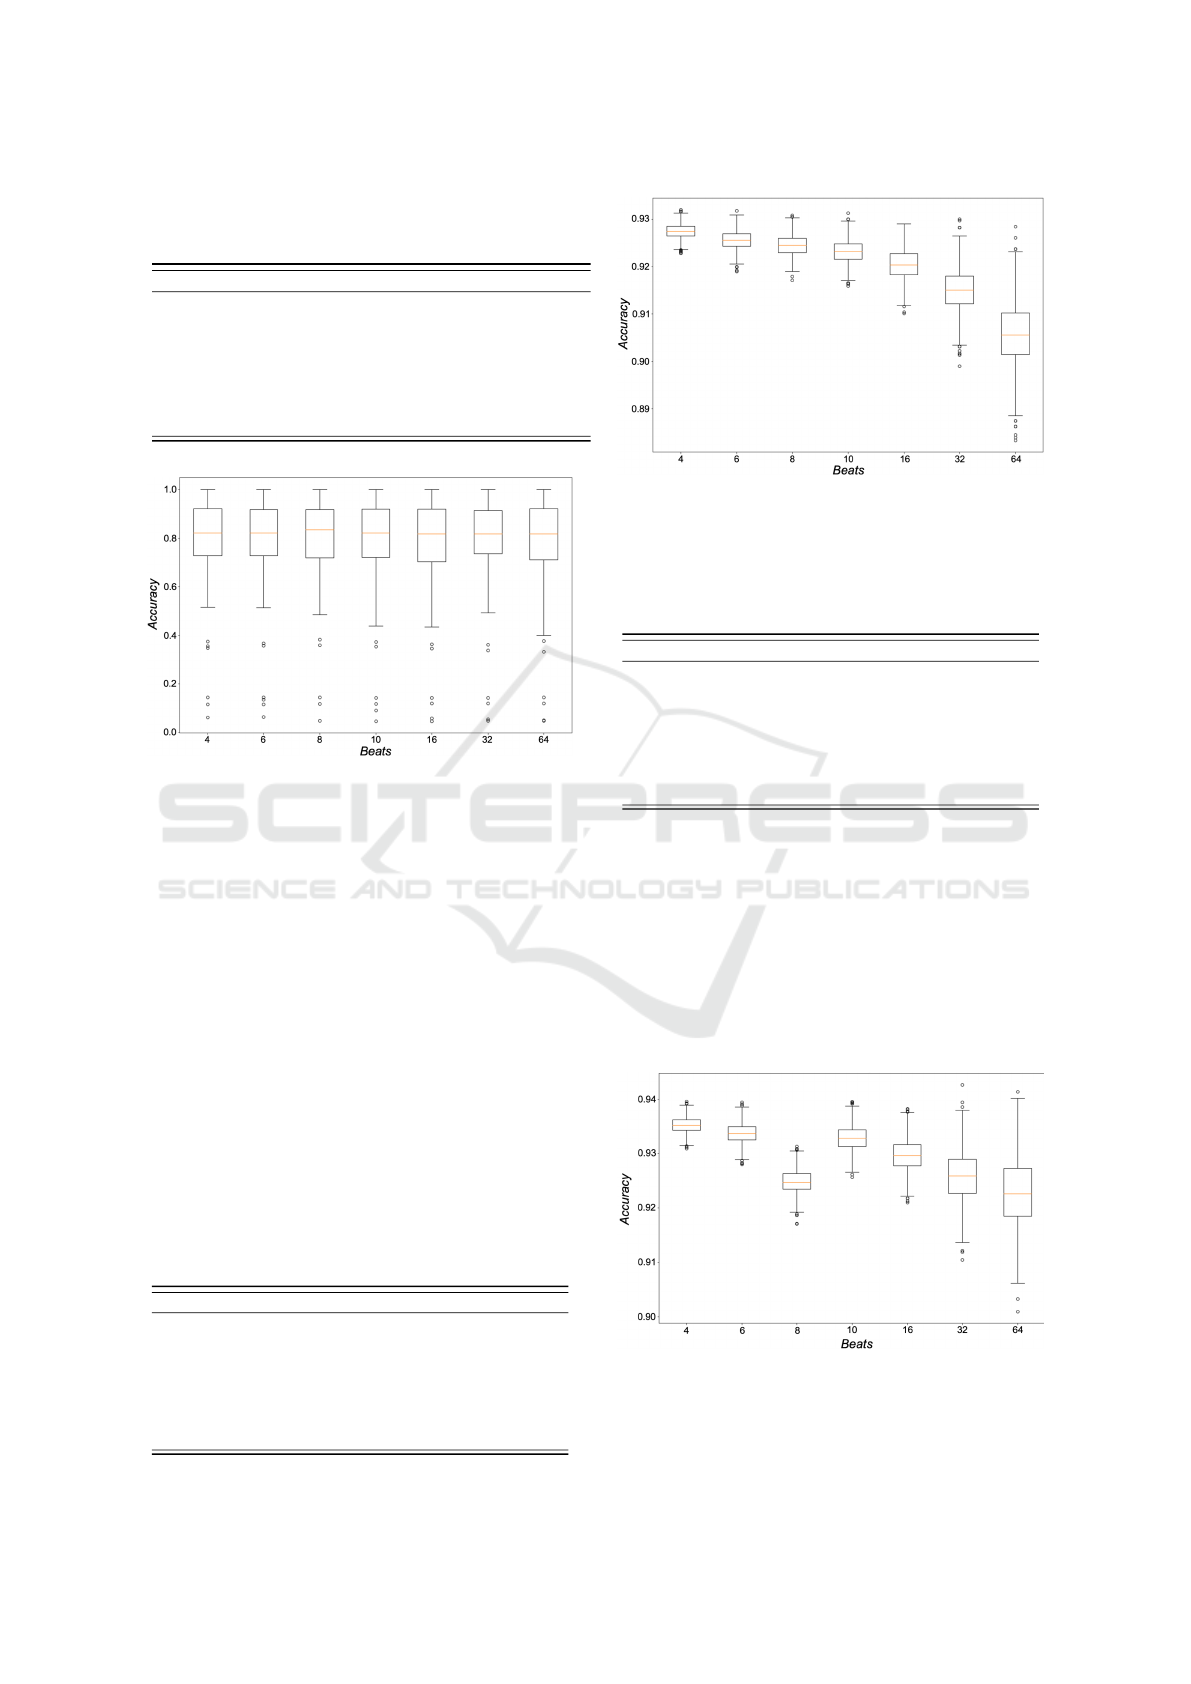
Table 4: The performances of RAST-TERNARY in terms
of the main classification metrics for the experiment with
L1SO among all the heartbeat windows.
Window Acc Spec Prec Recall F1 Score
4 beats 77,04 31,79 85,33 77,04 72,58
6 beats 76,70 30,82 84,90 76,70 71,90
8 beats 77,35 31,40 86,05 77,35 72,83
10 beats 76,24 29,69 86,40 76,24 70,95
16 beats 75,78 28,33 86,36 75,78 70,15
32 beats 76,28 27,49 86,33 76,28 70,75
64 beats 75,74 27,94 86,40 75,74 69,98
Figure 7: Boxplot of the accuracies obtained within the
L1SO validation scheme for RAST-TERNARY.
Table 6 and Figure 9. In this case, the best accuracy
was 93,52 % obtained with a window of 4 heartbeats.
5.4 Discussion
One of the most noteworthy result from the experi-
ments depicted in the subsections 5.2 and 5.3 is that
for the L1SO-CV the best results are mostly spread
among the window lengths of 8 and 16 heartbeats (see
Tables 1 and 4) while for the 80-20 Random Split vali-
dation the best results obtained are obtained when in-
volving in RAST an observation window of only 4
heartbeats. This could be translated in an online sce-
nario of the detector in the following usage: when a
new patient has to be monitored, a longer observation
Table 5: The performances of RAST-TERNARY in terms
of the main classification metrics for the experiment with
80-20 random-split validation scheme among all the heart-
beat windows.
Window Acc Spec Prec Recall F1 Score
4 beats 92,76 80,44 92,77 92,76 92,44
6 beats 92,57 79,74 92,60 92,57 92,22
8 beats 92,45 79,43 92,47 92,45 92,09
10 beats 92,32 78,91 92,37 92,31 91,93
16 beats 92,06 78,04 92,11 92,06 91,63
32 beats 91,51 76,57 91,57 91,51 91,01
64 beats 90,61 73,66 90,73 90,61 89,97
Figure 8: Boxplot of the accuracies obtained within the 80-
20 random-split validation scheme for RAST-TERNARY.
Table 6: The performances of RAST-TERNARY in terms
of the main classification metrics for the experiment with
80-20 random-split validation scheme and SMOTE among
all the heartbeat windows.
Window Acc Spec Prec Recall F1 Score
4 beats 93,52 90,03 93,60 93,52 93,54
6 beats 93,38 89,77 93,46 93,38 93,40
8 beats 92,47 90,00 92,74 92,47 92,56
10 beats 93,29 89,47 93,35 93,29 93,30
16 beats 92,99 89,02 93,07 92,99 93,01
32 beats 92,60 88,16 92,67 92,61 92,62
64 beats 92,26 86,54 92,26 92,26 92,22
window is needed to best detect ST related anoma-
lies. On the other hand, when the data of a patient
is already available, RAST will need an observation
window of only 4 heartbeats.
In Figure 7 are highlighted the performances
of the best experiment in RAST (i.e., RAST-
TERNARY with a window of 4 heartbeats, with 80-20
random-split validation scheme and SMOTE) detailed
by class and expressed in percentage with respect to
the main classification metrics. The metrics are aver-
Figure 9: Boxplot of the accuracies obtained within the 80-
20 random-split validation scheme for RAST-TERNARY
with the application of the SMOTE technique.
A Robust Approach for a Real-time Accurate Screening of ST Segment Anomalies
77

Table 7: The performances of the best experiment in RAST,
i.e., RAST-TERNARY, detailed by class and expressed in
percentage with respect to the main classification metrics.
Class Acc Spec Prec Recall F1 Score
NSR 93,56 87,74 96,24 95,33 95,78
ST+ 98,38 98,75 85,37 93,61 89,30
ST- 95,09 97,06 84,71 84,84 84,77
Table 8: Comparison between RAST and the baseline work
(Harun-Ar-Rashid et al., 2020) in terms of overall accuracy.
Method Binary Ternary
RAST 93,61 93,52
(Harun-Ar-Rashid et al., 2020) 92,10 92,10
Delta +1,51 +1,42
aged among the 1000 iterations. We consider this ex-
periment as the best because the accuracy for RAST-
BINARY and RAST-TERNARY are not significantly
different for the same configuration of 4 heartbeats,
SMOTE and 80-20 scheme).
As shown in Figure 8, in terms of overall accuracy,
our tool outperforms the baseline method by approx-
imately 1,51 % and 1,4 % (respectively for RAST-
BINARY and RAST-TERNARY) providing higher
noise robustness, lower computational cost and higher
prediction responsiveness. All this makes it a robust
and highly accurate tool for both screening and detec-
tion of ST segment diseases.
To provide a complete report of the results, we
measured the times of processing for the generation
of the final features vector. With the longest window
considered, i.e., the 64 heartbeats window, we mea-
sured the generation of the final features vector in 0,09
s while with the smallest window, with only 4 heart-
beats, we measured the same processing in 0,012 s.
For this purpose, we used a laptop running Windows
10 with a Ryzen 7 5800x CPU and 32Gb of Ram.
These measures of time are to be intended only for the
features vector generation. To these amounts, the time
for the prediction needs to be added. In RAST, the
time for the prediction is not significant, considering
that the most fitting model (Random Forest) was as-
sessed in the literature as a classifier with a very small
computational cost at test time (Sol
´
e et al., 2014).
In addition, thanks to the large experimentation
conducted, it was possible to achieve another result.
Indeed, it was observed that for the L1SO-CV, a
longer observation window was needed. In contrast,
with a random split, the observation window is re-
duced to 4 beats to provide a highly accurate binary
or ternary prediction of ST abnormalities. This could
be because within the L1SO-CV the training model
does not have personal patient data on which to make
the ST segment prediction, while the 80-20 random-
split validation represents a scenario where subjective
data are always available for the training of the model.
Therefore, the outcome can be that if a patient has
never been assisted, the observation window to iden-
tify ST anomalies must last longer, while if the model
has had the chance to use personal data for the training
of the model, the observation can be reduced to only
4 successive heartbeats. This result is compliant with
another work in the literature (Rosa et al., 2021b).
6 THREATS TO VALIDITY
A limitation might be the fact that we worked on only
one dataset, when it would have been more useful to
test the tuning of all design parameters on one dataset
and validate it on a completely different dataset of
patients. Unfortunately, because of the way our ap-
proach is done, we could only work on European ST-
T Database. To mitigate this limitation, we opted to
introduce robust validation schemes.
7 CONCLUSIONS
In this work RAST was presented, a tool dedicated
to the screening of ST anomalies. With respect to
other state-of-the-art methods, RAST is focused on
the binary (ST and Normal) and ternary (ST+, ST-
and Normal) identification of ST segment anomalies.
Indeed, other tools opted for the identification of more
ST segment categories of anomaly. At the same time,
RAST is mostly focused on the triggering of the dan-
ger without providing too many details on its nature.
Therefore, RAST is more intended to be involved in
rapid and accurate screening applications where the
diagnosis is continued by a specialized medical staff.
This method was exhaustively experimented on
the European ST-T Database and showed many im-
provements: (i) a better overall accuracy (+2 % with
respect to the chosen baseline) for both versions of
RAST (ii) a more efficient computational cost con-
sidering that in the baseline work Maglaveras et al.
(1998) declared a high computational cost for their
presented method.
As a part of our future agenda, we aim at evalu-
ating the performances of RAST with different Deep
Learning-based classifiers. Moreover, we want to ex-
periment the approach on larger and heterogeneous
datasets, but also in clinical contexts via controlled
experiments. In these cases, it will be useful to eval-
uate the importance and the impact of demographics
factors, such as age and weight, as features.
HEALTHINF 2022 - 15th International Conference on Health Informatics
78

ACKNOWLEDGMENT
The authors have been supported by the project PON
2014-2020—ARS01 00860 “ATTICUS: Ambient-
intelligent Tele-monitoring and Telemetry for
Incepting and Catering over hUman Sustainability”
funded by the Ministry of Education, University and
Research—RNA/COR 576347.
REFERENCES
Balas, E. A., Austin, S. M., Mitchell, J. A., Ewigman, B. G.,
Bopp, K. D., and Brown, G. D. (1996). The clinical
value of computerized information services. a review
of 98 randomized clinical trials. Archives of Family
Medicine, 5(5):271–278.
Balestrieri, E., Boldi, F., Colavita, A. R., De Vito, L.,
Laudato, G., Oliveto, R., Picariello, F., Rivaldi, S.,
Scalabrino, S., Torchitti, P., et al. (2019). The ar-
chitecture of an innovative smart t-shirt based on the
internet of medical things paradigm. In 2019 IEEE
International Symposium on Medical Measurements
and Applications (MeMeA), pages 1–6. IEEE.
Berner, E. S. (2007). Clinical decision support systems,
volume 233. Springer.
Chawla, N. V., Bowyer, K. W., Hall, L. O., and Kegelmeyer,
W. P. (2002). Smote: synthetic minority over-
sampling technique. Journal of artificial intelligence
research, 16:321–357.
De Vito, L., Picariello, E., Picariello, F., Tudosa, I., Lo-
previte, L., Avicolli, D., Laudato, G., and Oliveto, R.
(2021). An undershirt for monitoring of multi-lead
ecg and respiration wave signals. In 2021 IEEE Inter-
national Workshop on Metrology for Industry 4.0 &
IoT (MetroInd4. 0&IoT), pages 550–555. IEEE.
Ghaemi, A., Rezaie-Balf, M., Adamowski, J., Kisi, O.,
and Quilty, J. (2019). On the applicability of max-
imum overlap discrete wavelet transform integrated
with mars and m5 model tree for monthly pan evap-
oration prediction. Agricultural and Forest Meteorol-
ogy, 278:107647.
Goldberger, A. L., Amaral, L. A., Glass, L., Hausdorff,
J. M., Ivanov, P. C., Mark, R. G., Mietus, J. E., Moody,
G. B., Peng, C.-K., and Stanley, H. E. (2000). Phys-
iobank, physiotoolkit, and physionet: components of
a new research resource for complex physiologic sig-
nals. circulation, 101(23):e215–e220.
Hadjem, M., Na
¨
ıt-Abdesselam, F., and Khokhar, A. (2016).
St-segment and t-wave anomalies prediction in an ecg
data using rusboost. In 2016 IEEE 18th Interna-
tional Conference on e-Health Networking, Applica-
tions and Services (Healthcom), pages 1–6. IEEE.
Harun-Ar-Rashid, M., Mahmud, G., Rahman, M. M., and
Hossain, A. D. (2020). Classification of st segment in
ecg signals based on cross correlated supervised data.
SN Applied Sciences, 2(7):1–18.
Huang, C., Ye, S., Chen, H., Li, D., He, F., and
Tu, Y. (2010). A novel method for detection of
the transition between atrial fibrillation and sinus
rhythm. IEEE Transactions on Biomedical Engineer-
ing, 58(4):1113–1119.
Jeong, G.-Y. and Yu, K.-H. (2006). Design of ambula-
tory ecg monitoring system to detect st pattern change.
In 2006 SICE-ICASE International Joint Conference,
pages 5873–5877. IEEE.
Kawamoto, K., Houlihan, C. A., Balas, E. A., and Lobach,
D. F. (2005). Information in practice. bmj, 330:765–
768.
Khan, M. A., Hashim, M. J., Mustafa, H., Baniyas, M. Y.,
Al Suwaidi, S. K. B. M., AlKatheeri, R., Alblooshi, F.
M. K., Almatrooshi, M. E. A. H., Alzaabi, M. E. H.,
Al Darmaki, R. S., et al. (2020). Global epidemiology
of ischemic heart disease: Results from the global bur-
den of disease study. Cureus, 12(7).
Lake, D. E. and Moorman, J. R. (2011). Accurate esti-
mation of entropy in very short physiological time
series: the problem of atrial fibrillation detection
in implanted ventricular devices. American Jour-
nal of Physiology-Heart and Circulatory Physiology,
300(1):H319–H325.
Laudato, G., Scalabrino, S., Colavita, A., Chiacchiari, Q.,
D’Orazio, R., Donadelli, R., De Vito, L., Picariello, F.,
Tudosa, I., Malatesta, R., Gallo, L., and R, O. (2021).
ATTICUS: Ambient-intelligent Tele-monitoring and
Telemetry for Incepting and Catering over hUman
Sustainability. Frontiers in Human Dynamics - Dig-
ital Impacts (Frontiers).
Leonarduzzi, R. F., Schlotthauer, G., and Torres, M. E.
(2010). Wavelet leader based multifractal analysis
of heart rate variability during myocardial ischaemia.
In 2010 Annual International Conference of the IEEE
Engineering in Medicine and Biology, pages 110–113.
IEEE.
Maglaveras, N., Stamkopoulos, T., Pappas, C., and
Strintzis, M. G. (1998). An adaptive backpropaga-
tion neural network for real-time ischemia episodes
detection: development and performance analysis us-
ing the european st-t database. IEEE Transactions on
Biomedical Engineering, 45(7):805–813.
Pan, J. and Tompkins, W. J. (1985). A real-time qrs de-
tection algorithm. IEEE transactions on biomedical
engineering, (3):230–236.
Rosa, G., Laudato, G., Colavita, A. R., Scalabrino, S., and
Oliveto, R. (2021a). Automatic real-time beat-to-beat
detection of arrhythmia conditions. In HEALTHINF,
pages 212–222.
Rosa, G., Russodivito, M., Laudato, G., Scalabrino, S.,
Colavita, A., and Oliveto, R. (2-4 October 2021b).
A multi-class approach for the automatic detection of
congestive heart failure in windowed ecg. In MED-
INFO ’21). Online Streaming.
Sintchenko, V., Coiera, E., Iredell, J. R., and Gilbert, G. L.
(2004). Comparative impact of guidelines, clinical
data, and decision support on prescribing decisions:
an interactive web experiment with simulated cases.
Journal of the American Medical Informatics Associ-
ation, 11(1):71–77.
Sol
´
e, X., Ramisa, A., and Torras, C. (2014). Evaluation of
random forests on large-scale classification problems
A Robust Approach for a Real-time Accurate Screening of ST Segment Anomalies
79

using a bag-of-visual-words representation. In Arti-
ficial Intelligence Research and Development, pages
273–276. IOS Press.
Sun, Y. and Thakor, N. (2015). Photoplethysmography
revisited: from contact to noncontact, from point to
imaging. IEEE transactions on biomedical engineer-
ing, 63(3):463–477.
Tateno, K. and Glass, L. (2000). A method for detection
of atrial fibrillation using rr intervals. In Computers
in Cardiology 2000. Vol. 27 (Cat. 00CH37163), pages
391–394. IEEE.
Wang, H., Zhao, W., Xu, Y., Hu, J., Yan, C., Jia, D.,
and You, T. (2018). St segment change classifica-
tion based on multiple feature extraction using ecg.
In 2018 Computing in Cardiology Conference (CinC),
volume 45, pages 1–4. IEEE.
Xiao, R., Xu, Y., Pelter, M. M., Mortara, D. W., and
Hu, X. (2018). A deep learning approach to exam-
ine ischemic st changes in ambulatory ecg recordings.
AMIA Summits on Translational Science Proceedings,
2018:256.
Zhao, Q. and Zhang, L. (2005). Ecg feature extraction
and classification using wavelet transform and support
vector machines. In 2005 International Conference on
Neural Networks and Brain, volume 2, pages 1089–
1092. IEEE.
HEALTHINF 2022 - 15th International Conference on Health Informatics
80
