
SieveNet: Estimating the Particle Size Distribution of Kernel Fragments
in Whole Plant Corn Silage
Christoffer Bøgelund Rasmussen
1 a
, Kristian Kirk
2
and Thomas B. Moeslund
1 b
1
Visual Analysis and Perception Lab, Aalborg University, Rendsburggade 14, 9000 Aalborg, Denmark
2
CLAAS E-Systems, Møllevej 11, 2990 Niv
˚
a, Denmark
Keywords:
Object Recognition, Convolutional Neural Networks, Region Proposal Network, Kernel Fragmentation,
Whole Plant Corn Silage.
Abstract:
In this paper we present a method for efficiently measuring the particle size distribution of whole plant corn
silage with a sieving-based network. Our network, SieveNet, learns to predict the size class of predefined
sieves for kernel fragments through a novel sieve-based anchor matching algorithm during training. SieveNet
improves inference timings by 40% compared to previous approaches that are based on two-stage recognition
networks. Additionally, an estimated Corn Silage Processing score from the network predictions show strong
correlations of up to 0.93 r
2
against physically sieved samples, improving correlation results by a number of
percentage points compared to previous approaches.
1 INTRODUCTION
Efficient evaluation of Whole Plant Corn Silage
(WPCS) is an important step to determine if the plant
is correctly harvested with a forage harvester. One
key parameter is the appropriate processing of kernels
into smaller fragments. The fragmentation of the corn
kernels allows for more efficient and higher quality
fodder for dairy cows (Mertens, 2005) and is achieved
by altering the processing gap in the kernel processor
in the harvester. By evaluating the kernel processing
a farmer is able to react in the field to suboptimal set-
tings or variation across their field. An efficient eval-
uation can be beneficial as modern forage harvester
are able to harvest multiple tonnes per hour (Marsh,
2013). However, current industry standards are based
upon determining the particle size distribution (PSD)
of a WPCS sample with manual sieving techniques
which require potentially errorsome manual prepara-
tion steps. Examples include the Corn Silage Pro-
cessing Score (CSPS) that measures the percentage of
kernel fragments passing a 4.75 mm sieve (Mertens,
2005) or the Penn State Particle Separator that deter-
mines the distribution over three to four differently
sized sieves (Heinrichs and Coleen, 2016).
a
https://orcid.org/0000-0002-8786-0737
b
https://orcid.org/0000-0001-7584-5209
Compared to previous similar works on evaluating
WPCS our approach is considerably simpler. Previ-
ous works have trained two-stage object recognition
networks in the form of bounding-box detectors or
instance segmentation networks for fine-grain locali-
sation (Rasmussen and Moeslund, 2019) (Rasmussen
et al., 2021). Then for a set of predictions over a num-
ber of images the length of the major axis was com-
pared against the CSPS quality metric. Instead in this
work we propose to discard the second stage in the
two-stage networks and only adopt an altered Region
Proposal Network (RPN). We introduce the network
SieveNet that aims to mimic the sieving process that
allow for measurements such as CSPS. The network
uses a novel anchor matching algorithm during train-
ing that allows the network to learn how to classify
which sieve size a kernel fragment instance would
lie in during sieving. Traditionally, anchors in the
RPN are used as dense bounding-box priors of vary-
ing sizes computed over the entire feature map pro-
ducing object proposals with class-agnostic object-
ness scores and box refinement deltas. This scheme
is altered in SieveNet by defining anchors based on a
number of sieving sizes and during training positive
anchors are matched using a set of criterion based on
sieving. The criterion are:
1. A matched bounding-box anchor should have a
diameter smaller than that of the ground truth di-
ameter.
Rasmussen, C., Kirk, K. and Moeslund, T.
SieveNet: Estimating the Particle Size Distribution of Kernel Fragments in Whole Plant Corn Silage.
DOI: 10.5220/0010821200003124
In Proceedings of the 17th International Joint Conference on Computer Vision, Imaging and Computer Graphics Theory and Applications (VISIGRAPP 2022) - Volume 5: VISAPP, pages
117-124
ISBN: 978-989-758-555-5; ISSN: 2184-4321
Copyright
c
2022 by SCITEPRESS – Science and Technology Publications, Lda. All rights reserved
117
2. The matched bounding-box anchor should be the
that which has the smallest difference between the
anchor diameter and ground truth diameter.
3. Only a single anchor sieve size can be matched to
a ground truth instance.
We adopt the same dataset as the two-stage recog-
nition networks (Rasmussen and Moeslund, 2019)
(Rasmussen et al., 2021) which exhibits a high
amount of clutter amongst kernel fragments. An ex-
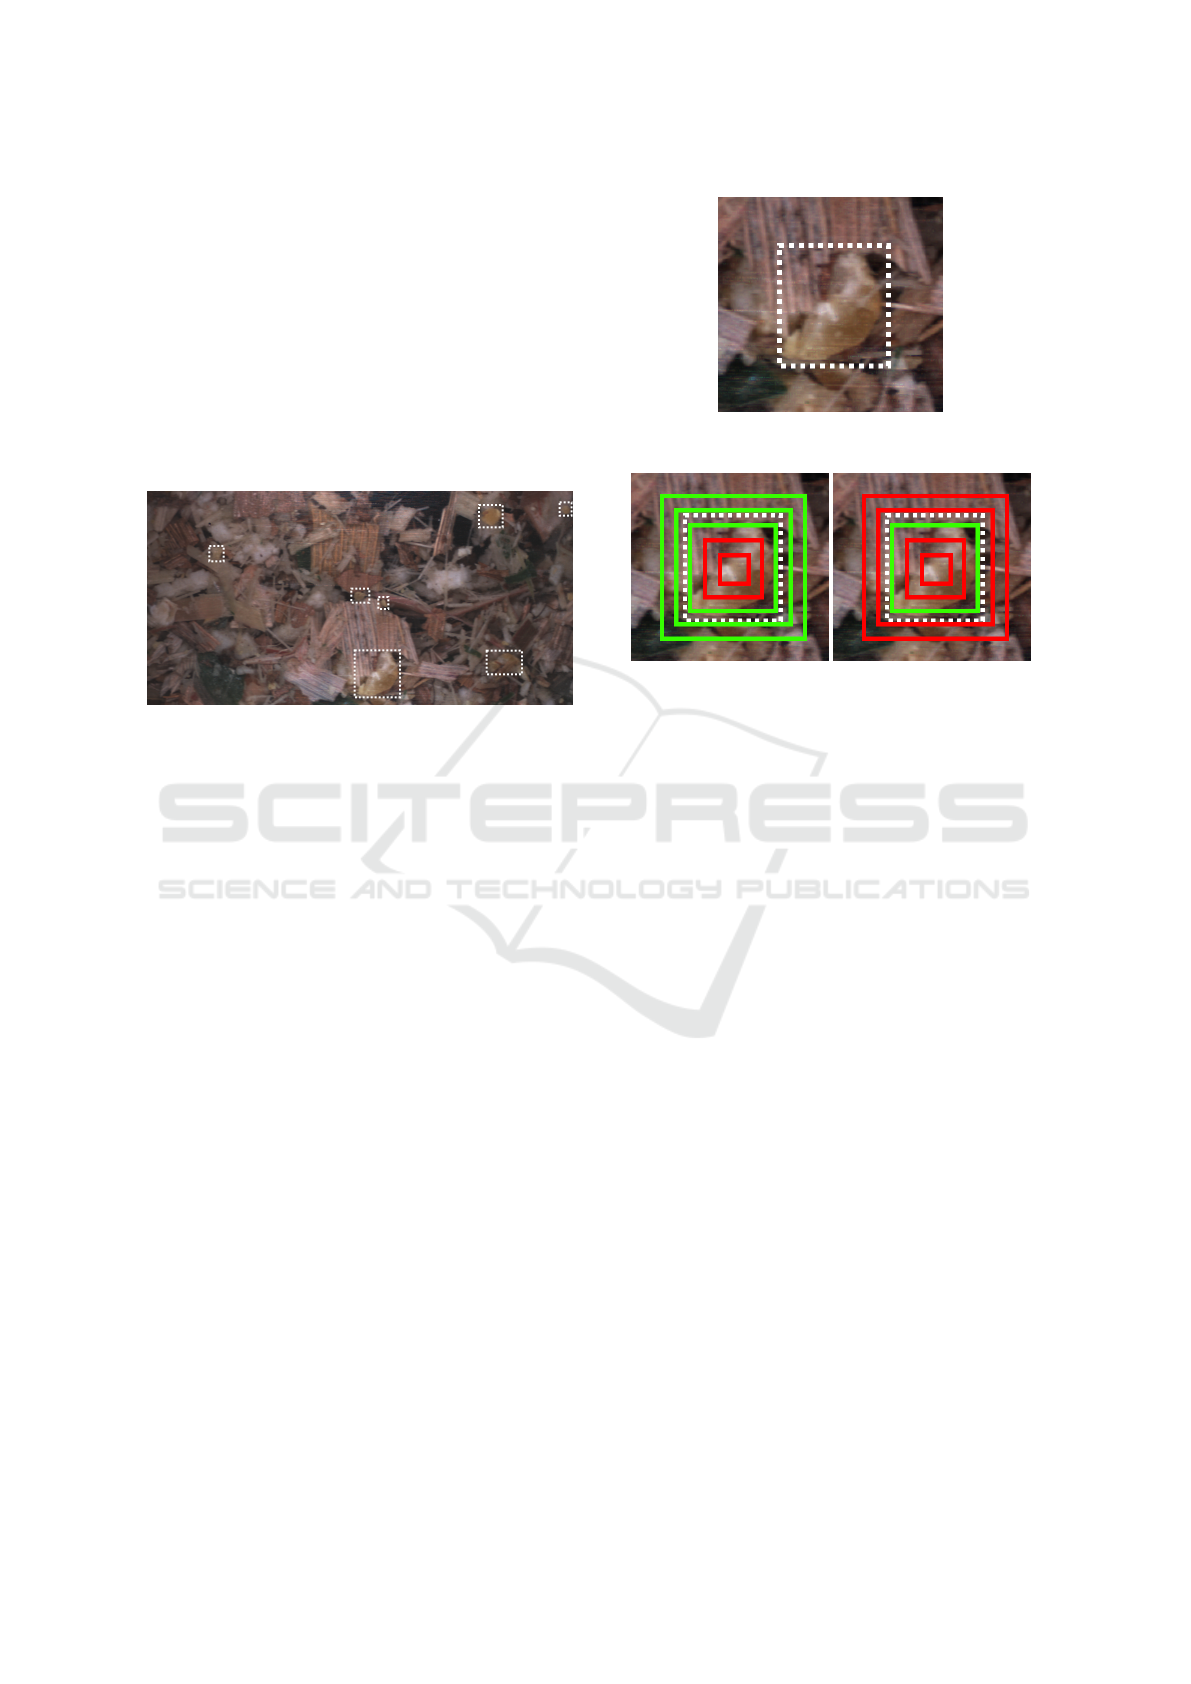
ample image from the dataset can be seen in Figure
1 visualising annotated kernel fragments by a white
outline.
Figure 1: Example of WPCS with annotations of kernel
fragments.
The above sieving criteria implemented on the
dataset are visualised for a single instance in Figure
2 highlighting the difference between traditional RPN
matching (Ren et al., 2015) and our novel sieve-based
matcher. In both examples a ground truth kernel frag-
ment bounding-box is highlighted by a dashed white
outline. In Figure 2b, during training a positive la-
bel is given to the anchors with an Intersection-over-
Union (IoU) greater than 0.7, which in this case are
marked in green. However, in our approach in Figure
2c two positive examples are now marked as negatives
are their diameter is greater than that of the ground
truth. Additionally, only a single positive match is
found which is the first anchor with a smaller diame-
ter. The only requirement we introduce on intersec-
tion is that it must be greater than 0, therefore, in
theory as long as the three criteria above are met the
intersection between anchor and ground truth can be
small.
In comparison to an RPN the SieveNet is simpli-
fied in regards to network training as bounding-box
regression is not required as we are only interested
in the classification of instances into a fixed sieve
class. We show in this work that it is possible to
train our SieveNet to accurately and efficiently esti-
mate the sieving of WPCS. Finally, compared to pre-
vious works we show competitive results in compari-
son to physically sieved samples at a considerable re-
duction in inference time.
(a) Reference bounding-box
annotation.
(b) Traditional RPN-based
anchor matching.
(c) SieveNet-based anchor
matching.
Figure 2: Overview of matching strategies between RPN
IoU (a) and SieveNet (b).
Our contribution in this work is:
• A novel sieve-based matching algorithm.
• Show that a Region Proposal Network is able to
learn to classify a specific bounding-box anchor.
• Improve the speed of kernel fragmentation analy-
sis in WPCS compared to previous methods with-
out compromising CSPS estimation against real-
world samples.
2 RELATED WORK
Measurement of WPCS through computer vision is
limited. Overall there have been two general method-
ologies; methods that first separate a sample of WPCS
such that kernel fragments can easier be localised and
methods that analyse images of samples without the
need for separation. Within the separation-based ap-
proaches, the contours of kernel fragments spread out
on a black background were found using maximally
stable external regions from which the maximum
inscribed circle was compared to determine CSPS
(Drewry et al., 2019). However, the manual separa-
tion steps can be cumbersome to conduct especially
for a farmer in the field. Additionally, laboratory
equipment is required which can make the process
time-consuming and does not allow the farmer to re-
VISAPP 2022 - 17th International Conference on Computer Vision Theory and Applications
118

act to their field conditions during the harvest. To ad-
dress this a number of works have estimated CSPS on
non-separated samples of WPCS. Firstly, two-stage
object recognition networks in the form of Multi-task
Network Cascades and Region-based Fully Convolu-
tional Networks were trained from which CSPS was
estimated from instance masks or bounding-boxes
and compared against CSPS estimated from anno-
tations (Rasmussen and Moeslund, 2019). A two-
stage Faster R-CNN network was optimised by al-
tering the anchor priors in the RPN by sampling the
shapes of training bounding-boxes with k-means clus-
tering (Rasmussen et al., 2021). This work also
compared model estimated CSPS from the bounding-
boxes against a number of physically sieved samples
showing a strong correlation over a number of dif-
ferent machine settings. While the works on non-
separated samples show good correlation results the
networks exhibit a higher range of complexity making
them not suitable for an embedded system where pro-
cessing power is limited. Additionally, the two-stage
pipeline of region proposals followed by box refine-
ment may be superfluous as the final predictions end
up being compared against a single CSPS threshold.
In other domains a number of works attempt to
measure the size distribution of objects. These in-
clude determining the PSD of overlapping iron ore
using hand-crafted shape and size features (Anders-
son et al., 2007). A U-Net based semantic segmen-
tation network has also been used to localise iron ore
pellets (Duan et al., 2020). The grain size of beach
pebbles were estimated using a Mask R-CNN show-
ing positive correlation when mapping the size results
against measured samples (Soloy et al., 2020). A
novel multi-task network architecture, HistoNet, has
been used to predict a count map and a histogram
without the need for fine-grain localisation of objects
in cluttered scenes (Sharma et al., 2020). This work
aims to move away from the complex pipeline found
in object recognition networks and show impressive
results compared to a Mask R-CNN. A significant
amount of the training data is simulated which is pos-
sible due to the lower amount of variation in colour
and texture in the images.
Other examples exist in literature of the RPN be-
ing utilised to localise objects without using the sec-
ond half of the two-stage pipeline. Firstly, the gener-
alisation of the RPN has been analysed on a number of
benchmark datasets for multispectral person detection
showing that the network could produce good quality
predictions (Fritz et al., 2019). An RPN with a cus-
tom backbone architecture has been used to localise
organs in 3D images from CT scans (Xu et al., 2019).
The authors also included multi-class scores and to-
gether with box refinement and fusion of 3D feature
data provided accurate results.
3 METHODOLOGY
SieveNet is built upon the RPN introduced in Faster
R-CNN (Ren et al., 2015) with a ResNet50 (He et al.,
2016) backbone within the Pytorch Detectron2 (Wu
et al., 2019) framework. The aim of SieveNet is to
efficiently determine the PSD within an RGB image
given user-defined priors giving sieve sizes. Addi-
tionally, the network follows the supervised-learning
mantra and therefore requires annotated instances of
relevant objects in bounding-box format. The novel
matching algorithm between anchors and ground
truth boxes moves away from a purely Intersection-
over-Union (IoU) criteria but rather matches based
upon how an instance would be sieved. For exam-
ple, a kernel fragment with a diameter of x would
pass sieves which have a diameter greater than x but
not those which are smaller. Therefore, our match-
ing algorithm finds for each ground truth instance the
anchor diameter that matches the sieving criterion de-
fined earlier.
3.1 Dataset
We adopt the dataset for training SieveNet first pre-
sented in the works for performing object recogni-
tion for kernel fragmentation with two-stage networks
(Rasmussen and Moeslund, 2019). The dataset con-
tains a total of 2438 images containing 11601 anno-
tated kernel fragments split over a training, validation
and test sets.
3.2 Anchor Matching
The matching of anchors as positive or negative sam-
ples during training in the traditional RPN is based
upon an IoU approach between the anchor and ground
truth boxes at each sliding window location. If a given
anchor has an IoU above a certain threshold with a
ground truth box the anchor is labelled as a poten-
tial positive sample, anchors with an IoU below an-
other threshold are labelled as negatives and finally
the anchor boxes with an IoU between the two thresh-
old are given an ignore label. Typical threshold val-
ues defined in the original introduction of the RPN in
Faster R-CNN (Ren et al., 2015) are 0.7 for positives
and 0.3 for negatives, however, these can be altered
to a given use-case. Finally, a distribution of posi-
tive and negative boxes are sampled for each image
SieveNet: Estimating the Particle Size Distribution of Kernel Fragments in Whole Plant Corn Silage
119

during training with the network learning the class-
agnostic probability between object and background.
As mentioned, this matching strategy is not sufficient
for efficiently estimating PSD given a sieving criteria
as positive matches can include boxes where either
the anchor or ground truth has the larger diameter.
Additionally, depending on the chosen anchor prior
multiple anchors can be labelled as positives as long
as each IoU is greater than the chosen threshold.
Our approach to anchor matching is first to define
anchor shapes that match a potential sieving system
which could be used to estimate CSPS. A total of five
anchor sieves are chosen ranging from 1 mm to 9 mm
in increments of 2 mm. Due to the constant distance
between camera and samples when capturing images
in the dataset this equates to pixel ranges between 20
and 180 at increments of 20. An overview of the sieve
matching is covered in Algorithm 1. First, for a set of
ground truth boxes the IoU is calculated with the an-
chors at each position in the feature map. Next, for all
ground truth boxes and anchor boxes the diameters of
each box is determined, for ground truth boxes the di-
ameter is taken is the larger of the two axes. Then for
each coordinate in the feature map with an IoU greater
than zero the five anchor diameters are compared to
the given ground truth diameter and the anchor diame-
ters that are smaller are given a positive label. Anchor
diameters that are greater represent sieves where the
instance would pass are given a negative label. Once
completed for all ground truth boxes, at each coordi-
nate with multiple positives the positive anchors that
do not have the smallest diameter and are set to neg-
atives. At this point at each coordinate with an ini-
tial IoU greater than zero the correct sieve-based an-
chor is now matched. Finally, Non-Maximum Sup-
pression (NMS) is applied for positive anchor labels
at a threshold of 0.9 where anchors that overlap great-
est with the ground truth are prioritised for training
samples.
The number of positive samples is significantly
different when adopting the matching approach com-
pared to the IoU matching. In our networks we do not
take into account an IoU threshold and allow matches
do be set as long as the IoU is greater than zero.
This approach mimics sieving better as a correctly
sieved object may be considerably larger than the
sieve/anchor resulting in a poor IoU. An alternative
to our matching method is to adopt the Intersection-
over-Area (IoA) metric in the RPN matching step.
In IoA the overlap is defined as the area of the in-
tersection over the area of the anchor box. A po-
tentially more relevant metric is our sieve matching
only uses cases where the anchor is the smaller of the
two boxes. Table 1 shows the difference in the num-
Algorithm 1: Anchor matching algorithm for SieveNet.
1: function SIEVEMATCHER(gtboxes, anchors)
2: Calculate IoU(gtboxes, anchors)
3: Calculate diameters of GT boxes
4: Calculate diameters of anchor boxes
5: for each coordinate with IoU > 0 do
6: if Anchor diameter < GT diameter then
7: anchor label = 0
8: else
9: anchor label = 1
10: end if
11: end for
12: for Coordinates with multiple label == 1 do
13: Find smallest anchor diameter label == 1
14: Anchor labels where not smallest = 0
15: end for
16: NMS at threshold 0.9 for positive anchors
return Anchor labels
17: end function
ber of positive samples for the images in the training
set before applying NMS to find the highest quality
matches. A considerably larger amount of positive
examples exist when using the IoA metric compared
to IoU in the RPN matching equating to on average
around 88 samples compared to 10. This is likely
due to smaller anchors encapsulated by a ground truth
scoring 1.0 instead of a potentially much lower score
with IoU. Finally, our approach finds 2.75× more
positives than the IoU approach despite only allow-
ing a single anchor match at each location, however,
we do match positives independent of any intersection
based metric.
Table 1: Number of positive samples for the different
matching methods for all images in the training set.
Matcher Positive Samples
RPN IoU 14026
RPN IoA 122966
SieveNet 38652
Finally, we perform our sieve matching at a stride
of 1 in the feature map. Other options exist, however,
care should be taken dependent on the chosen back-
bone architecture. In our case, with ResNet50, the
backbone down samples the input image throughout
the network by a number of pooling and striding op-
erations resulting in a feature map four times smaller.
Therefore, when applying anchor matching at a stride
of 1 this equates to a stride of 8 pixels in the input. For
SieveNet with ResNet50 this difference is negligible
but with a different architecture or changing the stride
in the feature map may result in lower effectiveness in
the matching step.
VISAPP 2022 - 17th International Conference on Computer Vision Theory and Applications
120
During inference the anchor matching step is nat-
urally not included. Instead, the SieveNet uses a slid-
ing window at the stride of 1 over the feature map and
predict the probability of each anchor matching with
a kernel fragment. Then predictions are thresholded
based upon a confidence score and NMS thresholds
predictions at an IoU of 0.05 leaving the final sieved
predictions.
3.3 Model Training
The SieveNet with the anchor matching strategy pre-
sented in the previous section are trained for a total
of 25000 iterations using stochastic gradient descent
with a base learning rate of 0.025 and a batch size of
four. Images are rescaled such that the shortest axis
is 600 pixels and horizontal flipping augmentation is
applied to double the amount of images. The train-
ing and inference of the models used for the results
presented in the next section are done on an NVIDIA
Titan XP GPU. During evaluation of the networks we
take the given network iteration with the lowest vali-
dation loss.
4 RESULTS
In this section we present results from SieveNet mod-
els. This includes studies comparing both within
model SieveNet variants are against an RPN with the
classic matching algorithm. To make the results com-
parable between SieveNet and the RPNs we also re-
move bounding-box refinement from the RPNs. We
present correlation results for models based upon the
dataset of physically sieved samples for CSPS from
two harvest weeks presented in (Rasmussen et al.,
2021) and compare against the Faster R-CNN mod-
els from the same work. The data for the samples
includes image sets and CSPS scores for a number of
harvest runs containing machine setting altering the
kernel fragmentation. For an image set we run our
models over all images and estimate the CSPS by
determining the percentage of predictions that pass
the 5 mm anchor. When evaluating the models we
present results with the Pearson Correlation Coeffi-
cient (PCC), r
2
coefficient of determination and the
Root Mean Square Error (RMSE) comparing esti-
mated model CSPS and physically sieved CSPS.
4.1 Matching Strategy
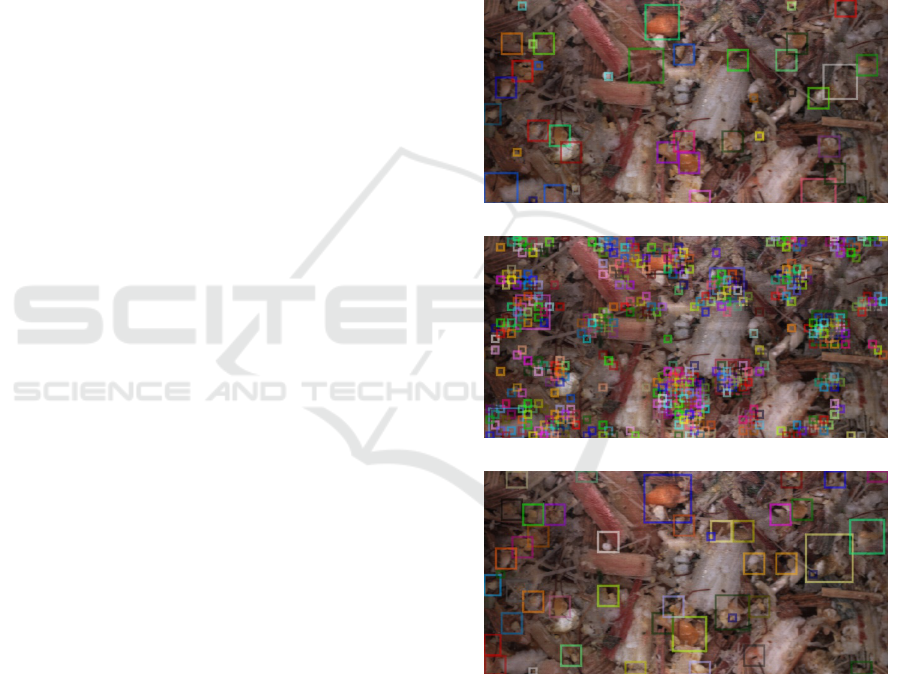
In Figures 3a and 3b example predictions from the
same image are shown for RPN trained with the IoU
and IoA respectively, where in Figures 3c predic-
tions for SieveNet are shown. The example predic-
tions in Figure 3b show the limitations of using an
IoA based approach with RPN original matching ap-
proach. Here, any anchors that are within the bounds
of a ground truth measure as 1.0 resulting in many
small anchors being matched per ground truth. Ad-
ditionally, as no bounding-box refinement is learnt
NMS cannot be used to discard multiple anchors cov-
ering the same instance. Both RPN with the IoU met-
ric and SieveNet show visually promising results ap-
pearing to match anchor boxes well with kernel frag-
ment instances.
(a) RPN IoU.
(b) RPN IoA.
(c) SieveNet
Figure 3: Example predictions from models trained on dif-
ferent matching strategies.
Table 2 shows correlation results at three different
confidence thresholds for each of the matching meth-
ods. Each approach show strong correlation scores,
the RPN methods adopting an IoU threshold shows
similar results in terms of PCC and r
2
compared to
previous Faster R-CNN approaches. However, corre-
lation scores decrease when adopting IoA especially
SieveNet: Estimating the Particle Size Distribution of Kernel Fragments in Whole Plant Corn Silage
121

Table 2: Correlation results for previous works with Faster R-CNN (FRCNN) and our three networks with different matching
strategies for two separate harvest weeks.
CW40 CW43
Model PCC r
2
RMSE PCC r
2
RMSE
FRCNN Baseline (Rasmussen et al., 2021) 0.68 0.46 8.12 0.64 0.41 17.09
FRCNN 2a (conf: 0.5) (Rasmussen et al., 2021) 0.84 0.70 5.39 0.63 0.40 8.89
FRCNN 2a (conf 0.25) (Rasmussen et al., 2021) 0.90 0.80 8.90 0.66 0.44 7.64
FRCNN 2a (conf 0.05) (Rasmussen et al., 2021) 0.91 0.84 18.87 0.77 0.59 16.23
RPN IoU (conf 0.5) 0.88 0.78 18.93 0.69 0.49 14.70
RPN IoU (conf 0.25) 0.89 0.79 19.90 0.74 0.54 16.09
RPN IoU (conf 0.05) 0.89 0.79 21.49 0.75 0.56 17.78
RPN IoA (conf 0.5) 0.82 0.67 31.38 0.47 0.22 27.80
RPN IoA (conf 0.25) 0.81 0.65 31.35 0.41 0.17 27.81
RPN IoA (conf 0.05) 0.80 0.64 31.34 0.38 0.15 27.73
SieveNet (conf 0.5) 0.96 0.93 10.12 0.74 0.54 7.50
SieveNet (conf 0.25) 0.95 0.90 14.27 0.81 0.66 10.70
SieveNet (conf 0.05) 0.85 0.73 31.11 0.44 0.19 27.42
for the CW43 dataset. SieveNet improves the results
for both harvest weeks increasing both PCC and r
2
by a number of percentage points. For each of the
approaches it can also be seen that the confidence
threshold has an effect on CSPS correlation. For
SieveNet there appears to be a good trade-off at con-
fidence 0.25 show strong results for both weeks.
When evaluating the correlation results for both
harvest weeks together SieveNet does show a slight
decrease compared to Faster R-CNN as shown in Ta-
ble 3.
Table 3: Correlation results for previous works with Faster
R-CNN (FRCNN) and our three networks for a combined
correlation over both harvest weeks.
CW40+
CW43
Model PCC r
2
RMSE
FRCNN Baseline
(Rasmussen et al., 2021)
0.53 0.28 14.2
FRCNN 2a (conf: 0.5)
(Rasmussen et al., 2021)
0.64 0.40 7.69
FRCNN 2a (conf: 0.25)
(Rasmussen et al., 2021)
0.71 0.51 8.17
FRCNN 2a (conf: 0.05)
(Rasmussen et al., 2021)
0.81 0.66 17.34
RPN IoU (conf: 0.5) 0.70 0.49 16.50
RPN IoU (conf: 0.25) 0.75 0.56 17.71
RPN IoU (conf: 0.05) 0.76 0.58 19.35
RPN IoA (conf: 0.5) 0.43 0.19 29.29
RPN IoA (conf: 0.25) 0.43 0.18 29.28
RPN IoA (conf: 0.05) 0.30 0.09 29.23
SieveNet (conf: 0.5) 0.75 0.56 8.65
SieveNet (conf: 0.25) 0.80 0.64 12.27
SieveNet (conf: 0.05) 0.48 0.23 27.23
Figure 4 shows a scatter plot of physical CSPS
measured for each sample compared to estimated
model CSPS for the image sets from CW40 and
CW43 which are also shown in Table 2. We see
the positive correlation for all three approaches, es-
pecially strong at the values from SieveNet with well
aligned points.
Finally, we see that in Table 4 that SieveNet im-
proves the inference time by almost 40% compared
to Faster R-CNN when evaluating an inference image
on an NVIDIA Titan XP GPU.
Table 4: Timings for networks on an NVIDIA Titan XP
GPU.
Model Inference Time (ms)
FRCNN 2a
(Rasmussen et al., 2021)
51.1
SieveNet 34.1
4.2 Number of Anchors
For WPCS estimating the physical characteristics of
the harvested crop our aim can be to predict the CSPS
of a sample. For CSPS only the single sieve of 4.75
mm is required but in practice is typically done with
multiple different sizes. In this section we evaluate
training a SieveNet with two anchors, one for a 4.75
mm sieve and a smaller anchor at 1 mm capturing par-
ticles that pass the CSPS threshold anchor.
Figure 5 shows an example prediction from
SieveNet with either two or five anchors. At the for-
mer in Figure 5a the restriction of not adopting box
refinement allowing for further NMS is clear. Smaller
fragments passing the larger 4.75 mm sieve that are
more than double the size of the smallest anchor have
VISAPP 2022 - 17th International Conference on Computer Vision Theory and Applications
122
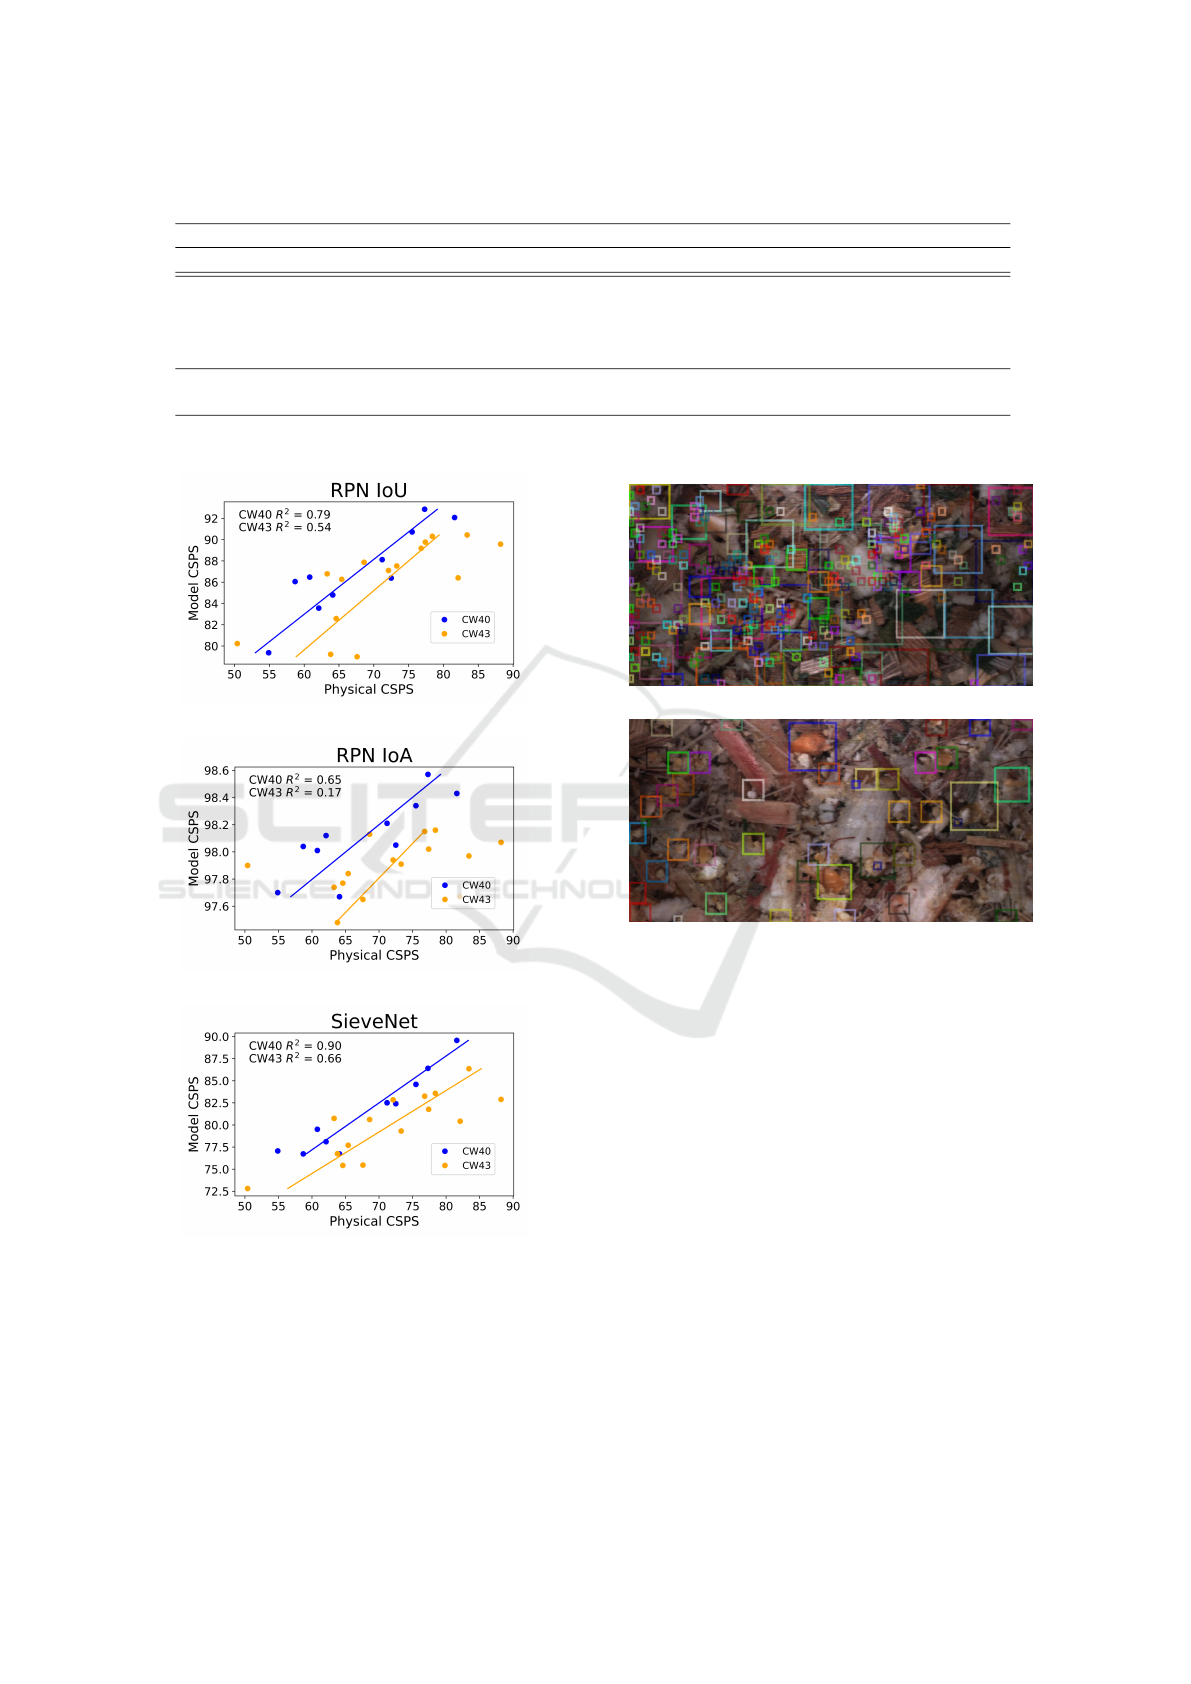
Table 5: Correlation for the two harvest weeks with previous results and additionally SieveNet with two anchors.
CW40 CW43
Model PCC r
2
RMSE PCC r
2
RMSE
FRCNN Baseline (Rasmussen et al., 2021) 0.68 0.46 8.12 0.64 0.41 17.09
FRCNN 2a (conf: 0.5) (Rasmussen et al., 2021) 0.84 0.70 5.39 0.63 0.40 8.89
FRCNN 2a (conf 0.25) (Rasmussen et al., 2021) 0.90 0.80 8.90 0.66 0.44 7.64
FRCNN 2a (conf 0.05) (Rasmussen et al., 2021) 0.91 0.84 18.87 0.77 0.59 16.23
RPN IoU (conf 0.25) 0.89 0.79 19.90 0.74 0.54 16.09
RPN IoA (conf 0.25) 0.81 0.65 31.35 0.41 0.17 27.81
SieveNet (conf 0.25) 0.95 0.90 14.27 0.81 0.66 10.70
SieveNet two anchors (conf 0.25) 0.38 0.15 29.42 -0.17 0.3 23.32
(a)
(b)
(c)
Figure 4: Correlation plots for the three matching strategies.
multiple predictions, similar that in when using the
IoA metric in the RPN. This effect is counteracted
when training with more anchor sieves with a con-
sistent increment in diameter as instances are never
100% greater than an associated sieve.
(a)
(b)
Figure 5: Two anchors for sieve sizes 1 mm and 4.75 mm.
Five anchors for size sizes between 1 mm and 9 mm with 2
mm increments.
In Table 5 the correlation results together with
previously presented models are shown for SieveNet
with two anchors. The results highlight what was vi-
sualised in the image with poor correlation, especially
at CW43.
5 CONCLUSION
In this work we present SieveNet, a network able
to efficiently monitor WPCS in RGB images cap-
tured directly from a forage harvester. We show that
localisation of kernel fragments is viable only with
an RPN-based architecture reducing the complexity
compared to previous approaches based on two-stage
recognition networks. Additionally, we introduce an
anchor matching algorithm giving the ability to train
SieveNet: Estimating the Particle Size Distribution of Kernel Fragments in Whole Plant Corn Silage
123

networks to classify kernel fragments into predefined
sieve sizes. These predictions allow for estimation of
CSPS with a strong correlation against physical sam-
ples. We believe SieveNet can be extended to other
domains where the PSD is also of interest, such as ag-
glomerates or medical imaging, given a definition of
appropriate sieved-based anchors.
REFERENCES
Andersson, T., Thurley, M. J., and Marklund, O. (2007).
Visibility classification of pellets in piles for sizing
without overlapped particle error. In 9th Biennial Con-
ference of the Australian Pattern Recognition Society
on Digital Image Computing Techniques and Applica-
tions (DICTA 2007), pages 508–514.
Drewry, J. L., Luck, B. D., Willett, R. M., Rocha, E. M., and
Harmon, J. D. (2019). Predicting kernel processing
score of harvested and processed corn silage via image
processing techniques. Computers and Electronics in
Agriculture, 160:144 – 152.
Duan, J., Liu, X., Wu, X., and Mao, C. (2020). Detection
and segmentation of iron ore green pellets in images
using lightweight u-net deep learning network. vol-
ume 32, pages 5775 – 5790.
Fritz, K., Koenig, D., Klauck, U., and Teutsch, M. (2019).
Generalization ability of region proposal networks
for multispectral person detection. Automatic Target
Recognition XXIX.
He, K., Zhang, X., Ren, S., and Sun, J. (2016). Deep resid-
ual learning for image recognition. In 2016 IEEE Con-
ference on Computer Vision and Pattern Recognition,
CVPR 2016, Las Vegas, NV, USA, June 27-30, 2016,
pages 770–778. IEEE Computer Society.
Heinrichs, J. and Coleen, M. J. (2016). Penn state particle
separator.
Marsh, B. H. (2013). A comparison of fuel usage and
harvest capacity in self-propelled forage harvesters.
International Journal of Agricultural and Biosystems
Engineering, 7(7):649 – 654.
Mertens, D. (2005). Particle size, fragmentation index, and
effective fiber: Tools for evaluating the physical at-
tributes of corn silages. In: Proceedings of the Four-
State Dairy Nutrition and Management Conference.
Rasmussen, C. B., Kirk, K., and Moeslund, T. B. (2021).
Anchor tuning in faster r-cnn for measuring corn
silage physical characteristics. Computers and Elec-
tronics in Agriculture, 188:106344.
Rasmussen, C. B. and Moeslund, T. B. (2019). Maize silage
kernel fragment estimation using deep learning-based
object recognition in non-separated kernel/stover rgb
images. Sensors, 19:3506.
Ren, S., He, K., Girshick, R., and Sun, J. (2015). Faster
r-cnn: Towards real-time object detection with region
proposal networks. In Proceedings of the 28th Inter-
national Conference on Neural Information Process-
ing Systems - Volume 1, NIPS’15, page 91–99, Cam-
bridge, MA, USA. MIT Press.
Sharma, K., Gold, M., Zurbruegg, C., Leal-Taixe, L., and
Wegner, J. D. (2020). Histonet: Predicting size
histograms of object instances. In Proceedings of
the IEEE/CVF Winter Conference on Applications of
Computer Vision (WACV).
Soloy, A., Turki, I., Fournier, M., Costa, S., Peuziat, B.,
and Lecoq, N. (2020). A deep learning-based method
for quantifying and mapping the grain size on pebble
beaches. Remote Sensing, 12(21).
Wu, Y., Kirillov, A., Massa, F., Lo, W.-Y., and Gir-
shick, R. (2019). Detectron2. https://github.com/
facebookresearch/detectron2.
Xu, X., Zhou, F., Liu, B., Fu, D., and Bai, X. (2019). Effi-
cient multiple organ localization in ct image using 3d
region proposal network. IEEE Transactions on Med-
ical Imaging, 38(8):1885–1898.
VISAPP 2022 - 17th International Conference on Computer Vision Theory and Applications
124
