
How Health Information Spreads in Twitter: The Whos and Whats of
Philippine TB-data
Erika Y. Chan, Myles Russel C. Chan, Shyrene Julianne S. Ching, Stanley Lawrence Sie,
Angelyn R. Lao, Jan Michael Alexandre C. Bernadas and Charibeth K. Cheng
De La Salle University, Manila, Philippines
Keywords:
Twitter, Health Information, Social Network Analysis, Sentiment Identification, Topic Modeling.
Abstract:
Twitter is a popular platform for disseminating health information. Unfortunately, there is no clear way to
monitor how information reaches the intended audiences. This research examined how health information
spreads on Twitter and identified factors that affect the spreading within the Philippines. We created a process
whose goal is to generate results that experts can deeply analyze to reveal insights into information spread.
The process consists of crawling Twitter data, transforming the data and applying sentiment identification and
topic modeling, and performing Social Network Analysis (SNA). The SNA graphs allow for the study of the
interactions between Twitter users and tweets while giving insights on influential users and topics discussed
across clusters. The study explored and utilized tuberculosis-related tweets. Though the algorithms were
meant to process tweets written in Filipino, the process is mostly language-agnostic and can be applied to
Twitter data. The results also help in identifying strategies that can improve health information spread on
Twitter in the Philippines.
1 INTRODUCTION
1.1 Background of the Study
Social networking sites (SNS) have emerged as pri-
mary forms of communication within the online com-
munity, with around 46.03% of the world popula-
tion using SNS
1
. Furthermore, they have also become
the main sources of information online, with almost
64.5% of Internet users receiving breaking news from
online platforms, such as Facebook, Twitter, and In-
stagram, instead of traditional media. Due to their
wide use, other domains have also taken advantage of
the spread of information found within these sites as
mediums to promote and provide awareness
2
.
One such domain is that of the medical field as
SNS have become popular avenues for publicly shar-
ing information. In fact, Twitter has been called
the most popular healthcare communication platform
(Pershad et al., 2018). Furthermore, many studies
have been conducted to better understand the behav-
ior of information spread within Twitter and its effects
1
https://ourworldindata.org/rise-of-social-media
2
https://conductscience.com/the-impact-of-social-
media-on-knowledge-dissemination/
on users (Kudchadkar and Carroll, 2020; Liang et al.,
2019; Tambuscio et al., 2015).
We found an opportunity for a localized study that
focuses on the behavior of information spread in the
Philippine context. We focused on health informa-
tion revolving around tuberculosis (TB), since TB has
been characterized as a global health threat
34
, with
around 9 million people acquiring TB in 2017
5
. It is
also more prevalent in the global South and the Philip-
pines
56
, which has been classified as high in both TB
and drug-resistant TB
6
. Moreover, in 2017, around
581,000 were diagnosed with and 27,000 died of TB
5
in the Philippines. One of the methods to effective
prevention and management of TB is relevant infor-
mation (Wieland et al., 2013; Brashers et al., 2004).
Communicating social support to patients is also im-
portant for continuing medication and treatment suc-
cess (Skiles et al., 2018). Thus, this study would also
like to explore how health information regarding tu-
berculosis is spread on Twitter and determine factors
that may be used to better disseminate pertinent and
3
https://www.tballiance.org/why-new-tb-drugs/global-
pandemic
4
https://www.who.int/news-room/fact-sheets/detail/
tuberculosis
5
https://www.who.int/tb/publications/global\ report/en/
Chan, E., Chan, M., Ching, S., Sie, S., Lao, A., Bernadas, J. and Cheng, C.
How Health Information Spreads in Twitter: The Whos and Whats of Philippine TB-data.
DOI: 10.5220/0010818000003123
In Proceedings of the 15th International Joint Conference on Biomedical Engineering Systems and Technologies (BIOSTEC 2022) - Volume 5: HEALTHINF, pages 421-429
ISBN: 978-989-758-552-4; ISSN: 2184-4305
Copyright
c
2022 by SCITEPRESS – Science and Technology Publications, Lda. All rights reserved
421

important information regarding tuberculosis.
There is a significant amount of Filipinos using
social networking platforms as a way of getting news
and information (Chua, 2020). However, there is also
a lack of dissemination of reliable health information
(Sbaffi and Rowley, 2017). While there are alterna-
tives in disseminating information in traditional me-
dia, such as televisions and radios, these are proven
ineffective because fewer and fewer people are utiliz-
ing them (Chua, 2020).
The following are the contributions of this re-
search:
• Identified factors information spread will allow
Philippine health organizations to take advantage
of the popularity of Twitter to spread important
and relevant information, with an emphasis on
lesser known diseases or programs that do not re-
ceive the necessary attention, effectively and ef-
ficiently so that the information reaches a wider
audience.
• The formulated process in tracing health informa-
tion spread is reproducible in other contexts with
most of the modules being language agnostic.
2 RELATED WORKS
2.1 Social Network Analysis
Social network analysis is consistently used to learn
how information spreads in social networks by char-
acterizing network structures to find unique patterns
on how information spreads and determine the po-
tential factors that may affect the spread. A previ-
ous study by (Himelboim et al., 2017) has shown that
social network analysis can also be used to classify
topic-networks on Twitter by using features such as
mentions, retweets, and replies. Twitter networks are
also directed and have edges flowing towards a certain
direction. In social network analysis, these networks
are usually represented as graphs, with different met-
rics applied to measure the spread of information in
the network. One of the most commonly used metrics
is centrality.
Centrality aims to measure the influence of a spe-
cific node in a network and is commonly used to iden-
tify the source of a spread (Grandjean, 2016). In its
application to the analysis of information spread in
SNS, the out-degree centrality can be used to mea-
sure the amount of outgoing information from a cer-
tain user and represents the reach in the community
in a directed network. The out-degree centrality value
also represents how often a node interacts with other
nodes in the network (Hansen et al., 2020). Eigen-
vector centrality measures the importance of a node
based on the importance of its neighbors (Bihari and
Pandia, 2015), where its neighbors are also connected
to other nodes. Furthermore, eigenvector centrality
can be used to determine the most influential node in
a network (Maharani et al., 2014), as a high eigen-
vector centrality value indicates greater connectivity
compared to other nodes, resulting to a wider spread
of information flow in the network. Another central-
ity measure, betweenness centrality, is used to mea-
sure how frequently a node acts as a bridge along the
shortest path between two nodes (Xu et al., 2015).
2.2 Non-textual Factors
As Twitter is being continuously used as a medium for
information spread, the factors that affect its spread
vary on what metrics are used to compare. A previ-
ous study has shown that different types of users play
different roles in the dissemination of information on
Twitter (Cha et al., 2012). Mass media accounts, or-
dinary accounts, and even influential accounts such
as world leaders, politicians, and celebrities affect the
flow of information spread significantly (Cha et al.,
2012).
Other features such as retweets and followers are
also effective in playing a big role in the retransmis-
sion of information. Through the retweet feature, in-
formation is spread efficiently, as users who retweeted
only act as a middleware in the spreading process
(Zhang et al., 2017). This implies that readers on
Twitter will be only focused on the original message
without taking into account the users who retweeted
the messages. Meanwhile, hashtags, commonly used
as a metric to measure the popularity, were proven
to ineffective in the process of information spread on
Twitter (Skaza and Blais, 2017).
Furthermore, these non-textual factors are affect-
ing each other’s process, such as when influential ac-
counts’ posts trigger the retweet actions from their
followers resulting in the spread of the information to
accounts connected to the accounts’ followers. This
effect quickly became a continuous chain of actions,
making the information spread faster from one point
to the next.
2.3 Tweet Sentiment
There have been some researches done on analyzing
the sentiments of different messages and information
and how these sentiments affect the spread of this
piece of information on SNS (Tsugawa and Ohsaki,
2015; Hansen et al., 2011; Brady et al., 2017).
HEALTHINF 2022 - 15th International Conference on Health Informatics
422

A study by (Tsugawa and Ohsaki, 2015) inves-
tigated the relationship between the sentiment of a
message on SNS and its virality, which is defined as
the volume and speed of message diffusion. Through
extensive analyses, the research found that messages
which were perceived to have a negative polarity are
more likely to get re-posted significantly, and more
quickly and frequently compared to messages with ei-
ther positive or neutral polarity. This is also supported
by the research done by (Hansen et al., 2011), which
sought to find out what kind of sentiment would af-
fect the virality of a message on Twitter. The research
found that although negative sentiments enhanced the
virality of the message in the context of news, this was
not the case for the non-news tweets.
2.4 Tweet Topic
Understanding the topic of a tweet is crucial to iden-
tifying the information in the text. Previous studies
have used topic modeling to identify the topic a tweet
falls under.
Studies have made use of topic modeling to try
and categorize tweets into different models. A study
done by (Pirri et al., 2020) used topic modeling to
explore the nature of and extract topics posted by
users and organizations on Twitter during World Lu-
pus Day. Meanwhile, (Abd-Alrazaq et al., 2020) also
used topic modeling to identify main topics from the
tweets related to the COVID-19 pandemic. For the
first study, twelve topics were discovered. From the
results, tweets that shares additional information is
more prevalent compared to awareness messages and
informative content. It was also found that the gen-
eral public was more interested in tweets that made
the reader understand the illness and its manifesta-
tions. The second study categorized the tweets into
twelve categories, which were grouped into four main
themes: the origin of the virus, its sources, its impact
on people, countries, and the economy, and ways of
mitigating the risk of infection. In particular, users
were focused on the impact of the virus on people and
countries, which consist of death count and emotional
and psychological impact of the virus, particularly the
fear and stress about COVID-19 and the lack of vac-
cine treatments to prevent it.
3 METHODOLOGY
Figure 1 shows the process in analyzing the Twitter
data.
Figure 1: Collection and Analysis Process.
3.1 Data Gathering
The data was gathered from Twitter with Tweepy,
a Python library that accesses the Twitter API,
from December 4, 2020, to June 4, 2021. The
data gathering was conducted with snowball sam-
pling method using custom-made crawlers to extracts
tweets every day, filtering the tweets by the geolo-
cation, Philippines, and by a set of health-related
keywords — “tb”, “tuberculosis”, “WorldTBDay”,
and “TBFreePh”. The top ten Philippine-geolocated
tweets was sorted according to the number of retweets
(retweet count) and likes (favorite count). Due
to the influence of the official Twitter accounts of
the Department of Health (DOH), @DOHgovph, and
the World Health Organization (WHO) Philippines,
@WHOPhilippines, as sources of health information,
these accounts’ tweets were also collected.
3.2 Data Transformation
The data gathered were then converted into a CSV
format that is acceptable in Gephi along with other
details as the additional attributes for attribute-
categorization graphs. The raw Twitter data is con-
verted into graphs where the users are the nodes and
another graph where the tweets are the nodes. The
edges of both graphs are directed edges representing
directed interactions that exist between the users or
tweets.
There are two kinds of graph being generated for
social network analysis. Graphs with users as the
nodes are used to identify the influential users in the
network through their interactions with other users in
the network, and how they affect the spread of infor-
mation. During the process, all edges that have the
same source and target nodes will be skipped, to direct
How Health Information Spreads in Twitter: The Whos and Whats of Philippine TB-data
423

the focus to the interaction between different users in
the network. Meanwhile, graphs with tweets as the
nodes are used to see how the attributes of tweets such
as keyword, hashtag, and sentiment of the tweet can
affect the spread of information.
3.3 Data Cleaning
To remove the ambiguity of the keywords used to ex-
tract the Twitter data such as “tb”, the data were fur-
ther cleaned by generating the graph with tweets as
the nodes and importing the generated data in Gephi
to see the clusters of tweets built. Each central node
of each cluster was manually checked and validated
to see if the tweet was related to tuberculosis health
information. All clusters with a central node that did
not have any relation to health information were re-
moved. Tweets or nodes that did not have any in-
teraction coming out from them were also removed.
Finally, the cleaned data was exported and used to fil-
ter out the other data used for sentiment identification
and topic modeling.
3.3.1 Text Preprocessing
To determine the sentiment of the tweets, tweets that
are in Filipino or English were further processed. The
full
text attribute of the tweet is used to deter-
mine the sentiment of the tweet. The preprocessing
done to the full text consists of lowercasing and
removing handles and hyperlinks. For topic mod-
eling, additional preprocessing consisted of remov-
ing single quotes and newlines. Before tokenizing,
English tweets underwent lemmatization and Part-
Of-Speech (POS) tagging, preserving only “nouns”,
“proper nouns”, and “adjectives”. The tweets were
then combined and underwent the following prepro-
cessing: removing stopwords for English and Taga-
log, converting text to bigrams, creating dictionaries,
and converting to Bag-of-Words (BOW).
The social network analysis provides a visualiza-
tion of the network and analyzes the relationships of
the nodes to each other while measuring their central-
ities. Two types of networks are generated, one where
the user is the node and the other where the tweet is
the node. Moreover, it is to explore the different fac-
tors that might affect the spread of information in the
network.
3.3.2 Visualize using Gephi
In the visualization, the username of the Twitter user
is displayed. This is done to identify influential users
that affect the spread of Tuberculosis information in
the Philippines. Furthermore, data privacy is not a
concern, since Section 1.2 Public Information in Twit-
ter Privacy Policy states that most activities on Twit-
ter and all users’ information including their profile,
tweets, and interactions (replies, retweets, likes, and
quote tweets) are considered public data.
3.3.3 Measuring the Centrality
After the network is built, Gephi is used to visualize
the network in a form of a graph. Gephi also has built-
in features to compute the different centrality mea-
sures of the network (Grandjean, 2015).
3.3.4 Sentiment Identification
The sentiment of a tweet is naively determined by
checking if the tweet contains a negative keyword. If
it contained predefined negative words, emojis, and
emoticons. If the words, emojis, or emoticons exist,
the tweet is then labeled negative, otherwise it is la-
beled positive. After the categorization, each node in
the network is labeled by its sentiment. Then the sen-
timent is graphed together with the other attributes
of the tweet to see if the sentiment is a factor in the
spread of the tb data.
3.3.5 Topic Modeling
To identify the topic of the tweet, a network with
tweets as the nodes was generated and plugged into
Gephi. The visualized tweets were grouped together
according to their modularity class using the com-
pute modularity feature of Gephi to distinguish the
different communities that exist within the network,
and then were exported to undergo topic modeling.
The full text of every tweet from the exported data
underwent text preprocessing and were plugged into
the unsupervised topic modeling algorithm, Latent
Dirichlet Allocation (LDA). The keywords per topic
that were generated by the LDA were then used to la-
bel each modularity class with its respective topic by
a domain expert following a specific framework, with
an example shown in Table 1. Afterwards, the labeled
community were once again plugged into Gephi to vi-
sualize the change in topics across the network.
3.4 Result Interpretation
The different graphs from the SNA were analyzed
to see the factors affecting the information spread.
Each centrality measure was observed to identify if
the nodes with high centrality values were one of
the most influential nodes in the network. Influen-
tial nodes were determined by being the top source
of health information and nodes that cause the most
HEALTHINF 2022 - 15th International Conference on Health Informatics
424

Table 1: Sample results for topic modeling.
Comm ID Keywords Theme
1 traffic, car, road,
drive, stop, passen-
ger, park, wheel
Vehicle
2 sick, fever, symp-
toms, recovery,
cough, temperature
Illness
3 shot, efficacy, vac-
cine, antibody, im-
munity, dose
Vaccine
propagation of information. Different factors that can
affect the spread of information are analyzed by de-
termining which non-textual factors are recurring the
most in the influential nodes.
4 RESULT AND DISCUSSION
Different graphs were generated with Gephi, produc-
ing different insights regarding the relationships be-
tween the users and the non-textual and textual fac-
tors of tweets. The aforementioned centrality mea-
sures were also explored in Gephi, producing graphs
with the respective insights discussed. Analyses of
the results were also given by domain experts knowl-
edgeable in SNA and health communication.
4.1 Twitter Interaction Graphs
Figure 2 shows the user interactions, with Figure 2a
showing all user interactions while Figure 2b to Fig-
ure 2d isolate the retweet, reply, and quote tweet in-
teractions respectively. Notable accounts with high
number of users interacting with them consist of
WHOPhilippines, DOHgovph, and fan accounts of
Alden Richards, a local celebrity who spoke at a
World TB Day event. There is also significant dis-
parity between the number of retweet interactions that
make up most of the interactions with the number of
reply and quote tweet interactions, which may suggest
that replying and quote tweeting are not as strong as
retweets in spreading information due to them requir-
ing users to add more information than what is writ-
ten in the original tweet, rather than retweeting which
simply forwards the original message.
The experts also noted that two organizational ac-
tors are driving the conversation, both WHOPhilip-
pines and DOHgovph, while the presence of fan ac-
counts could denote the power of fan bases in driv-
ing the conversation as well. Another insight noted
is that WHOPhilippines and DOHgovph did not in-
teract with each other’s tweets, instead having some
users interact with both their tweets. Another sig-
nificant finding by the experts is that the same set
of actors, namely WHOPhilippines and DOHgovph,
are still prominent regardless of interaction, and there
seems to be a lack of prominent medical accounts or
media accounts that drive the conversation regarding
tuberculosis. One possible explanation for the lack
of media accounts is that since tuberculosis is not as
relevant to the public, media accounts would instead
focus on other news which garners more viewership.
4.2 Attribute-categorized Graphs
In the Attribute-Categorized Graphs, we checked how
the following four (4) attributes affect the spread of
information as shown in the interactions of the tweets:
1. keywords used in the tweet
2. hashtags used in the tweet
3. media (e.g. video or image) attached in the tweet
4. sentiment of the tweet
4.2.1 Keyword
The network in Figure 4 shows the interaction of in-
divudal tweets to each other, with the colors of the
nodes denoting the use of specific keyword (i.e. tb, tu-
berculosis). The sizes of the nodes are based on their
out-degree centrality. As seen in the graph, the key-
words “tb” is the dominant keyword. The two biggest
(a) All Interactions (b) Retweets (c) Replies (d) Quote Tweets
Figure 2: Twitter Interactions Graphs.
How Health Information Spreads in Twitter: The Whos and Whats of Philippine TB-data
425
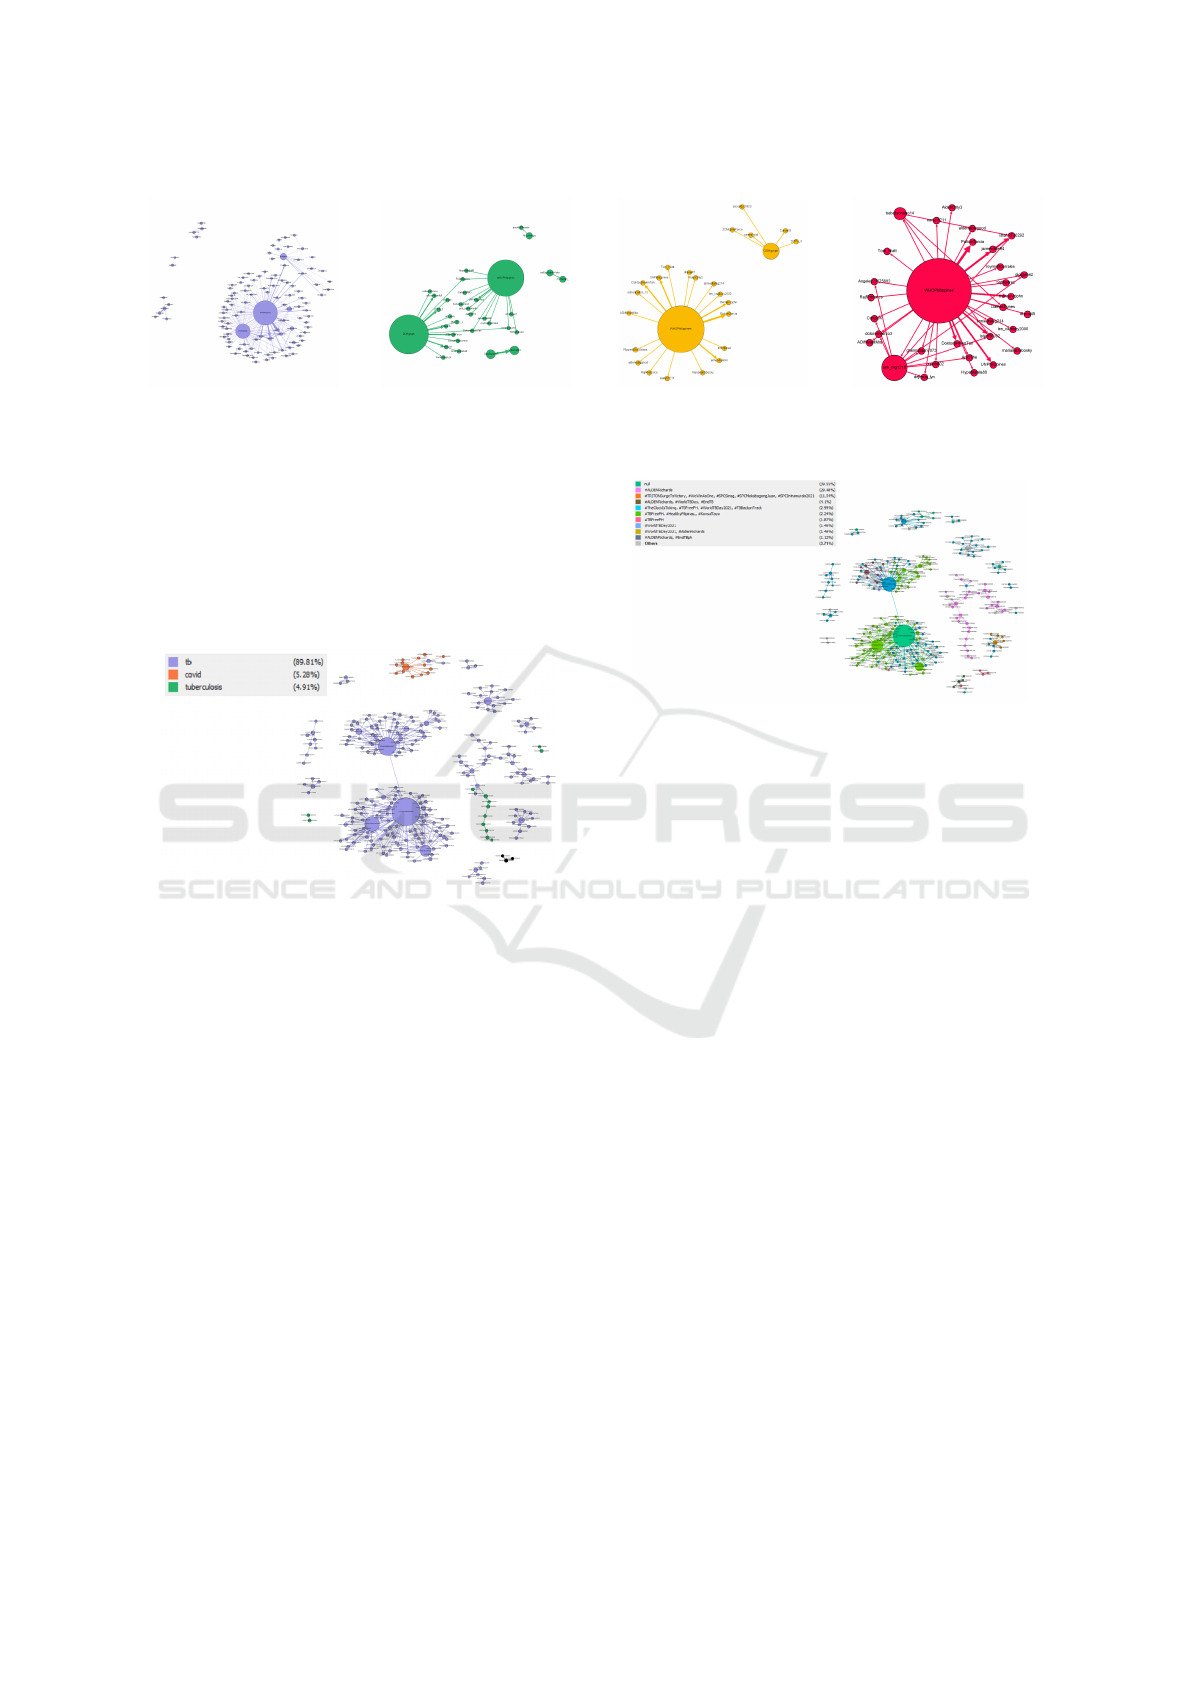
(a) tb (b) tuberculosis (c) TBFreePh (d) WorldTBDay
Figure 3: Keyword Categorized (Users as Nodes).
nodes belong to one cluster, where the root tweet is
made by WHOPhilippines and the biggest node is a
reply WHOPhilippines made to its own tweet. The
use of certain keywords (in this case, “tb”) is essential
in propagating the information within the network as
more users interact with specific keywords compared
to the others.
Figure 4: Keyword Categorized (Tweet as Nodes).
To further analyze the effects of keywords in in-
formation spread, each tuberculosis-related keyword
was plotted wherein the user is the node of the net-
work as seen in Figure 3. The size of the node is
the out-degree of the users, which is the number of
the users that interacted with them. The ”tb” keyword
graph has the most number of nodes and edges. More-
over, the difference from the other graphs are drastic.
This means that most users used “tb” keyword when
they are talking about tuberculosis.
Overall, the use of certain keywords, specifi-
cally “tb”, is essential in propagating the informa-
tion within the network, as the majority of the tweets
used “tb” when they are referring to tuberculosis. Ad-
ditionally, more users interacted with this keyword
compared to the others.
4.2.2 Hashtags
Figure 5 shows a graph where the nodes are tweets
and the color of the nodes represent a group of hash-
tags the tweets use. The node size is the out-degree
Figure 5: Categorized by the Existence of Hashtags (Tweets
as Nodes).
value of the nodes. The majority of the tweets about
tuberculosis do not make use of any hashtags in their
tweets. However, it can be seen that the most preva-
lent hashtag is #ALDENRichards. While the orig-
inal tweet contains nothing about the artist Alden
Richards, since he is the ambassador of World TB
Day, his fans are using his name as a hashtag in the
tuberculosis-related tweets. Moreover, the network
shows that not the same hashtag sets are being used
in one cluster. Oftentimes, the presence of hashtags
decreases per interaction made by the users. Some-
times, there are new hashtags that pop up while the
information is cascading, like the “ALDENRichards”
hashtag.
4.2.3 Media Attachment
The graph in Figure 6 is a network, where the tweet
is the node and the color is categorized by the pres-
ence or absence of media attachment. It can be seen
that the majority of the tweets don’t interact using
media attachments. Even though the majority of the
root nodes contain media attachments in their tweets,
the node with the highest out-degree centrality does
not contain any media attachments. Additionally, the
3rd biggest node also does not contain media attach-
ments. This shows that media attachments do not
significantly play a role in the spread of information
but rather, it is because of the users being influential,
HEALTHINF 2022 - 15th International Conference on Health Informatics
426

Figure 6: Categorized by the Existence of Media Attach-
ment (Tweets as Nodes).
which is why the clusters are big.
4.2.4 Sentiment
Figure 7: Categorized by Sentiment (Tweet as Nodes).
The graph in Figure 7 shows the tweet as a node
network, where the node colors are categorized by
sentiment and the edges are categorized by interac-
tion. It can be seen that the majority of the tweets
are negative, with a percentage of 84.7% and with
retweets inheriting the sentiment of the original tweet.
In some cases, the polarity of the tweet changes when
the sentiment is changed when replying or quote
tweeting.
The second biggest cluster showed that the ma-
jority of the children nodes with differing sentiments
were made from quote tweeting the parent node.
The cluster on the lower right show that the interac-
tions were replies to the original tweet. Upon manu-
ally checking the tweets, they contain negative words
against the disease. This could be because, in the
context of diseases, people naturally disagree or go
against it rather than support or encourage it. Overall,
the sentiment of the tweet does not affect the spread
of tuberculosis information in the network.
4.3 SNA Centrality Measures
Figure 8 shows a set of graphs with users as nodes,
where the colors of the nodes are based on the modu-
larity class or the community in the network, and the
sizes of the nodes are based on the out-degree, eigen-
vector, betweenness, and closeness centrality.
It can be seen in Figure 8a that when measur-
ing based on out-degree centrality, the top influen-
tial users are health organizational accounts and a
fan account. As noted by the experts, the differ-
ence of impact towards the spread of information be-
tween the two health organizations was mainly caused
by how often they tweeted, where DOHgovph only
tweeted once as compared to WHOPhilippines. Fur-
thermore, the impact of fan base towards the spread
of information can be seen through the network built
by urmyflashlight.
On the other hand, Figure 8b shows that the influ-
ential users are fan accounts or individual accounts,
as this type of account were most likely to react or
response to anyone who interacted with their tweets,
compared to health organizational accounts, thus,
raising their centrality value. The experts also noted
that health organizational accounts will most likely to
have low eigenvector centrality value due to the lack
of interactions they had with their followers, making
them merely sources of information.
Furthermore, figure 8c shows that the influential
users are health professionals and individual users,
including the fan accounts, signifying how informa-
tion are being passed often through the aforemen-
tioned user types, and was forwarded to other con-
nected users in the network.
As for the closeness centrality, the experts con-
cluded that the use of closeness centrality as a metric
to measure how influential a user in this case was not
very useful, as there were too many small and discon-
nected clusters in the network as shown in Figure 8d.
Furthermore, when it comes to the tuberculosis
data, the user with the highest number of followers
is DOHgovph, and its number of followers is signifi-
cantly higher compared to the rest of users in the net-
work. This shows how the number of followers of
each user does not have significant contribution or ef-
fect towards the spread of information in the network.
4.4 Topic Results
As seen in Figure 9, the topics of the interactions be-
tween users of the same clusters were not limited to
what the central nodes were talking about, as its topic
was directed towards a different focus after the inter-
actions For example, the two biggest nodes were the
How Health Information Spreads in Twitter: The Whos and Whats of Philippine TB-data
427

(a) Out-Degree (b) Eigenvector (c) Betweenness (d) Closeness
Figure 8: Centralities Graphs.
Figure 9: Topic Graph generated from results of Topic Mod-
eling.
tweets by WHOPhilippines, reminding people about
the virtual event of World TB Day. Even though both
central nodes talked about “Event”, the topics that
were being discussed by most of the tweets that in-
teracted with the central nodes were about “Ambas-
sador”, which in this context would be the fan base
of Alden Richards as he was the ambassador of the
World TB Day on last March 24, 2021. Furthermore,
aside from World TB Day, when it comes to tuber-
culosis health information, other users in the network
were also seen to be exchanging information about
tuberculosis treatments and health recommendations
for people afflicted with tuberculosis.
5 CONCLUSIONS
Twitter is a social media platform that can be utilized
to spread information, especially health information.
With tuberculosis being identified as a global public
health threat, this paper utilized social network anal-
ysis, topic modeling, and sentiment identification to
analyze the spread of tuberculosis health information
on Twitter in the Philippine setting.
The results show that among the interactions
available in Twitter, retweets are proven to have more
impact in triggering more interactions and spreading
information, followed by quote tweets, and replies as
the Twitter interactions that are less likely to have any
impact when it comes to tuberculosis health informa-
tion. Furthermore, among the attributes of the tweet
only the keyword attribute played a major role in the
spread of tuberculosis information in the network.
Meanwhile, the centrality measures show that
WHOPhilippines is the most influential user in the
spread of tuberculosis health information on Twitter.
However, with a bigger dataset or a different focus on
health information, it is still possible that other health
organizations, health professionals, or even individual
users might arise as influential users in the network.
6 FUTURE WORKS
Future studies may further analyze the results and
confirm whether these findings hold for other similar
datasets. The results may also be used as a foundation
for other studies which may opt to find information re-
lated to tuberculosis health information spread in the
Philippines, such as finding efficient ways to spread
health information through Twitter. Meanwhile, other
studies may also build upon the pipeline created by
this study, such as including finding topics commonly
used within different clusters, and use the pipeline in
other domains outside of tuberculosis and health in-
formation.
REFERENCES
Abd-Alrazaq, A., Alhuwail, D., Househ, M., Hamdi, M.,
and Shah, Z. (2020). Top concerns of tweeters during
the covid-19 pandemic: Infoveillance study. Journal
of Medical Internet Research, 22(4):e19016.
Bihari, A. and Pandia, M. K. (2015). Eigenvector central-
ity and its application in research professionals’ rela-
tionship network. In 2015 International Conference
on Futuristic Trends on Computational Analysis and
Knowledge Management (ABLAZE). IEEE.
Brady, W. J., Wills, J. A., Jost, J. T., Tucker, J. A.,
and Van Bavel, J. J. (2017). Emotion shapes the
HEALTHINF 2022 - 15th International Conference on Health Informatics
428

diffusion of moralized content in social networks.
Proceedings of the National Academy of Sciences,
114(28):7313–7318.
Brashers, D. E., Neidig, J. L., and Goldsmith, D. J. (2004).
Social support and the management of uncertainty for
people living with hiv or aids. Health Communication,
16(3):305–331.
Cha, M., Benevenuto, F., Haddadi, H., and Gummadi,
K. (2012). The world of connections and informa-
tion flow in twitter. IEEE Transactions on Systems,
Man, and Cybernetics - Part A: Systems and Humans,
42(4):991–998.
Chua, Y. T. (2020). Interest in news high, but trust low in
the philippines—2020 digital news report.
Grandjean, M. (2015). Gephi: Introduction to network anal-
ysis and visualisation. page 12.
Grandjean, M. (2016). A social network analysis of twitter:
Mapping the digital humanities community. Cogent
Arts & Humanities, 3(1).
Hansen, D. L., Shneiderman, B., Smith, M. A., and Himel-
boim, I. (2020). Twitter: Information flows, influ-
encers, and organic communities, page 161–178. El-
sevier.
Hansen, L. K., Arvidsson, A., Nielsen, F. A., Colleoni, E.,
and Etter, M. (2011). Good Friends, Bad News - Af-
fect and Virality in Twitter, volume 185, page 34–43.
Springer Berlin Heidelberg.
Himelboim, I., Smith, M. A., Rainie, L., Shneiderman,
B., and Espina, C. (2017). Classifying twitter topic-
networks using social network analysis. Social Media
+ Society, 3(1):205630511769154.
Kudchadkar, S. R. and Carroll, C. L. (2020). Using social
media for rapid information dissemination in a pan-
demic: #pedsicu and coronavirus disease 2019. Pedi-
atric Critical Care Medicine, Publish Ahead of Print.
Liang, H., Fung, I. C.-H., Tse, Z. T. H., Yin, J., Chan, C.-H.,
Pechta, L. E., Smith, B. J., Marquez-Lameda, R. D.,
Meltzer, M. I., Lubell, K. M., and et al. (2019). How
did ebola information spread on twitter: broadcasting
or viral spreading? BMC Public Health, 19(1):438.
Maharani, W., Adiwijaya, and Gozali, A. A. (2014). Degree
centrality and eigenvector centrality in twitter. In 2014
8th International Conference on Telecommunication
Systems Services and Applications (TSSA). IEEE.
Pershad, Y., Hangge, P., Albadawi, H., and Oklu, R. (2018).
Social medicine: Twitter in healthcare. Journal of
Clinical Medicine, 7(6):121.
Pirri, S., Lorenzoni, V., Andreozzi, G., Mosca, M., and
Turchetti, G. (2020). Topic modeling and user net-
work analysis on twitter during world lupus awareness
day. International Journal of Environmental Research
and Public Health, 17(15):5440.
Sbaffi, L. and Rowley, J. (2017). Trust and credibility in
web-based health information: A review and agenda
for future research. Journal of Medical Internet Re-
search, 19(6):e218.
Skaza, J. and Blais, B. (2017). Modeling the infectiousness
of twitter hashtags. Physica A: Statistical Mechanics
and its Applications, 465:289–296.
Skiles, M. P., Curtis, S. L., Angeles, G., Mullen, S., and
Senik, T. (2018). Evaluating the impact of social
support services on tuberculosis treatment default in
ukraine. PLOS ONE, 13(8):e0199513.
Tambuscio, M., Ruffo, G., Flammini, A., and Menczer,
F. (2015). Fact-checking effect on viral hoaxes: A
model of misinformation spread in social networks.
In Proceedings of the 24th International Conference
on World Wide Web - WWW ’15 Companion, page
977–982. ACM Press.
Tsugawa, S. and Ohsaki, H. (2015). Negative messages
spread rapidly and widely on social media. In Pro-
ceedings of the 2015 ACM on Conference on Online
Social Networks - COSN ’15, page 151–160. ACM
Press.
Wieland, M. L., Nelson, J., Palmer, T., O’Hara, C., Weis,
J. A., Nigon, J. A., and Sia, I. G. (2013). Evaluation of
a tuberculosis education video among immigrants and
refugees at an adult education center: A community-
based participatory approach. Journal of Health Com-
munication, 18(3):343–353.
Xu, W. W., Chiu, I.-H., Chen, Y., and Mukherjee, T.
(2015). Twitter hashtags for health: applying network
and content analyses to understand the health knowl-
edge sharing in a twitter-based community of practice.
Quality & Quantity, 49(4):1361–1380.
Zhang, X., Han, D.-D., Yang, R., and Zhang, Z.
(2017). Users’ participation and social influence dur-
ing information spreading on twitter. PLOS ONE,
12(9):e0183290.
How Health Information Spreads in Twitter: The Whos and Whats of Philippine TB-data
429
