
A Review of the Main Factors, Computational Methods, and Databases
Used in Depression Studies
Ariane C. B. da Silva
1
, Renata C. Santana
1
, Thiago H. N. de Lima
1
, Maycoln L. M. Teodoro
2
,
Mark A. Song
1
, Luis E. Z
´
arate
1
and Cristiane N. Nobre
1
1
Institute of Exact Sciences and Informatics, Pontifical Catholic University of Minas Gerais,
Dom Jos
´
e Gaspar, Belo Horizonte, Brazil
2
Department of Psychology, Federal University of Minas Gerais, Belo Horizonte, Brazil
{song, zarate, nobre}@pucminas.br
Keywords:
Depression, Data Analysis, Machine Learning, Instruments.
Abstract:
Depression is a mental health disorder that affects millions of people worldwide. The disorder results from a
complex interaction of biological, psychological, and social factors, leading to difficulty in both prognosis and
diagnosis. In this work, we performed a review on studies about depression, to identify the main computational
techniques used to support the prediction (prognosis and diagnosis) of depression, and the main attributes that
might influence the development of the disorder. Our results indicate that, in the last ten years, Logistic
Regression, Machine Learning techniques such as Support Vector Machines and Neural Networks, and other
supervised learning algorithms, have been employed more frequently for studies predicting depression and
selecting features related to it. Attributes like insomnia, gender, marital state, and use of tobacco, for example,
were related to the development of depression. The review indicated growing effectiveness in using machine
learning methods for analyzing data related to depression.
1 INTRODUCTION
Depressive disorders are characterised by feelings of
sadness, loss of interest or pleasure, feelings of guilt
or low self-esteem, disturbed sleep or appetite, low
energy and lack of concentration. Depression can be
long lasting or recurring, substantially hindering an
individual in several environments, such as work and
school (Wray et al., 2018).
Depression results from a complex interaction of
social, psychological and biological factors. People
who have experienced adverse events in life such as
unemployment, death of loved ones or psychological
trauma are more likely to develop it (Suzuki et al.,
2018). In addition, depression can lead to more stress
and dysfunction. It worsens the life situation of the
affected person and the disorder itself.
Precisely because it involves so many factors the
diagnosis of depression is still challenging (Stapley
et al., 2016), and there is an increasing demand for
computational techniques able to provide decision
support for its diagnosis. Among these techniques, we
highlight the Machine Learning and statistical meth-
ods, widely used for health problems.
Recently, Machine Learning has achieved impres-
sive results in difficult problems such as speech recog-
nition, image and video object recognition, and nat-
ural language processing (Goodfellow et al., 2016),
(Schmidhuber, 2015), (Witten et al., 2016), as well as
Bioinfomatics problems such as the prognosis of dis-
eases and disorders such as depression (Khademi and
Nedialkov, 2015), (Rav
`
ı et al., 2017) . In 2017, the
CLEF eRisk, an international workshop brought to-
gether works aiming at the early prediction of risks on
the internet, including people with suicidal inclination
or people susceptible to depression. Machine learn-
ing techniques such as Random Forest (RF), Naive
Bayes (Villegas et al., 2017), Recurrent Neural Net-
works (RNN) (Sadeque et al., 2017), Support Vec-
tor Machine (SVM) and Ensemble methods (Trotzek
et al., 2017), (Almeida et al., 2017) were used to pre-
dict as early as possible the risk of mental health is-
sues from user-generated content in social media.
Techniques capable of predicting, with high accu-
racy, whether a person may develop depression are
important to aid in its diagnosis and, consequently, its
prognosis.
B. da Silva, A., Santana, R., N. de Lima, T., Teodoro, M., Song, M., Zárate, L. and Nobre, C.
A Review of the Main Factors, Computational Methods, and Databases Used in Depression Studies.
DOI: 10.5220/0010815800003123
In Proceedings of the 15th International Joint Conference on Biomedical Engineering Systems and Technologies (BIOSTEC 2022) - Volume 5: HEALTHINF, pages 413-420
ISBN: 978-989-758-552-4; ISSN: 2184-4305
Copyright
c
2022 by SCITEPRESS – Science and Technology Publications, Lda. All rights reserved
413

A review of studies carried out in this area could
support research focused on computational tech-
niques and methods of computer science and statis-
tics, applicable to the problem of predicting whether
a person might develop depression and characterizing
its profile. This review structures relevant works that
answer questions relevant to the area, assisting in the
investigation and clinical treatment of this complex
mental disorder.
In order to identify the main works that employed
computational approaches in the diagnosis of people
with depression, three research questions, presented
in Section 2, guided this study. The questions fo-
cus on the following: 1) the main characteristics re-
lated to people with depression, 2) the main compu-
tational methods used in its analysis and 3) what kind
of databases are being used in this context .
The following Sections describe the protocol used
in this review article, and the answers we found for
the research questions we proposed.
2 METHOD
First, the research questions were specified, followed
by the development and validation of a research pro-
tocol including the inclusion/exclusion criteria for the
selection of documents. After that, the relevant ar-
ticles were selected based on the criteria adopted in
the previous phase, and have their qualities assessed,
and results summarised. Finally, in the last phase, the
results of the review were analysed and made into a
report that is then validated.
Subsections 2.1 and 2.2 better detail the process
adopted.
2.1 Research Questions
Considering that the formulation of research ques-
tions should be guided by their significance and
importance for professionals and researchers in the
field, three research questions (RQs) were formulated
for this study:
RQ 1. What are the main factors related to depression
that are cited in the literature?
RQ 2. Which computational methods, related to ma-
chine learning and statistics, are used in depression
studies?
RQ 3. What are the databases available for depres-
sion analyses?
2.2 Considered Repositories
Our choice of data sources included the main reposi-
tories of computer science articles, such as the Asso-
ciation for Computing Machinery (ACM), the Insti-
tute of Electrical and Electronics Engineers (IEEE),
ScienceDirect, and repositories related to health stud-
ies, such as PubMed. These repositories were chosen
for their scope, as they involve areas related to health
(biology, psychology, and specialised medicine top-
ics) and computing. It is relevant to highlight that,
at least, one of the terms “depression” or “depressive
disorder” needed to be present in the title or abstract
of the document and one of the terms “machine learn-
ing”, “logistic regression”, “data mining” or “statisti-
cal analysis” could be present anywhere in the text.
The process of eliminating articles was applied
with the following criteria: 1) Articles written in lan-
guages other than English and those that were not
directly related to at least two of the research ques-
tions were excluded; 2) Articles reporting on the same
study were considered equivalent, and the most re-
cent version was kept; 3) Books, tutorials, editori-
als, posters, panels, transcripts of lectures, workshops
and demonstration materials have been disregarded;
4) Articles dealing with pharmacological treatment
and analysis of its effects were disregarded, as they
are not in the scope of this review.
Table 1 presents the searched digital repositories
and the number of articles kept in each selection
phase. Each article returned by the searches was re-
viewed individually by the authors of this paper, and
the decision to keep or discard a subset of an article
was made based on a majority vote.
Table 1: Number of articles kept after each of the three fil-
tering phases of the review.
Datasets Initial Filter Filter Filter
Filter by by by
title abstract reading
ACM 39 25 23 12
IEEE 17 14 12 11
PubMed 493 233 68 26
ScienceDirect 232 83 33 7
Total 781 355 136 56
There were 56 articles
1
, identified with the letter
“A” followed by a number from 1 to 56, and then an
indication of the repository from where the article was
obtained and its publication year.
1
Data from the all articles selected after the entire selec-
tion/exclusion phase can be accessed at https://drive.google.
com/file/d/1G7EVcdiVqpgoghW1Go3E314lmuIaYOXg/
view?usp=sharing.
HEALTHINF 2022 - 15th International Conference on Health Informatics
414

3 DISCUSSION
The research questions presented in subsection 2.1 are
discussed in this Section and related to data and infor-
mation covered in the selected articles of this review.
3.1 What Are the Main Factors Related
to Depression Cited in the
Literature?
Depression is a common illness that negatively affects
people’s quality of life. Its diagnosis is difficult as
depression is caused by the interaction of varied fac-
tors such as biological, psychological, and social (Pa-
tel et al., 2007), among others, making it easy to be
misdiagnosed as different disorders, or not at all.
In order to identify these main causes, we propose
a taxonomy of relevant factors related to depression
that was obtained by integral reading the articles se-
lected in this review.
The taxonomy is presented in Figure 1, and con-
sists of four broad dimensions: 1) Comorbidities, 2)
Risk factors, 3) Identified phases of depression, and
4) Main symptoms. In addition, each of these four
broad dimensions was subdivided into more specific
aspects at different levels of granularity.
Observing Figure 1, the complexity of the interac-
tion between the factors that characterize depression
is clear, either by the number of factors or by the sub-
divisions that cover distinct but related areas: behav-
ioral, neurobiological or health-related, geographical,
socioeconomic and demographic factors. Apparently
unrelated factors such as smoking, number of people
in the family, and place of residence may, together or
not, trigger the process leading to depression. The
taxonomy highlights the difficulty inherent in the task
of diagnosing and predicting depression.
There is a connection between risk factors, co-
morbidities, major symptoms, and age/physiological
phases, concerning depression (Figure 1). We also
noted a prevalence of research on adults and people
with chronic diseases, to the detriment of other age
groups.
Risk factors can be subdivided into six main sub-
groups: behavioral, psychological, demographic, ge-
ographic, socioeconomic, neurobiological, and gen-
eral health. Regarding demographic and socioeco-
nomic questions, there is a predominance of questions
regarding age, sex and education. Such factors may
directly influence the diagnosis of the disorder since,
for example, it is known that women tend to be di-
agnosed with depression more often than men (Beck
and Alford, 2011) (Silva et al., 2014).
Regarding the most frequent symptoms in depres-
sion, sleep disorders, depressed mood, and fatigue
were the most recurrent in the studies evaluated. Such
symptoms can be easily stigmatized, that is, people
who live with a depressed individual can mistake their
symptoms with laziness and lack of interest and, con-
sequently, blame the patient. This kind of stigma has
its roots in the very construction of the definition of
the term “depression” - which, for centuries, was not
understood as a disorder that depended on the proper
care of medicine, but rather as something related to
spirituality (Quevedo et al., 2018).
Knowing and understanding the broad intercon-
nected aspects presented by this taxonomy helps in
holistically understanding depression. Treatments
that disregard the scope of the disorder may be
doomed to fail. Therefore, the challenge is to act on
different levels to enhance the quality of life of people
with depression.
3.2 Which Computational Methods,
Related to Statistics and Machine
Learning, Are Used in Depression
Studies?
Most of the works analyzed in this study used ei-
ther Logistic Regression, Neural Networks or Support
Vector Machines (SVM).
Patel et al. (2016) present a research from previ-
ous work that focuses on the study of depression and
uses features related to magnetic resonance imaging
to generate prediction models for depression. Four-
teen papers, of the fifteen selected by the authors, used
Support Vector Machines (SVM).
Galiatsatos et al. (2015) employed Bayesian Net-
works to create an optimised model of psychologi-
cal factors that lead study patients to have thoughts
of death or suicide in order to more quickly achieve
appropriate treatment. According to the authors, the
results of these experiments ratify the opinion of some
experts that the most significant factors affecting men-
tally depressed patients, who have thoughts of death
or suicide, are mood swings, loss of interest or plea-
sure, feelings of indignity/guilt, living in urban areas
and low focus.
Yang et al. (2016) used decision tree algorithms
to classify people with depression. The decision tree
was built according to the PHQ-8 score (Kroenke
et al., 2009) and other characteristics of the partici-
pants, obtained through the analysis of transcription
files from their consultations. Their model obtained
results, reaching a F1-score of 0.571 for the depressed
class and 0.877 for the non-depressed class.
A Review of the Main Factors, Computational Methods, and Databases Used in Depression Studies
415
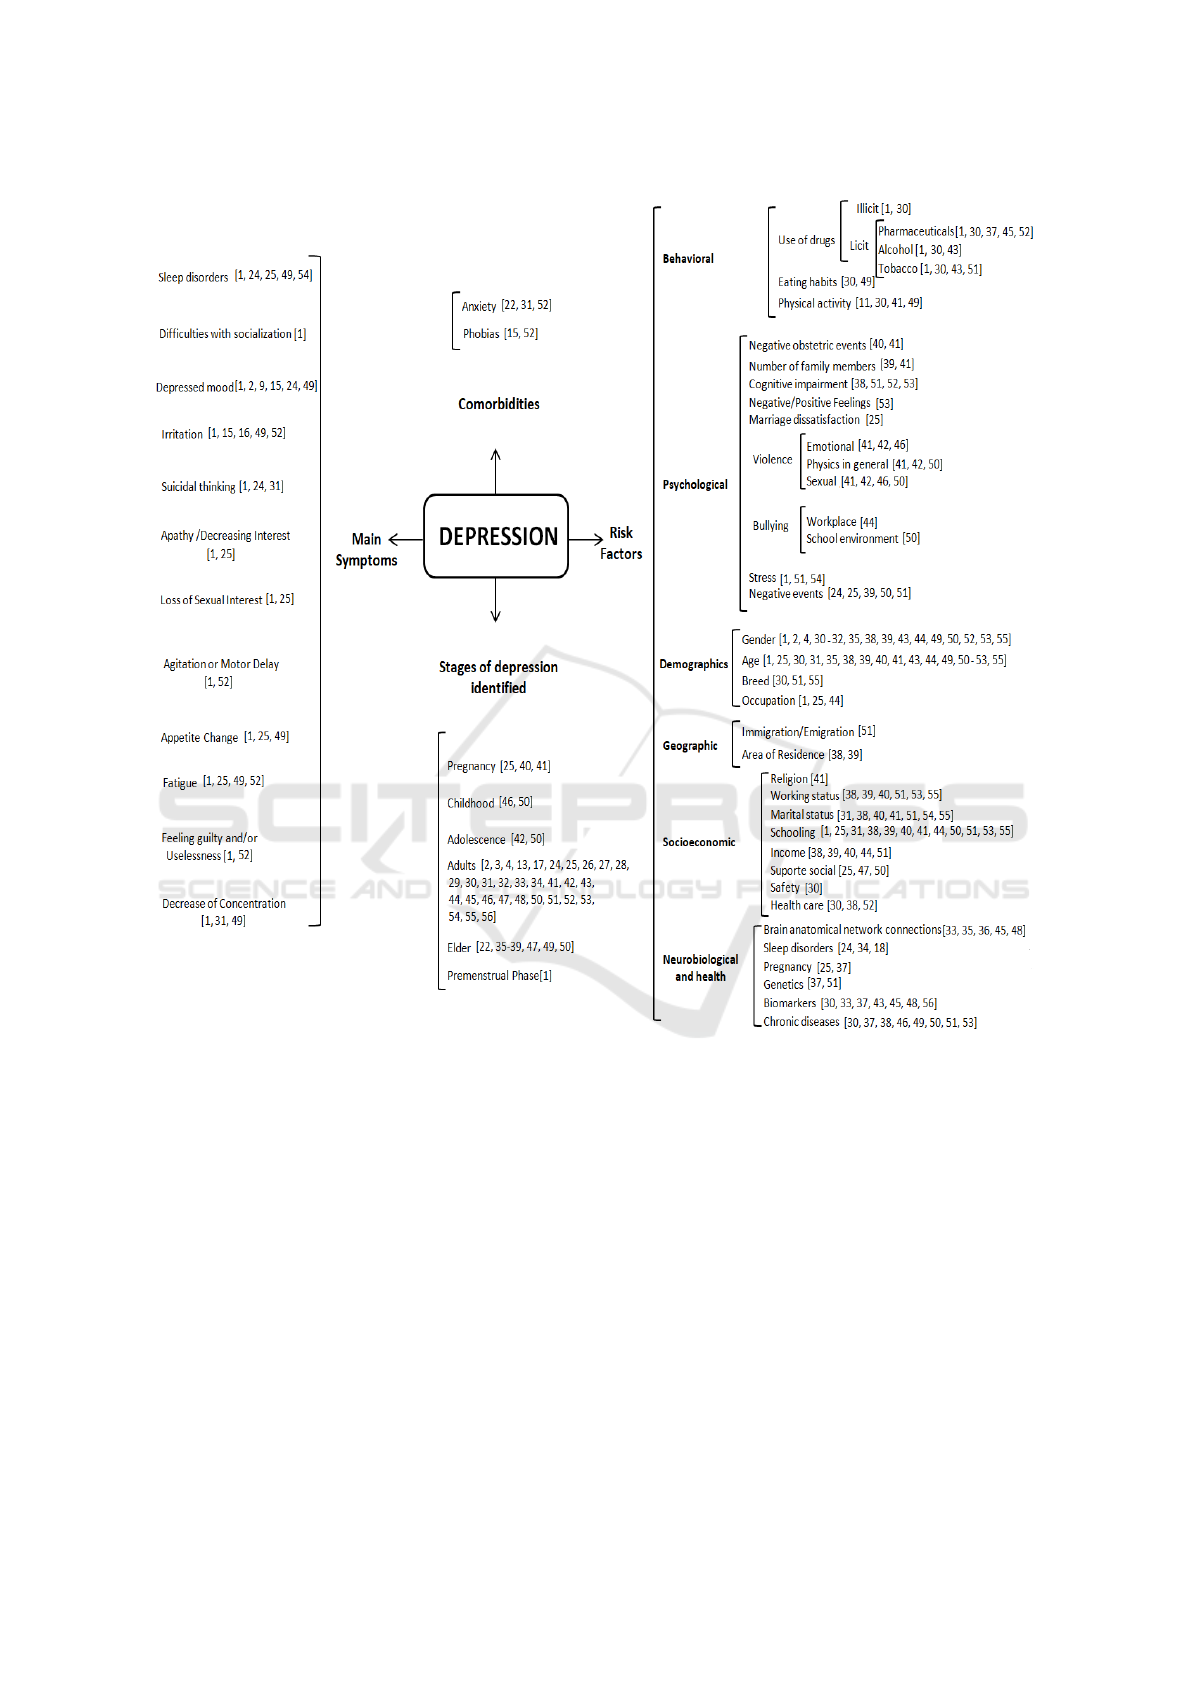
Figure 1: Factors related to depression.
Patel et al. (2015) used various machine learn-
ing methods with multimodal image input to cre-
ate prediction models for the diagnosis of depres-
sion in the elderly or late depression and treatment
response. Their demographic and cognitive ability
data were recorded, and brain characteristics were ac-
quired using multimodal magnetic resonance imaging
pre-treatment. Linear and nonlinear learning methods
were tested, and decision trees obtained the most ac-
curate prediction models for the diagnosis of late de-
pression (87.27% accuracy) and treatment response
(89.47% accuracy). The diagnostic model included
age measures, mental state examination scores and
structural imaging. The authors conclude that com-
binations of images and measurements might help to
better predict a diagnosis of late depression and treat-
ment response. They further add that these findings
may help better understanding of late depression and
identify preliminary steps for personalised treatment
of late depression.
Tung and Lu (2016) and Chen et al. (2020) used
statistical models applied to text mining to analyze
and predict signs or terms of depression in web posts.
The authors propose their own extraction method to
automatically detect negative event terms. The first
article proposed model gets a recall and F-measure
of 0.668 and 0.624, respectively and the authors con-
clude that the developed model can help doctors more
effectively diagnose and even track the depression of
web post authors.
Tadesse et al. (2019) also investigated texts posted
on social media combining machine learning and Nat-
HEALTHINF 2022 - 15th International Conference on Health Informatics
416

ural Language Processing (NLP) techniques, seeking
to identify a set of more common terms in posts from
users with depression. The authors concluded that
with the use of an especific NLP technique, the clas-
sifier with the best performance is the SVM with 80%
accuracy and 0.80 F1 scores, comparing to combined
NLP techniques associated to Multilayer Perceptron
(MLP) neural network that reached 91% accuracy and
0.93 F1 scores.
Yanikkerem et al. (2013) employed the Chi-
squared test and Fisher’s test to identify the rela-
tionship between social and demographic variables
related to pregnant women and their average scores
of a self-evaluation questionnaire that determines the
severity of depression. The authors identified that low
schooling levels, unplanned pregnancies, lack of so-
cial support, and pregnancy-related physical symp-
toms were the most important risk factors for deter-
mining prenatal depression.
Sengupta and Benjamin (2015) constructed a lo-
gistic regression model to estimate the prevalence of
depression and identify risk factors associated with
depression on the elderly population. The authors
identified that residing in urban areas, being female,
old age, living alone, poverty and functional and cog-
nitive impairment are strong predictors for depres-
sion.
Some recent studies have been using the combina-
tion of classifiers in order to further improve the pre-
diction performance of their models. Yang and Bath
(2019) proposed a system framework, to predict de-
pression in older age and assess a large number of
factors from different domain areas associated with
it, combining Gradient Boosting Machine (GBM),
Keras-based Convolutional Neural Network (KNN),
Regularized Greedy Forest (RGF) and Logistic Re-
gression. Through the proposed model, the authors
identified and separated the factors related to depres-
sion by domain area, aiming at the development of
appropriate help strategies.
Mahendran et al. (2020) proposed a stacking
based ensemble learning model to improve the predic-
tion accuracy of major depressive disorder in adults.
This model uses KNN for preprocessing, Random
Forest for feature selection, MLP, SVM and Random
Forest as low-level learners. The authors confirmed
that the prediction accuracy of the combined model is
98.16% against 96.9% in the best result of an isolated
classifier.
3.3 What Are the Datasets Available for
Depression Analyses?
Regarding the databases used in the studies, several
articles use in their experiments data obtained from
medical records of patients in clinics and hospitals
(Matza et al., 2011), (Koleva et al., 2011), (Min et al.,
2012), (Yanikkerem et al., 2013), (Hosseinifard et al.,
2013), (Zeng et al., 2014), (de Moraes et al., 2016),
(Xing et al., 2019), (Wan et al., 2020), (Mahendran
et al., 2020), however none of this data is publicly
available.
Wang et al. (2019) used the Japanese Female Fa-
cial Expression Database (JAFFE), an image dataset
developed at Kyushu University, Japan. It consists
of 10 Japanese female expressers, 7 posed facial ex-
pressions (6 basic facial expressions + 1 neutral) be-
ing several images of each expression for each ex-
presser, totaling 213 images. Each image has aver-
aged semantic ratings on 6 facial expressions by 60
Japanese viewers with resolution 256x256 pixels and
8-bit grayscale. The JAFFE images may be used for
all kinds of non-commercial scientific research.
In (Sunmoo et al., 2014), the dataset used was
The Behavioral Risk Factor Surveillance System
(BRFSS), a US health research system with data col-
lected via telephone calls. The purpose of the BRFSS
is to collect specific data on health risk behaviors,
diseases and chronic conditions, access to health ser-
vices, and use of preventive health services related
to the leading causes of death and disability in the
United States. The latest BRFSS data, from 2017,
contains 450,016 records and 358 attributes. Fac-
tors assessed by the BRFSS in 2017 included health
status, healthy days, quality of life, access to health
services, physical exercise, inadequate sleep, chronic
health conditions, oral health, smoking, electronic
cigarettes, alcohol consumption, immunization, falls,
seat-belt use, knowledge about HIV/AIDS, among
others.
In (Yang et al., 2016), the authors utilised data
from the Distress Analysis Interview Corpus - Wiz-
ard of Oz (DAIC-WOZ) database, where clinical in-
terviews are published to be used to support the diag-
nosis of psychological disorders such as anxiety and
depression. Collected data includes audio and video
recordings and questionnaire responses in which a
variety of verbal and nonverbal characteristics were
transcribed and recorded. The database includes 189
interaction sessions ranging from 7-33 minutes (av-
eraging 16 minutes). Each session includes the tran-
script of the interaction, participant audio files and fa-
cial features.
Dipnall et al. (2016) used data from the Na-
A Review of the Main Factors, Computational Methods, and Databases Used in Depression Studies
417

Table 2: Addresses for accessing the datasets.
Abbreviation
Location Sample Size
Base Year URL
JAFFE Japan 213 1998 https://zenodo.org/record/3451524#.YVt8DDHMKiM
BRFSS United States 450016 2017 https://www.cdc.gov/brfss/data documentation/index.htm
DAIC-WOZ United States 189 2017 http://dcapswoz.ict.usc.edu
NHANES United States 9544 2015-2016 https://www.cdc.gov/nchs/nhanes/index.htm
KNHANES South Korea 8518 2011 https://knhanes.cdc.go.kr/knhanes/intro.html
NPHS Canada 17276 2010-2011 https://www.statcan.gc.ca/eng/survey/household/3225
tional Health and Nutrition Examination Survey
(NHANES), a cross-sectional study program that
combines interviews and physical examinations to as-
sess the health and nutritional status of adults and
children in the United States. In the article, the au-
thors identified three bio-markers associated with de-
pression, from an initial set of 67: 1) red blood cell
distribution, 2) serum glucose, and 3) total biliru-
bin. The association between depression and the three
bio-markers is widely cited in the literature (Maes
et al., 2011) (Miller et al., 2009) (Stewart et al., 2009)
(Winokur et al., 1988).
In (Chung et al., 2014), the authors used a Ko-
rean version of the same study, the Korea Na-
tional Health and Nutrition Examination Survey (KN-
HANES). KNHANES is a cross-sectional study con-
ducted by South Korea’s National Health and Welfare
Division and is made up of three different sections: 1)
a health interview, 2) a health check and 3) a nutrition
survey. Psychological health data were obtained from
a self-reported mental health questionnaire under the
supervision of an investigator.
Wang et al. (2013) performed analyzes based on
data provided by the National Population Health Sur-
vey (NPHS). The NPHS is a longitudinal survey con-
ducted every two years in Canada since 1994/1995.
The first three research cycles (1994/1995, 1996/1997
and 1998/1999) were cross-sectional and longitudi-
nal. Starting on cycle 4 (2000/2001), it became
strictly longitudinal, that is, collecting health infor-
mation and factors that may influence it from the same
individuals in each cycle (Catlin and Will, 1992). The
NPHS longitudinal sample consists of 17,276 people
and it was not renewed over time.
Table 2 presents information that characterizes the
mentioned datasets, including the web address of each
database, for more information. Each data set is iden-
tified in the Table by its acronym.
4 CONCLUSIONS
In this work, we sought to answer three research ques-
tions through a review of the literature. We created
a taxonomy of factors related to depression, relat-
ing to the first question. The taxonomy connects
the risk factors, comorbidities, main symptoms and
age/physiological phases investigated in relation to
depression. There is a prevalence of research on
adults and/or people with chronic diseases. Regarding
demographic and socioeconomic questions, there is a
predominance of questions regarding age, sex and ed-
ucation. Six subgroups of risk factors were identified:
behavioral, psychological, demographic, geographic,
socioeconomic, neurobiological and health.
Analysis of the most recent studies of machine
learning techniques in the context of depression has
signaled a tendency to combine several classifiers to
improve the performance of the model, and ensemble
methods have been increasingly used.
Regarding the databases available for depression
investigation, it was observed that few studies made
the datasets they used publicly available, which does
not encourage further studies. We also note that the
NPHS longitudinal database signals an interest of the
scientific community to evaluate users over time.
It is necessary to consider the limitation of the
used method, as such established questions and pro-
tocols are affected by the subjectivity of the re-
searcher(s) who perform it. The researchers need
to make article/content selections to facilitate the re-
search in a timely manner throughout the review pro-
cess. In our study, the evaluation of the articles had
the participation of all authors, who together decided
whether or not the article should remain in the review.
This helped to reduce the subjectivity in the data se-
lection phase.
We also considered that if the searches had been
performed in other database repositories with differ-
ent strings, we could have found references to other
computational methods and techniques, such as deep
learning. For this reason, we understand that this is
also a limitation since the terms and journals chosen
to mark the search space and, consequently, the re-
turned articles. Although this limitation exists, clarity
about this is necessary to detect possible failures and
also further work in the future.
In this article, we show a compilation of the main
contributions of research analyzing the depression
disorder, and show how this mental disorder has been
investigated from a computing perspective. In this
HEALTHINF 2022 - 15th International Conference on Health Informatics
418

context, statistical methods can be applied in con-
junction with different machine learning techniques
at different stages of knowledge discovery processes
in order to produce increasingly assertive models in
the selection of relevant characteristics and in the fi-
nal prediction of depression and related disorders.
ACKNOWLEDGEMENTS
The authors thank the National Council for Scientific
and Technological Development of Brazil (CNPq),
the Coordination for the Improvement of Higher Ed-
ucation Personnel - Brazil (CAPES), the Founda-
tion for Research Support of Minas Gerais State
(FAPEMIG) and Pontifical Catholic University of Mi-
nas Gerais (PUC Minas).
REFERENCES
Almeida, H., Briand, A., and Meurs, M.-J. (2017). Detect-
ing early risk of depression from social media user-
generated content. In CLEF (Working Notes).
Beck, A. T. and Alford, B. A. (2011). Depress
˜
ao: causas e
tratamento. Artmed Editora, Porto Alegre, 2 edition.
Catlin, G. and Will, P. (1992). The national popula-
tion health survey: highlights of initial developments.
Health Reports, 4(3):313–319.
Chen, L., Magdy, W., Whalley, H., and Wolters, M. K.
(2020). Examining the role of mood patterns in pre-
dicting self-reported depressive symptoms. In 12th
ACM Conference on Web Science, pages 164–173.
Chung, H.-K., Cho, Y., Choi, S., and Shin, M.-J. (2014).
The association between serum 25-hydroxyvitamin D
concentrations and depressive symptoms in Korean
adults: findings from the fifth Korea National Health
and Nutrition Examination Survey 2010. PloS one,
9(6):e99185.
de Moraes, E. V., Campos, R. N., and Avelino, M. M.
(2016). Sintomas depressivos na gestac¸
˜
ao: Influ
ˆ
encia
dos aspectos social, comportamental, psicol
´
ogico e
obst
´
etrico. Revista Brasileira de Ginecologia e Ob-
stetricia, 38(6):293–300.
Dipnall, J. F., Pasco, J. A., Berk, M., Williams, L. J., Dodd,
S., Jacka, F. N., and Meyer, D. (2016). Fusing data
mining, machine learning and traditional statistics to
detect biomarkers associated with depression. PLoS
ONE, 11(2):e0148195.
Galiatsatos, D., Konstantopoulou, G., Anastassopoulos,
G., Nerantzaki, M., Assimakopoulos, K., and Lym-
beropoulos, D. (2015). Classification of the most Sig-
nificant Psychological Symptoms in Mental Patients
with Depression using Bayesian Network.
Goodfellow, I., Bengio, Y., and Courville, A. (2016). Deep
Learning. MIT Press. http://www.deeplearningbook.
org.
Hosseinifard, B., Moradi, M. H., and Rostami, R. (2013).
Classifying depression patients and normal subjects
using machine learning techniques and nonlinear fea-
tures from EEG signal. Computer Methods and Pro-
grams in Biomedicine, 109(3):339–345.
Khademi, M. and Nedialkov, N. S. (2015). Probabilistic
graphical models and deep belief networks for prog-
nosis of breast cancer. In Machine Learning and
Applications (ICMLA), 2015 IEEE 14th International
Conference on, pages 727–732. IEEE.
Koleva, H., Stuart, S., O'Hara, M. W., and Bowman-
Reif, J. (2011). Risk factors for depressive symp-
toms during pregnancy. Archives of Women’s Mental
Health, 14(2):99–105.
Kroenke, K., Strine, T. W., Spitzer, R. L., Williams, J. B.,
Berry, J. T., and Mokdad, A. H. (2009). The phq-8
as a measure of current depression in the general pop-
ulation. Journal of Affective Disorders, 114(1):163 –
173.
Maes, M., Galecki, P., Chang, Y. S., and Berk, M. (2011). A
review on the oxidative and nitrosative stress (o&ns)
pathways in major depression and their possible con-
tribution to the (neuro) degenerative processes in that
illness. Progress in Neuro-Psychopharmacology and
Biological Psychiatry, 35(3):676–692.
Mahendran, N., Vincent, P. D. R., Srinivasan, K., Sharma,
V., and Jayakody, D. K. (2020). Realizing a stacking
generalization model to improve the prediction accu-
racy of major depressive disorder in adults. IEEE Ac-
cess, 8:49509–49522.
Matza, L. S., Phillips, G. A., Revicki, D. A., Murray, L.,
and Malley, K. G. (2011). Development and vali-
dation of a patient-report measure of fatigue associ-
ated with depression. Journal of Affective Disorders,
134(1-3):294–303.
Miller, A. H., Maletic, V., and Raison, C. L. (2009). Inflam-
mation and its discontents: the role of cytokines in the
pathophysiology of major depression. Biological psy-
chiatry, 65(9):732–741.
Min, J. A., Lee, S. H., Lee, S. Y., Chae, J. H., Lee, C. U.,
Park, Y. M., and Bae, S. M. (2012). Clinical character-
istics associated with different strengths of loudness
dependence of auditory evoked potentials (LDAEP)
in major depressive disorder. Psychiatry Research,
200(2-3):374–381.
Patel, M. J., Andreescu, C., Price, J. C., Edelman, K. L.,
Reynolds, C. F., and Aizenstein, H. J. (2015). Ma-
chine learning approaches for integrating clinical and
imaging features in late-life depression classification
and response prediction. International Journal of
Geriatric Psychiatry, 30(10):1056–1067.
Patel, M. J., Khalaf, A., and Aizenstein, H. J. (2016). Study-
ing depression using imaging and machine learning
methods. NeuroImage: Clinical, 10:115–123.
Patel, V., Flisher, A. J., Hetrick, S., and McGorry, P. (2007).
Mental health of young people: a global public-health
challenge. The Lancet, 369(9569):1302–1313.
Quevedo, J., Nardi, A. E., and da Silva, A. G. (2018). De-
press
˜
ao-: Teoria e Cl
´
ınica. Artmed Editora.
A Review of the Main Factors, Computational Methods, and Databases Used in Depression Studies
419

Rav
`
ı, D., Wong, C., Deligianni, F., Berthelot, M., Andreu-
Perez, J., Lo, B., and Yang, G.-Z. (2017). Deep learn-
ing for health informatics. IEEE journal of biomedical
and health informatics, 21(1):4–21.
Sadeque, F., Xu, D., and Bethard, S. (2017). Uarizona at the
clef erisk 2017 pilot task: linear and recurrent models
for early depression detection. In CEUR workshop
proceedings, volume 1866. NIH Public Access.
Schmidhuber, J. (2015). Deep learning in neural networks:
An overview. CoRR, abs/1404.7828.
Sengupta, P. and Benjamin, A. (2015). Prevalence of de-
pression and associated risk factors among the elderly
in urban and rural field practice areas of a tertiary
care institution in Ludhiana. Indian Journal of Public
Health, 59(1):3.
Silva, M. T., Galvao, T. F., Martins, S. S., and Pereira,
M. G. (2014). Prevalence of depression morbid-
ity among brazilian adults: a systematic review and
meta-analysis. Revista Brasileira de Psiquiatria,
36(3):262–270.
Stapley, E., Midgley, N., and Target, M. (2016). The ex-
perience of being the parent of an adolescent with a
diagnosis of depression. Journal of Child and Family
Studies, 25(2):618–630.
Stewart, J. C., Rand, K. L., Muldoon, M. F., and Kamarck,
T. W. (2009). A prospective evaluation of the direc-
tionality of the depression–inflammation relationship.
Brain, behavior, and immunity, 23(7):936–944.
Sunmoo, Y., Basirah, T., et al. (2014). Using a data mining
approach to discover behavior correlates of chronic
disease: a case study of depression. Studies in health
technology and informatics, 201:71.
Suzuki, M., Furihata, R., Konno, C., Kaneita, Y., Ohida, T.,
and Uchiyama, M. (2018). Stressful events and coping
strategies associated with symptoms of depression: A
japanese general population survey. Journal of affec-
tive disorders, 238:482–488.
Tadesse, M. M., Lin, H., Xu, B., and Yang, L. (2019). De-
tection of depression-related posts in reddit social me-
dia forum. IEEE Access, 7:44883–44893.
Trotzek, M., Koitka, S., and Friedrich, C. M. (2017). Lin-
guistic metadata augmented classifiers at the clef 2017
task for early detection of depression. In CLEF (Work-
ing Notes).
Tung, C. and Lu, W. (2016). Analyzing depression ten-
dency of web posts using an event-driven depression
tendency warning model. Artificial Intelligence in
Medicine, 66:53–62.
Villegas, M. P., Funez, D. G., Ucelay, M. J. G., Cagnina,
L. C., and Errecalde, M. L. (2017). Lidic-unsl’s par-
ticipation at erisk 2017: Pilot task on early detection
of depression. In CLEF (Working Notes).
Wan, Z., Huang, J., Zhang, H., Zhou, H., Yang, J., and
Zhong, N. (2020). Hybrideegnet: A convolutional
neural network for eeg feature learning and depression
discrimination. IEEE Access, 8:30332–30342.
Wang, H., Zhou, Y., Yu, F., Zhao, L., Wang, C., and Ren, Y.
(2019). Fusional recognition for depressive tendency
with multi-modal feature. IEEE Access, 7:38702–
38713.
Wang, J., Manuel, D., Williams, J., Schmitz, N., Gilmour,
H., Patten, S., MacQueen, G., and Birney, A. (2013).
Development and validation of prediction algorithms
for major depressive episode in the general popula-
tion. Journal of Affective Disorders, 151(1):39–45.
Winokur, A., Maislin, G., Phillips, J. L., and Amsterdam,
J. D. (1988). Insulin resistance after oral glucose tol-
erance testing in patients with major depression. Am J
Psychiatry, 145(3):325–330.
Witten, I. H., Frank, E., Hall, M. A., and Pal, C. J. (2016).
Data Mining: practical machine learning tools and
techniques with Java implementations. Morgan Kauf-
mann, 4 edition.
Wray, N. R., Ripke, S., Mattheisen, M., Trzaskowski, M.,
Byrne, E. M., Abdellaoui, A., Adams, M. J., Agerbo,
E., Air, T. M., Andlauer, T. M., et al. (2018). Genome-
wide association analyses identify 44 risk variants and
refine the genetic architecture of major depression.
Nature genetics, 50(5):668.
Xing, Y., Rao, N., Miao, M., Li, Q., Li, Q., Chen, X., Zhang,
Q., and Wu, J. (2019). Task-state heart rate variabil-
ity parameter-based depression detection model and
effect of therapy on the parameters. IEEE Access,
7:105701–105709.
Yang, H. and Bath, P. A. (2019). Automatic prediction of
depression in older age. In Proceedings of the third
International Conference on Medical and Health In-
formatics 2019, pages 36–44.
Yang, L., Jiang, D., He, L., Pei, E., Oveneke, M. C., and
Sahli, H. (2016). Decision Tree Based Depression
Classification from Audio Video and Language Infor-
mation. In Proceedings of the 6th International Work-
shop on Audio/Visual Emotion Challenge - AVEC ’16,
AVEC ’16, pages 89–96, New York, NY, USA. ACM.
Yanikkerem, E., Ay, S., Mutlu, S., and Goker, A. (2013).
Antenatal depression: Prevalence and risk factors in a
hospital based Turkish sample. Journal of the Pakistan
Medical Association, 63(4):472–477.
Zeng, L. L., Shen, H., Liu, L., and Hu, D. (2014). Un-
supervised classification of major depression using
functional connectivity MRI. Human Brain Mapping,
35(4):1630–1641.
HEALTHINF 2022 - 15th International Conference on Health Informatics
420
