
Towards Personalization by Information Savviness to Improve User
Experience in Customer Service Chatbot Conversations
Tim Polzehl
1,2 a
, Yuexin Cao
2
, Vicente Ivan Sanchez Carmona
3
, Xiaoyi Liu
3
, Changjian Hu
3
,
Neslihan Iskender
2
, Andr
´
e Beyer
4
and Sebastian M
¨
oller
1,2
1
German Research Center for Artificial Intelligence, Berlin, Germany
2
Technische Universit
¨
at Berlin, Berlin, Germany
3
Lenovo Research AI Lab, Beijing, China
4
Crowdee GmbH, Berlin, Germany
Keywords:
User Experience, Chatbot, Personalization, User Modeling, Information Savviness.
Abstract:
Information savviness describes the ability to find, evaluate and reflect information online. Customers with
high information savviness are more likely to look up product information online, read customer reviews be-
fore making a purchase decision. By assessing Information Savviness from chatbot interactions in a technical
customer service domain, we analyze its impact on user experience (UX), expectations and preferences of
the users in order to determine assessable personalization targets that acts dedicatedly on UX. To find out
which UX factors can be assessed reliably, we conduct an assessment study through a set of scenario-based
tasks using a crowd-sourcing set-up and analyze UX factors. We reveal significant differences in users’ UX
expectations with respect to a series of UX factors like acceptability, task efficiency, system error, ease of use,
naturalness, personality and promoter score. Our results strongly suggest a potential application for essen-
tial personalization and user adaptation strategies utilizing information savviness for the personalization of
technical customer support chatbots.
1 INTRODUCTION
Conversational agents, such as chatbots, have recently
become popular in the customer support industry. A
successful chatbot enhances customer satisfaction by
allowing customers to address problems quickly, eas-
ily, and satisfactorily. Subjective evaluation from a
user’s perspective, particularly the assessment of user
experience (UX), is frequently used as an indicator of
the performance of a chatbot. Essentially, in accor-
dance with ISO 9241-210 (ISO, 2010), in this work
we view UX as ”a person’s perceptions and responses
that come from the usage and/or expected use of a
product, system, or service.”
Customer segmentation is widely used in UX
evaluation for the customer service domain, dividing
customers into groups that can be targeted based on
information such as geographic (live place), socio-
demographic (age, gender), psychographic (lifestyle,
personality), and behavioral (consumption, spending)
factors. Customer satisfaction might be improved by
a
https://orcid.org/0000-0001-9592-0296
providing tailored messages or adapting chatbot ser-
vices to the demands of certain user segments, result-
ing in increased customer loyalty and retention.
One particular customer characteristic which has
frequently been neglected in the past is Information
Savviness. Information savviness is often used as a
synonym for digital literacy and information literacy,
referring to the capability of recognizing when and
why certain information is needed and the ability to
locate, evaluate and use the needed information ef-
fectively (Association et al., 1989; Owen, 2003). In
the internet-savviness scale designed by Geyer et al.,
one of the dimensions is information gathering, ad-
dressing the ability to use the internet’s information
resources and tools in a discriminating way (Geyer,
2009). Braccini et al. developed a measuring model
for investigating so-called digital natives and their be-
haviors. Six variables were identified in the literature
review, out of which the use of different tools simulta-
neously, coping with speed and information, and eval-
uation of online source of information are highly re-
lated to the concept of information savviness (Brac-
cini and Federici, 2013).
36
Polzehl, T., Cao, Y., Carmona, V., Liu, X., Hu, C., Iskender, N., Beyer, A. and Möller, S.
Towards Personalization by Information Savviness to Improve User Experience in Customer Service Chatbot Conversations.
DOI: 10.5220/0010814200003124
In Proceedings of the 17th International Joint Conference on Computer Vision, Imaging and Computer Graphics Theory and Applications (VISIGRAPP 2022) - Volume 2: HUCAPP, pages
36-47
ISBN: 978-989-758-555-5; ISSN: 2184-4321
Copyright
c
2022 by SCITEPRESS – Science and Technology Publications, Lda. All rights reserved

In this paper, we investigate the relationship be-
tween information savviness and UX aspects of a
text-based chatbot in a study operationalizing three
task-based scenarios on the Motorola Support Virtual
Agent chatbot “Moli”
1
. Recently, human evaluation
of dialogue assessment shifted from a lab to a more
scalable crowd environment, also for reasons of effi-
ciency wrt. speed and costs (Banchs, 2016; Yu et al.,
2016; Hoßfeld et al., 2013). Still, to the best of the
authors’ knowledge, there has not been any work fo-
cusing on the analysis of chatbot UX as a dependent
factor of information savviness to date. In more de-
tail, we split users by self-reported information savvi-
ness and analyze expectations with respect to a series
of UX constituents like acceptability, task efficiency,
system error, ease of use, naturalness, personality, and
promoter score.
UX has traditionally been assessed explicitly, i.e.
users are aware of this task to perform, which is to re-
flect on their own expectations, feelings and thoughts,
and gather their views and opinions. A subjective
evaluation from a small number of users invited to
a laboratory experiment for interacting with a chat-
bot and then judging UX aspects on a questionnaire
is common practice. For the laboratory environment
there are few but well established UX questionnaires
suitable for a subjective evaluation of a dialogue
system, e.g. Usability Metric for User Experience
(UMUX) (Finstad, 2010), Chatbot Evaluation Ques-
tionnaire (Quarteroni and Manandhar, 2009), ITU-
T Recommendation P.851 (ITU-T, 2003), as well as
short forms like Net Promoter Score (NPS) (Reich-
held, 2011).
In crowd-based UX assessment, participants of
online UX tests are found via online crowdsourcing
platforms. These participants are recruited from the
platforms, and rewarded for their participation mostly
by small compensations like 1 or 2 Euro/Dollar. Af-
ter interacting with the desired system, users are in-
terviewed mostly by means of online questionnaires.
The paper is organized as follows. First, we dis-
cuss prior work on UX assessment of chatbots, user
segmentation, and crowdsourcing approaches. Then
we describe the method including the construction
of scenarios, UX questionnaires, user segmentation
items, and the conduction of our crowd-based UX
study in the experiment setup. Next, we present the
results in the light of the discussed user segmentation.
Finally, we discuss and conclude our results and indi-
cate future research.
1
https://moli.lenovo.com/callcenter/moli
2 RELATED WORK
In terms of interaction-based and/or conversational
system assessment techniques, Deriu (Deriu et al.,
2021) found that human evaluation is migrating from
the lab to the crowd. Crowdsourcing is very use-
ful for usability testing and UX assessment since it
saves money and time, e.g. (Liu et al., 2012; Go-
mide et al., 2014; Kittur et al., 2008; Nebeling et al.,
2013; Bruun and Stage, 2015). When comparing
crowd and lab in a contrasting analysis, Liu (Liu
et al., 2012) demonstrated concrete applicability and
efficacy of a range of types of crowd-based assess-
ment. Banches (Banchs, 2016) compared expert- and
crowd-based annotations for evaluating chat sessions
at the turn level and found that simple majority vote
over crowd-sourced annotations exhibits similar or
even higher inter-annotator agreements compared to
expert annotations. Additionally, Yu (Yu et al., 2016)
used crowdsourced annotations to annotate chatbot
responses for likability and engagement between the
crowd-workers and the chatbot. Other studies proved
comparability in between crowd and lab, or crowd and
expert annotation quality in related applications such
as assessment of quality of text summarization tech-
niques (Iskender et al., 2020a; Iskender et al., 2020b)
or prosodic user characterization (Polzehl, 2014).
Recently, human evaluation has increasingly
shifted from a lab environment towards crowdsourc-
ing environments in two ways. One way is to instruct
crowdworkers to interact with a chatbot system and
rate the interaction using given UX items a-posteriori.
Jurc
´
ıcek (Jurc
´
ıcek et al., 2011) analyzes the validity
of using crowdsourcing for evaluating dialogue sys-
tems. Their results suggest that using enough crowd-
sourced users, the quality of the evaluation is compa-
rable to the lab conditions. Another way, which is still
mainly under-explored, is to provide crowdworkers
with a context and responses from the system, such
as a chat log protocols, instead of conducting a direct
interaction with a system.
As of UX evaluation, it is non-trivial to assess user
experience since it is subjective, context-dependent,
and dynamic over time (Law et al., 2009). For the
first way of collecting UX judgments after chatbot
interactions, there are a number of questionnaires
available which have mostly been used in a labora-
tory environment, such as the Usability Metric for
User Experience (UMUX) (Finstad, 2010), Chatbot
Evaluation Questionnaire (Quarteroni and Manand-
har, 2009), Net Promoter Score (NPS) (Reichheld,
2011) and ITU-T Recommendation P.851 (ITU-T,
2003). The International Telecommunication Union
(ITU-T) is an specialized organ of the United Na-
Towards Personalization by Information Savviness to Improve User Experience in Customer Service Chatbot Conversations
37

tions in the field of telecommunications, focusing on
the standardization sector. The latter questionnaire,
which was developed for spoken chatbots, addresses
eight components of UX which had been selected as
a result of a literature survey, using principle compo-
nent analyses (see (M
¨
oller et al., 2007)).
These are acceptability (e.g. system helpful-
ness, comfort and efficiency), cognitive demand, task-
efficiency (e.g. clarity of the provided information),
system errors, ease of use, cooperativity, naturalness,
and speed of the interaction.
Informaton savviness is often used as the syn-
onyms of digital literacy and information literacy, re-
ferring to the capability of recognizing when and why
the information is needed and the ability to locate,
evaluate, reflect and use the needed information ef-
fectively (Association et al., 1989; Owen, 2003). In
the internet-savviness scale designed by Geyer et al.,
one of the dimension is information gathering, ad-
dressing the ability to use the internet’s information
resources and tools in a discriminating way (Geyer,
2009). Braccini et al. also developed a measuring
model for investigating the digital natives and their
behaviors. Accordingly, six variables identified in the
literature review, among which the use of different
tools simultaneously, coping with speed and informa-
tion, and evaluation of online source of information
are highly related to the concept of information savvi-
ness (Braccini and Federici, 2013). Finally, Cao (Cao
et al., 2021), found significant differences in the UX
expectation of users of a chatbot system when seg-
menting toward the concept of self-efficacy, one of
the essential factors for customer segmentation, ac-
cording to (Lai, 2016), the concept of self-efficacy,
which describes the desire to be seen as unique and
the determination to claim that. To the best of the au-
thors knowledge, there is no work systematically ex-
ploring information savviness segmentation for UX
preferences in the given domain.
3 EXPERIMENTAL SETUP
3.1 Task Design
Since crowd-workers recruited were not real Mo-
torola customers in the present study, the authors care-
fully created three dialogue scenarios, each of which
requires a chatbot interaction to address and solve the
scenario problem, based on the authors manual expert
assessment of a significant number of chat logs and
scenarios described in the production system logs of
the Moli chatbot.
For selection of the dialog scenarios we consid-
ered multiple criteria, e.g. the degree of expected di-
alog complexity, expected ambiguity, degree of ex-
pected variation, etc., trying to retain a certain share
of the original variation in the selection. Next, the par-
ticipants, i.e. crowd-workers, were provided with ad-
ditional situational information, e.g. history of trou-
bleshooting steps to be assumed as already done or
tried, and an understanding of stopping criteria defin-
ing when a task could be considered solved, includ-
ing an indication of what kind of answer would ful-
fill such a stopping criterion. For example, in one
scenario, a phone was introduced to have a charg-
ing problem. It could therefore not be powered on,
not with normal working charging system, nor port,
charger or wall outlet. Users were to interact with
the bot until the bot explains how to execute a battery
diagnosis function, which finally indicates the reason
of the problem. In another scenario, the phone was
introduced to be dropped into water, and users were
to inquire into related warranty issues. The expected
answers here could be given inside a direct system
response turn, or included in a compressed overview
list of warranty articles that are displayed to the users
upon certain match. In the third scenario, users were
to inquire about a hardware accessory (here for wire-
less charging), which was actually not available for
the given phone model. There were several interac-
tion ways and dialog paths the user could reach this
information.
3.2 Item Construction
Adapting and extending ITU-T Recommendation
P.851, cf. Section 2, we selected five UX factors to
be included in our study:
1. Acceptability
2. Task Efficiency
3. System Errors
4. Ease of Use
5. Naturalness
We further introduced two additional factors:
6. Personality
7. Promoter Score
The promoter score, inspired by the Net Promoter
Score, resembles the likelihood of further recommen-
dation to friends and others and the personal willing-
ness to reuse the chatbot. In the factor called Person-
ality we assess the perceived friendliness and polite-
ness of the chatbot interaction. Eventually, we created
14 items pairs, with each pair consisting of one pos-
itively and one negatively formulated item to allow
HUCAPP 2022 - 6th International Conference on Human Computer Interaction Theory and Applications
38

for item consistency scoring. Exact item formulation
resembles (M
¨
oller et al., 2007). All UX items used
in this study are shown in Table 1. The scenario se-
quence order as well as the item order was random-
ized for each participant individually.
Table 1: Item definitions for UX assessment.
Items Definition
A Five pairs assessing the factor
[1, 5] acceptability, i.e. helpfulness (A1),
satisfaction pleasure (A2), efficiency
(A3), dialogue smoothness (A4), and
length (A5)
TE Three pairs assessing the factor task
[1, 3] efficiency, measuring the clearness and
scope (TE1), accuracy of the solutions
(TE2), and ease of disambiguation (TE3)
SE One pair assessing the factor system
error, measuring the perception of
mistakes in understanding.
E Two pairs assessing the factor ease of
[1, 2] use, measuring the ease of use (E1) and
expected behavior of the chatbot (E2).
N One pair assessing the factor naturalness,
measuring the naturalness of the chatbot
reaction.
P One pair assessing the system personality,
measuring the politeness and friendliness
of the chatbot.
PS One pair assessing the promoter score,
measuring the likelihood of reuse
and recommendation of the chatbot.
For information savviness assessment, we defined
four items IS1-IS4, according to the discrete and
digitally-coined description of the concept of infor-
mation savviness given in (Lai, 2016). All segmenta-
tion items used in this study are shown in Table 2.
3.3 Crowdsourcing Setup
We conducted all of the crowdsourcing experiments
on the Crowdee platform.
2
The crowd workers were
recruited to be English native speakers from the US,
and instructed to read the problem description first,
then interact with Moli chatbot, and finally answer
the UX and segmentation items. Each item was dis-
played on a single page using a 5-point Likert scale,
ranging from strongly agree, agree, neither agree nor
disagree, disagree to strongly disagree. Items assess-
ing information savviness had an additional answer
option Cannot tell designed for participants who have
2
https://www.crowdee.com
Table 2: Item definitions for information savviness assess-
ment.
Items Definition
IS1 I am familiar with relevant technology
terms, e.g., IMEI, home screen, nano sim,
update, etc., and I think I am able to
answer most technical questions on
further inquiry from the support easily.
IS2 I often search the internet about my
problem for potential solutions also
before contacting the Customer Service.
IS3 I feel proficient in acknowledging and
weighting the validity of different
information from different sources in the
internet like from Social Media, from
Forums, or directly from Customer
Support.
IS4 I’m oftentimes eager for further
information about related problems,
solutions or products that interests me.
difficulties in this self-assessment task.
Each crowd worker was randomly assigned to one
scenario at the beginning. If they successfully passed
the designed quality control tests (cf. below), their
answers were accepted and another task including a
different scenario was provided to them, until all the
scenarios were assessed by 100 unique participants.
Participants who failed the quality check were ex-
cluded, and the respective answers withdrawn from
the answer pool. To exert continuous control of the
quality of individual crowdsourcing contributions di-
rectly while executing the study and excluding unmo-
tivated users before they can introduce noise in the
annotations, the Crowdee platform offers real-time
online scoring of participants. We chose the con-
tinuous consistency monitoring method, and set it to
monitor the absolute difference of our inversely con-
structed item pairs in two ways. First, the overall
divergence accumulated for all the pairs should not
exceed a given threshold th
sum
. Next, the maximum
count of occurrence of large differences within a pair
was set to another threshold th
max−count
, while a large
difference was defined as th
max
points. According
to the results of internal pre-tests we set th
sum
= 30,
th
max
= 3 and th
max−count
= 3, which after all resem-
bles a rather conservative threshold setup allowing for
a rather large proportion of deviation. Finally, an-
swers showing a particularly short working time were
also registered to be rejected in real-time. Compliant
participants were provided all 3 scenarios iteratively
by the automated quality control workflow.
When finishing a scenario we asked the crowd
workers for qualitative feedback on task clarity, sce-
Towards Personalization by Information Savviness to Improve User Experience in Customer Service Chatbot Conversations
39

nario understanding and issues experienced. These
responses were given in free text form.
Overall, 313 crowd workers were recruited for the
study to collect 100 repetitions of each of our three
scenarios. The majority of participants successfully
passed the automatic quality control checkups. As a
first indication, this low exclusion rate, paired with
very positive qualitative feedback given to us in the
end of the study, suggests that the design has been
understood and accepted, and the study could be ro-
bustly conducted in crowd environments. Eventually,
very few participants chose the “cannot tell” answer
option in response to our information savviness items,
which for the current work lead to an exclusion from
the analysis presented here. In total we include 299
valid UX assessment along information savviness as-
sessments for the subsequent analysis.
4 RESULTS
4.1 Qualitative Feedback Analysis
As a first step of the analyzes the authors manually
categorized the individual qualitative feedback an-
swers collected at the end of the overall study into
positive, neutral and negative feedback. The feed-
back was further split into feedback towards Moli UI
interaction part and towards overall crowd-study fea-
sibility, appropriateness and flow. Accordingly, the
users rated the chatbot interaction as 14% positive,
77% neutral and 9% negative; the crowd-feasibility
was rated 4% positive, 93% neutral and 3% negative.
To give some examples, users stated the chatbot to
be “very easy to follow and interact with”, and “It was
fun, easy and rewarding”, and “The interaction was
short and efficient, I received the answer much faster
than anticipated”. On the information provided, users
stated “I was very impressed with the way the bot han-
dled this enquiry. The information on how to solve the
issue was clear and relevant.”, and “The answer was
accurate and precise. When I entered a further com-
ment, the chat bot gave me further useful information.
Overall a very positive experience”.
Others stated “When I received the answer from
the chatbot the information about the phone itself took
up a lot of space and I had to scroll up to see the an-
swer to my question, this was a little bit confusing” or
“It’s not immediately obvious where to start the chat
with Moli as the text box isn’t easy to see”.
Other users required more options, e.g. “I liked
the chatbot, but he needs to have more answers” or
“At the end it directed me to repair options but at that
point I wanted to ask the chatbot for more info and
wasn’t able to” or “It would be a good idea if you
could explore both lines of enquiry at the same time
- I had to select if it wasn’t charging/slowly charging,
or it won’t turn on and follow the steps individually.
It wasn’t easy to simply look at both options, even
though both options applied to my scenario”.
Yet other participants had problems in realizing a
precise stopping condition in the scenario course, e.g.
“Moli seems to work quite well, but it’s not neces-
sarily easy to know when to stop the interaction for
the purposes of this survey” or “I am also not sure
if the option it offered to get it repaired would count
as a success because it would fix the battery if that
is what’s broken?”. Also, for the easy scenario, the
task appeared too easy for some uses, e.g. “I’m not
sure how it would handle more difficult questions and
I’m interested in seeing how it would bridge to a real
support technician.” Overall, the low amount of neg-
ative feedback is out-weighted by neutral or positive
feedback clearly, which confirms the personal impres-
sions of the authors that the study was well under-
stood and well feasibly designed and situated in the
chosen crowdsourcing environment.
4.2 Reliability of UX Items
For our first analysis, we calculated Cronbach’s Al-
pha for each of the inverted item pairs as a measure of
consistency of user responses. In general, alpha val-
ues over 0.5 can be interpreted as moderate, over 0.8
as good or high, and over 0.9 as very good or very
high consistency, whereas values below 0.5 are com-
monly seen as indicating bad or low consistency.
Pooling all responses from all 3 scenarios and
looking at individual items on the acceptability fac-
tor, 4 out of 5 item pairs have moderate or high con-
sistency, i.e. A2 = 0.73, A3 = 0.77, A1 = 0.87, and
A4 = 0.85. When aggregating all items into a joint re-
liability the consistency reaches A
1−4
= 0.94, which
can be seen as very good. However, A5 shows a rel-
ative low consistency of 0.41. One possible explana-
tion for this finding may be that A5 items may not be-
ing semantically strictly biuniquely inverted, i.e. the
opposite of too long might be the suggested too short,
but it might as well be just fine or long enough. Fu-
ture experiments will need to revisit these items.
Analyzing task efficiency, we obtain T E1 = 0.78
and T E2 = 0.89, as well as T E3 = 0.57, leading to a
high joint reliability of 0.89 on factor level.
The two item pairs of ease of use result in E1 =
0.69, and E2 = 0.67, with a joint reliability of 0.80,
which can be seen as good consistency. Also System
error and naturalness could be assessed with over-
all good consistency (SE = 0.83, N = 0.81), while
HUCAPP 2022 - 6th International Conference on Human Computer Interaction Theory and Applications
40
promoter score achieved a moderate consistency of
PS = 0.76.
Eventually, our item pair suggested to measure
system personality showed a low consistency of 0.41.
Similar to the results on A5 reported above, these
items were borrowed from other questionnaires and
should be revised in future studies. Again, the con-
cepts of impoliteness and friendliness must not nec-
essarily be interpreted semantic biunique opposites in
our scenario.
In a next analysis we split the interactions by
the 3 scenarios. Comparing these resulting scenario-
dependent consistencies with the above overall con-
sistencies, results show only minor deviations. Hence,
the overall consistency does not seem to depend on
our scenario design in the first place, but rather re-
flects a general assessment reliability towards the de-
sired constructs.
4.3 UX and Information Savviness
In a next study, we analyze the dependency of the UX
assessments on the user characteristics of information
savviness. In order to do so, we clustered the partici-
pants based on their answers to our information savvi-
ness items IS1, IS2, IS3, IS4, applying a split by the
median of the ratings in order to generate a high infor-
mation savviness group and a low information savvi-
ness group on individual item level. Table 3 gives an
overview of resulting group counts. Note, if splitting
on basis of raw 5pt Likert scale item responses, the
resulting group sizes will not always be equally dis-
tributed, as the median value itself will be allocated
to either of the groups, imposing class imbalance. To
test for statistically significant differences in between
the expected values of these groups we apply the non-
parametric Mann-Whitney-U tests (p < 0.05), which
compares the group ranks to prove significance. Re-
sults show that this group membership imposes a sig-
nificant difference on the UX assessment, hence on
the common inter-group UX expectations towards the
chatbot interaction. In other words, depending on the
degree of information savviness, people perceive and
rate our UX concepts differently. Again, this finding
is true for all 3 scenarios.
As a main result, participants in the high informa-
tion savviness group give significantly higher ratings.
In more detail, when using IS1 as split item to sep-
arate the high vs. low groups, these significant dif-
ferences are found for the entire items set and on UX
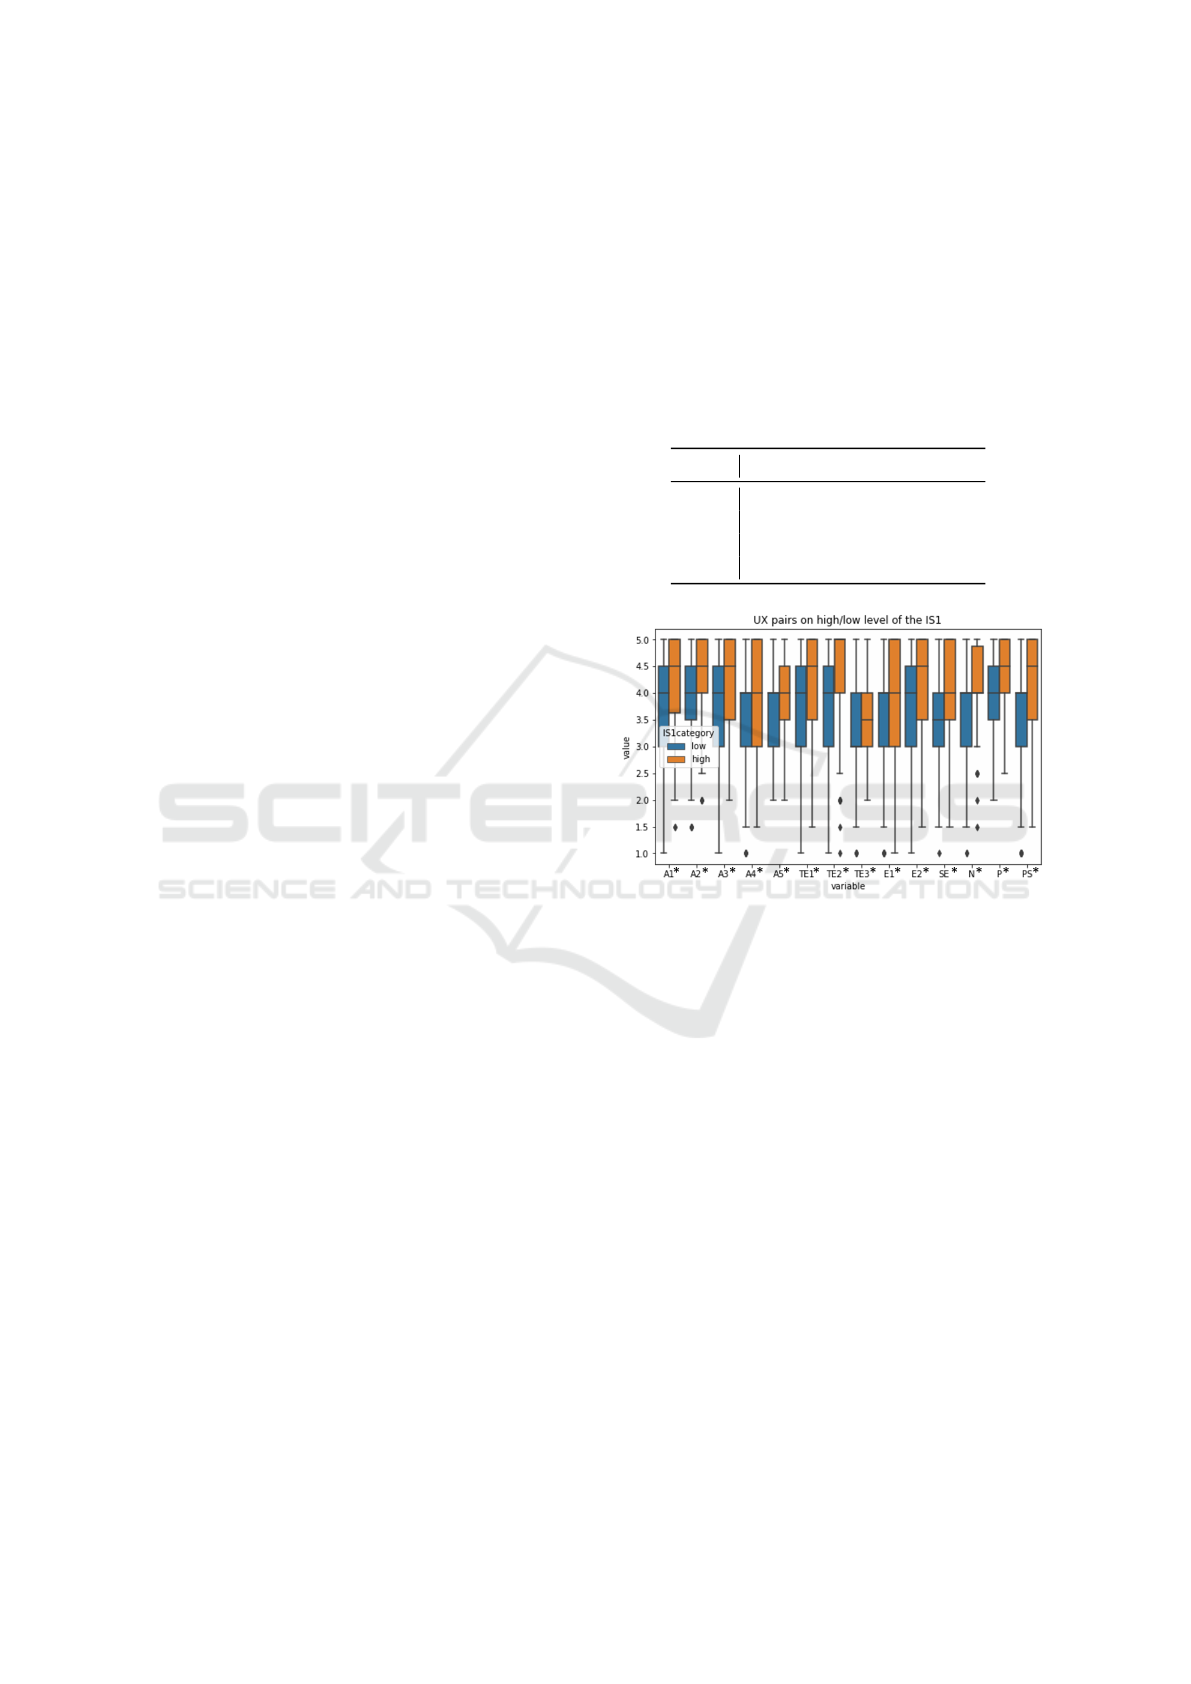
factor level. The results are visualized in Figure 1.
In more detail, concerning acceptability, high-
group participants, i.e. participants who stated them-
selves to be more familiar with relevant technology
terms, judged the chatbot to be significantly more
helpful, less frustrating. They rated the interaction
to be significantly more efficient and less unpleasant,
while the course of the dialogue appeared to be signif-
icantly less bumpy, more smooth. These users rated
themselves significantly more satisfied with the chat-
bot than users in the low group.
Table 3: Number of participants grouped into high and low
information savviness groups, and the participants whose
ratings located in the median belong to the high group.
Items # high group # low group
IS1 211 78
IS2 106 183
IS3 196 93
IS4 230 59
Figure 1: Boxplot of UX pairs segmented by IS1 median
into high and low information savviness class membership.
The higher the value, the more positive the UX assessment,
with points illustrating outliers and “*” denoting significant
differences in between the groups.
Concerning system error, participants in the high
group felt themselves significantly better understood
by the chatbot. High-group participants gave signifi-
cantly higher task efficiency ratings, i.e. they judged
the answers and solutions proposed by the chatbot to
be significantly more clear, while for them misunder-
standings could be cleared more easily. They did not
expect more help from the system to solve their tasks
and found the system statistically better able to pro-
vide all relevant information for them, as participants
in the low group.
Participants in the high group also rated signifi-
cantly higher on ease of use items. They reported
to have obtained all information they needed easily
while knowing and understanding the (expected) be-
havior of the chatbot. Finally, also for naturalness and
personality, these participants judged the interaction
to be significantly more natural, more friendly, and
Towards Personalization by Information Savviness to Improve User Experience in Customer Service Chatbot Conversations
41

less impolitely. On our promoter score items, these
participants agreed significantly more to recommend
the chatbot to friends and customers.
When splitting users in to high and low groups
using the items IS2 and IS3, we largely observe
the same behaviour, while a small number of dif-
ferences reported above does not become significant
any longer but remain as a similar trend in the data,
namely A4, T E3, SE, E1. Consequently, when per-
sonalizing for people who report to feel proficient in
acknowledging and weighting the validity of different
information from different sources in the internet like
from Social Media, from Forums, or directly from
Customer Support, the above findings can be used to
derive adaptations for the presented UX factors and
items in order to generate a targeted respective im-
provement for them. Same holds true for people who
report to often search the internet about their prob-
lems for potential solutions also before contacting the
Customer Service.
Finally, when splitting by IS4, i.e. people who re-
ported to be oftentimes eager for further information
about related problems, solutions or products that in-
terests them, the factors A, T E, SE, and PS follow the
above findings, while factors E, N, and P do only mir-
ror the above findings in terms of trends, but not by
significance. However, for acceptability we see that
our proposed split does not re-produce the above re-
sults homogeneous for all items we have set up. Still,
A1, and A5 items support the above findings with sig-
nificance or clear trends, while for A2, A3 and A4 the
trend is not consistent. Eventually, this shows that our
proposed IS4 item does not lend itself to personalize
for all UX factors analyzed in this study equally well.
On UX factor level, i.e. when analyzing the individ-
ual item levels jointly, the above findings still prevail
also for IS4, as illustrated in Figure 2.
Ultimately, the proposed and analyzed items could
be proven to lend themselves for user segmentation in
such a consistent way, that the segments (in this study
we analyzed high and low groups as segments, but
there can be principally more than two groups along
the dimension of information savviness) UX percep-
tion can be directly improved by adaptation towards
the concepts incorporated in the items, e.g. interac-
tion functions and capabilities, dialog length, dialog
smoothness, amount of information presented, system
response clearness, recovering of mistakes and mis-
understandings, as well as the chatbot perceived ease
of use, personality and naturalness. In the end, the
users’ promoter scores and overall satisfaction was
shown to systematically vary along the proposed seg-
mentation as well.
Figure 2: Boxplot of UX pairs segmented by IS4 median
into high and low information savviness class membership.
The higher the value, the more positive the UX assessment,
with points illustrating outliers and “*” denoting significant
differences in between the groups.
5 INFORMATION SAVVINESS
AND UX PREDICTION
After having demonstrated that our proposed segmen-
tation by Information Savviness is beneficial for tar-
geted UX adaptations, the next question in line is cer-
tainly how to derive the segmentation automatically
from the user behavior, in this case the user utter-
ances. In order to provide preliminary results of feasi-
bility of our segmentation we conduct a classification
experiments exploiting the popular and freely avail-
able pre-trained BERT model method (Devlin et al.,
2018). We use the fast and efficient distilled ver-
sion of BERT, DistilBERT, which is a reduced BERT
model with 6 layers and 12 heads, still able to re-
taining 97% of its language understanding capabili-
ties (Sanh et al., 2019), comprised in the Transform-
ers library from Huggingface
3
.
Due to class imbalance we evaluate the model
performance by f1 metric. The input to the models
consists of concatenated user turns only, leaving sys-
tem response and any meta-information aside. Over-
all, our 299 users produced roughly 2300 user turns
in total. We stratified the log data into 70 : 15 : 15
in terms of train : val : test sets retaining original
class distribution in the splits. Models were fine-
tuned on the concatenated user data given the IS self-
assessments as individual labels, using fixed standard
hyper-parameter settings, i.e. learning rate 5e − 5,
warm-up steps 20, weight decay 0.01, batch size 4,
epochs 3. Results wrt. IS1, IS2, IS3, IS4 show f 1 =
0.39, 0.38, 0.41, and 0.45 respectively, meaning that
the automated classification of these segments from
3
https://huggingface.co/
HUCAPP 2022 - 6th International Conference on Human Computer Interaction Theory and Applications
42

the mere short user input present in this work requires
more research and modeling effort, which will be dis-
cussed in Section 7 and remains future work given the
scope of this paper.
As a second experiment we try to predict UX rat-
ings. We do this under the assumption or not of know-
ing the Information Savviness of the user. Thus, we
make use of the obtained self-assessments, i.e. when a
chatbot carrier would obtain this information directly
from the user, e.g. by having the bot asking for it,
by having the user to fill out a short form, a feedback
item, or by deriving the segment membership from
other CRM-related sources. Under this assumption,
we build models for the UX items A1, TE1 and T E2,
i.e. the helpfulness of the system (A1), the clearness
and scope (T E1), as well as the accuracy of the so-
lutions (T E2), We obtain promising preliminary re-
sults in predicting the actual UX assessments from
the user utterances, applying the introduced modeling
strategy. Again, these models predict whether a given
user is of high or low class membership wrt. the in-
dividual UX assessments and expectations. Table 4
presents our preliminary results of the evaluation. Al-
though we applied a minimal set-up in terms of data
preparation and model set-up, the results indicate that
some of the models have already started to learn first
insights into the user’s UX preferences and expecta-
tions, such as acceptability or task efficiency with the
help of our segmentation by information savviness. In
addition, it seems that the proposed segmentation of
Information Savviness leads to better automated UX
prediction scores.
To present an example, trying to predict if a user
would agree (high class) or disagree (low class to
the statement “This chatbot was helpful.”, i.e. a sub-
aspect of the acceptability factor used in this work,
results in a low f 1 of 0.41. However, given the car-
rier can obtain the information savviness member-
ship status by other means like outlined above, the
f 1 for the high class could be predicted with 0.65.
Similar results become visible when trying to predict
if a user would agree or disagree to our UX items
“I would have expect more help from the system.”
or “The chatbot provided the desired information.”.
For the first item, results improve from 0.45 for non-
differentiated information savviness to 0.60 for the
high class, i.e. if we start to differentiate high and
low class members of information savviness. For the
second item, prediction performance reaches 0.68 for
the low class. Future experiments will need to inquire
these preliminary findings in more detail. Eventually,
the positive effect of information savviness applica-
tion was found to be consistent through all the pre-
sented experiments and results.
Table 4: f 1 performance on prediction of UX assessments
(high vs. low range groups) using no information savviness
segmentation ( f 1
all
) and segmented users ( f 1
h
vs. f 1
l
) by
user-utterance fine-tuned DistilBERT models.
f 1
h
f 1
l
f 1
all
A1 0.65 0.46 0.41
T E1 0.60 0.49 0.45
T E2 0.54 0.68 0.57
6 CONCLUSION
We have designed and presented items to differentiate
users of a service chatbot in the technical customer
service domain along the dimension of information
savviness (IS). We have further designed and imple-
mented an item set on user experience (UX), captur-
ing some of the most prominent UX aspects like ac-
ceptability, task efficiency, system error, ease of use,
naturalness, personality, and a chatbot promoter score
in a robust way by incorporating consistency estima-
tions by pairing of inverse item formulations. We con-
ducted an empirical experiment including 299 users
interacting with a real customer service chatbot, re-
sulting in respective dialog chat logs capturing the in-
teraction, in addition to self-reported UX and IS as-
sessments of the users that we deploy as ground truth
in our analyzes and experiments. Segmenting users
into high and low IS class membership, we observe
a highly significant and consistent difference of the
users’ preferences and expectation captured by our
UX items towards the chatbot interaction, while un-
derlying UX item design proved to be of high consis-
tency. Analyses using different IS items as well as dif-
ferent interaction scenarios applied during the exper-
iments suggest preliminary generalizablity of these
findings within the explained experiment design.
Accordingly, high information savvy participants,
i.e. participants who stated themselves to be more
familiar with relevant technology terms, judged the
chatbot to be significantly more helpful, less frus-
trating. They rated the interaction to be significantly
more efficient and less unpleasant, less bumpy, more
smooth. These users rated themselves significantly
more satisfied with the chatbot than users in the low
group. Concerning system error, participants in the
high group felt themselves significantly better under-
stood by the chatbot. High information savvy group
participants gave significantly higher task efficiency
ratings, and did not expect more help from the sys-
tem. They also rated significantly higher on easy of
use and naturalness.
In a set of preliminary experiments on automated
Towards Personalization by Information Savviness to Improve User Experience in Customer Service Chatbot Conversations
43

prediction of high vs. low IS groups from the in-
teraction chat logs, our fine-tuned DistilBERT mod-
els failed to perform sufficiently well. Consequently,
on basis of the presented data and model architecture
the class membership of IS could not be predicted di-
rectly. However, when a chatbot carrier would ob-
tain this information directly from the user, e.g. by
having it asking for during the chatbot interaction, or
by having a user filling out a short form, a feedback
item, or by deriving the segment membership from
other sources like CRM-information, the application
of IS for user segmentation yields promising prelimi-
nary results in helping to predict the actual UX assess-
ments and expectations of users from their behaviour
in the interaction directly. For example, in another
preliminary experiment, the automated prediction of
high or low UX preferences with respect to the above
factors, could be improved by 59% relative reaching
an absolute level of f 1 measure performance of 0.65
for acceptability, and 0.68 for task efficiency. Ulti-
mately, the positive effect of IS conception and appli-
cation for user segmentation in the customer service
chatbot domain was found to be consistent through all
the presented experiments and results evaluated.
7 DISCUSSION AND OUTLOOK
7.1 Definitions and Applications
Depending on the application the definition of infor-
mation savviness may need to be narrowed down.
In the present study, we use information savviness
in the context of internet savviness. Other contexts
more specific to domain knowledge as well as system
characteristics may require more focused definitions.
Also, the assessed UX factors are high-level factors.
Individual systems may require a more specialized
design with respect to all of the items presented in this
work in order to assess application-specific aspects in
a targeted way, e.g. constructs like personality, may
be broken down into a rather large number of facets.
Moreover, our items are answered by self-
assessment. While this is commonly done for UX,
self-assessment of one’s own information savviness
may include a conscious or unconscious bias, due to
innate preferences or off-set self-perception.
On another level, the UX item pair A5 (“The dia-
logue was too short / too long”) may not be seen as se-
mantically strictly biuniquely inverted, since an inver-
sion of too short could as well be understood as just
fine or short enough. This could explain the low item
pair consistency. Also, the concepts of impoliteness
and friendliness in the UX item regarding personality
(The chatbot reacted in a friendly way / impolitely)
may not necessarily be interpreted as semantic biu-
nique opposites in our scenario. Hence, these items
should be revisited again in future work.
Finally, for follow-up assessments we propose to
raise the scale resolution from 5pt to 7pt in order to
provide more options and expansion space for posi-
tive expressions. Overall, the presented results mir-
ror the findings from Cao et al. (Cao et al., 2021),
where for a chatbot interaction a segmentation due to
the concept of self efficacy shows similar benefits.
7.2 Experimental Setup and Analysis
In this study we designed three example scenarios
in order to provide a certain variability in the sce-
nario tasks. A more comprehensive range of task-
based scenarios (potentially sub-grouped by type of
scenario) and a more comprehensive data collection
would be advisable in order to systematically further
verify these findings. Also, a certain range of scenar-
ios resembling the most frequently reported problems
in front of the chatbot would be desirable in order to
align scenario design with real world traffic and pulse
of concurrent problems.
As participants were free to choose wording and
interaction path, certain variability with respect to the
interaction path was included. Eventually, instructed
scenario-based testing may not always reflect the real
user behaviour, e.g. one participant stated in the qual-
itative feedback: “Because I was told what answer I
was looking for the interaction wasn’t successful, in
reality I would have tried the first option of installing
the rescue software.” Also the scenario definitions
and complexity level setups should be revisited and
improved in order to become even more clear in up-
coming studies, cf. results from the qualitative user
feedback presented in Sec. 4.1
When segmenting users into different levels of in-
formation savviness or UX rating group, we split the
users into two groups, namely low and high group
members, by median of the self-assessed items, due to
the observed non-normal distribution. Other binning
such as 3-fold grouping into low, middle and high, or
above would allow for an increased resolution when
it comes to insight generation from the results. With
respect to the potential need of executing a short on-
line assessment of information savviness of a user in
order to get the user score, we applied our analysis
and the respective splitting based on individual items.
Exceeding the present work, clustering on basis of all
4 segmentation items, e.g. using a k-means algorithm,
could help to identifying how many savviness groups
can be essentially found in the data. However, more
HUCAPP 2022 - 6th International Conference on Human Computer Interaction Theory and Applications
44

data would be desirable for such analyzes in order to
produce robust results.
Also, more profound qualitative analysis focus-
ing on the difference between low and high savviness
members in terms of conversational strategies and lin-
guistic cues would be of high interest. Qualitative
strategies may also be tested by means of socially-
aware automated conversational simulators such as
(Hillmann and Engelbrecht, 2015; Hillmann, 2017;
Jain et al., 2018).
Next, self-assessments are time and cost consum-
ing, as users need to be given time to explore a system
they are to assess. Collecting more data oftentimes
means collecting more labels. More efficient label-
ing schemes, e.g. executed in scalable crowdsourcing
environments, on the basis of already available chat
logs are desirable. First own preliminary experiments
on user experience assessment from chat logs show
promising results, as general user characteristics like
high or low information savviness group membership
can as well be assessed from a number of chat log
protocols a-posteriori without having to conduct on-
line user tests. Future work will focus on this aspect.
Furthermore, also modeling would certainly ben-
efit from more data availability. While in this study
we used DistilBERT models for item-specific fine-
tuning, other pre-trained models, e.g., RoBERTa and
XLnet, GPT, etc. might exert an influence on the clas-
sification performance. Hyper-parameters were kept
static during fine-tuning. Applying hyper-parameter
space exploration and advanced architectures for fine-
tuning passes may also lead to improved results. Also
including sequential modeling of subsequent steps
may improve the overall performance.
Finally, a crowdsourcing set-up does not offer the
same range of observation of participants as tradi-
tional laboratory experiments. While we executed a
pre-qualification quality control step and additionally
excluded inconsistent responders online during the in-
teraction, a throughout comparison of confounders on
either site for the chosen domain of technical cus-
tomer service chatbot interaction assessment is still
missing in the literature.
7.3 Information Inclusion
Beyond the concatenation of mere user input other
information such as system response, time stamps,
and meta-information can be integrated in modeling.
Also, the use of the additional conversational infor-
mation like system response delay and information
on prior dialog status may help to improve the per-
formance of the models. Exploiting inter-dependency
of individual information, training models in a multi-
task learning set-up or training individual adapters us-
ing adapter-fusion, cf. (Pfeiffer et al., 2020), in order
to make full joint use of the different information are
also future modeling strategies scheduled for further
extension of our experiments.
In some domains, where user express themselves
more verbosely, we seek to classify the user informa-
tion savviness level automatically, which may then be
an important information for application of label- or
classifyer chaining.
The goal of user adaptation or personalization is
to improve the user experiences. This includes acting
upon the classified user characteristics. The genera-
tion of a targeted response in order to meet a user-
specific expectation, which in turn leads to increased
UX, should remain in the focus. Ideally, any charac-
terization of users should be streamlined with action-
able adaptation and answer strategies. To serve all
users on average should mean to serve individual user
or user segments differently, e.g, through adaptation
means like providing more help-providing functions,
adjusting the level of information displayed, short-
ened or lengthened dialog, or the introduction of more
course-smoothing flow options.
In this work we analyzed the UX of a chatbot from
the customer service domain, which may be a rather
concise and short, fact-oriented dialog type. Cur-
rently prominent chatbot installations used by a large
companies exposing these bots to a large number of
consumers and users may have already imposed a bias
in general perception and expectation towards chat-
bot capabilities. Information savvy users may thus
be able to enjoy the interaction to a greater extend,
as they may be more proficient in serving the “right”
level of information and terminology to the bot. This
situation may differ in other areas of applications and
domains, such as medical chatbots, sales bots, order-
ing bots or information bots.
Finally, many more concepts segmenting users
exist, with the need to explore which concept suits
which domain and whether we can model the seg-
mentation well. Cao (Cao et al., 2021), to name an
example, found significant differences in the UX ex-
pectation of users of customer service chatbot systems
when segmenting toward the concept of self-efficacy,
which describes the desire to be seen as unique and
the innate urge and determination to claim that in
front of others. Violating such desires may result in
customers churn, so the priority to be able to serve
such dimensions of customer preferences in a targeted
way is expected rather high. Future work should in-
corporate a number of high priority customer prefer-
ences and attributes in order to jointly asses, model
and analyze its impact on user experience.
Towards Personalization by Information Savviness to Improve User Experience in Customer Service Chatbot Conversations
45

REFERENCES
Association, A. L. et al. (1989). American li-
brary association presidential committee
on information literacy. http://www. ala.
org/ala/acrl/acrlpubs/whitepapers/presidential.
htm.
Banchs, R. E. (2016). Expert-generated vs. crowd-sourced
annotations for evaluating chatting sessions at the turn
level. In WOCHAT: Second Work-shop on Chatbots
and Conversational Agent Technologies, IVA 2016.
Braccini, A. M. and Federici, T. (2013). A measurement
model for investigating digital natives and their organ-
isational behaviour.
Bruun, A. and Stage, J. (2015). New approaches to us-
ability evaluation in software development: Barefoot
and crowdsourcing. Journal of Systems and Software,
105:40–53.
Cao, Y., Sanchez Carmona, V. I., Liu, X., Hu, C., Iskender,
N., Beyer, A., M
¨
oller, S., and Polzehl, T. (2021). On
the impact of self-efficacy on assessment of user ex-
perience in customer service chatbot conversations. In
IWSDS 2021.
Deriu, J., Rodrigo, A., Otegi, A., Echegoyen, G., Rosset,
S., Agirre, E., and Cieliebak, M. (2021). Survey on
evaluation methods for dialogue systems. Artificial
Intelligence Review, 54(1):755–810.
Devlin, J., Chang, M.-W., Lee, K., and Toutanova, K.
(2018). Bert: Pre-training of deep bidirectional trans-
formers for language understanding. arXiv preprint
arXiv:1810.04805.
Finstad, K. (2010). The usability metric for user experience.
Interacting with Computers, 22(5):323–327.
Geyer, R. W. (2009). Developing the internet-savviness (is)
scale: Investigating the relationships between internet
use and academically talented middle school youth.
RMLE Online, 32(5):1–20.
Gomide, V. H., Valle, P. A., Ferreira, J. O., Barbosa, J. R.,
Da Rocha, A. F., and Barbosa, T. (2014). Affective
crowdsourcing applied to usability testing. Interna-
tional Journal of Computer Scienceand Information
Technologies, 5(1):575–579.
Hillmann, S. (2017). Simulation-Based Usability Evalua-
tion of Spoken and Multimodal Dialogue Systems. T-
Labs Series in Telecommunication Services. Springer
International Publishing, Cham.
Hillmann, S. and Engelbrecht, K.-P. (2015). Modelling
Goal Modifications in User Simulation. In Future
and Emerging Trends in Language Technology, vol-
ume 9577 of LNAI, pages 149–159, Sevilla, Spain.
Hoßfeld, T., Keimel, C., Hirth, M., Gardlo, B., Habigt,
J., Diepold, K., and Tran-Gia, P. (2013). Best prac-
tices for qoe crowdtesting: Qoe assessment with
crowdsourcing. IEEE Transactions on Multimedia,
16(2):541–558.
Iskender, N., Polzehl, T., and M
¨
oller, S. (2020a). Crowd-
sourcing versus the laboratory: towards crowd-based
linguistic text quality assessment of query-based ex-
tractive summarization. In Proc. of the Conference on
Digital Curation Technologies (Qurator 2020), pages
1–16. CEUR.
Iskender, N., Polzehl, T., and M
¨
oller, S. (2020b). Towards a
reliable and robust methodology for crowd-based sub-
jective quality assessment of query-based extractive
text summarization. In Proceedings of the 12th LREC,
pages 245–253. European Language Resources Asso-
ciation.
ISO (2010). Ergonomics of human system interaction-part
210: Human-centred design for interactive systems
(formerly known as 13407). Standard ISO DIS 9241-
210, International Organization for Standardization,
Switzerland.
ITU-T (2003). Subjective quality evaluation of telephone
services based on spoken dialogue systems. ITU-T
Rec. P.851, International Telecommunication Union,
Geneva.
Jain, A., Pecune, F., Matsuyama, Y., and Cassell, J. (2018).
A user simulator architecture for socially-aware con-
versational agents. IVA ’18, page 133–140, New
York, NY, USA. Association for Computing Machin-
ery.
Jurc
´
ıcek, F., Keizer, S., Gasic, M., Mairesse, F., Thomson,
B., Yu, K., and Young, S. (2011). Real user evaluation
of spoken dialogue systems using amazon mechanical
turk. pages 3061–3064.
Kittur, A., Chi, E., and Suh, B. (2008). Crowdsourcing for
usability: Using micro-task markets for rapid, remote,
and low-cost user measurements. Proc. CHI 2008.
Lai, A. (2016). The rise of the empowered customer. Tech-
nical report, Forrester Research, Inc., 60 Acorn Park
Drive, Cambridge, MA 02140 USA.
Law, E. L.-C., Roto, V., Hassenzahl, M., Vermeeren, A. P.,
and Kort, J. (2009). Understanding, scoping and defin-
ing user experience: a survey approach. In Proceed-
ings of the SIGCHI conference on human factors in
computing systems, pages 719–728.
Liu, D., Bias, R. G., Lease, M., and Kuipers, R. (2012).
Crowdsourcing for usability testing. Proceedings of
the American Society for Information Science and
Technology, 49(1):1–10.
M
¨
oller, S., Smeele, P., Boland, H., and Krebber, J. (2007).
Evaluating spoken dialogue systems according to de-
facto standards: A case study. Computer Speech &
Language, 21(1):26–53.
Nebeling, M., Speicher, M., and Norrie, M. C. (2013).
Crowdstudy: General toolkit for crowdsourced eval-
uation of web interfaces. In Proceedings of the 5th
ACM SIGCHI symposium on Engineering interactive
computing systems, pages 255–264.
Owen, T. (2003). Chartered institute of library and infor-
mation professionals. Encyclopedia of Library and
Information Science, 490:499.
Pfeiffer, J., Kamath, A., R
¨
uckl
´
e, A., Cho, K., and Gurevych,
I. (2020). Adapterfusion: Non-destructive task
composition for transfer learning. arXiv preprint
arXiv:2005.00247.
Polzehl, T. (2014). Personality in Speech - Assessment and
Automatic Classification. T-Labs Series in Telecom-
munication Services. Springer.
HUCAPP 2022 - 6th International Conference on Human Computer Interaction Theory and Applications
46

Quarteroni, S. and Manandhar, S. (2009). Designing an
interactive open-domain question answering system.
Natural Language Engineering, 15(1):73.
Reichheld, F. (2011). The ultimate question 2.0 (revised
and expanded edition): How net promoter companies
thrive in a customer-driven world. Harvard Business
Review Press.
Sanh, V., Debut, L., Chaumond, J., and Wolf, T. (2019).
Distilbert, a distilled version of bert: smaller, faster,
cheaper and lighter. arXiv preprint arXiv:1910.01108.
Yu, Z., Xu, Z., Black, A. W., and Rudnicky, A. (2016).
Chatbot evaluation and database expansion via crowd-
sourcing. In Proceedings of the chatbot workshop of
LREC, volume 63, page 102.
Towards Personalization by Information Savviness to Improve User Experience in Customer Service Chatbot Conversations
47
