
Contactless Measurement of Respiratory Volumes: A Calibration Free
Method based on Depth Information
Felix Wichum
1 a
, Jacqueline Hassel
2 b
, Christian Wiede
1 c
and Karsten Seidl
1,2 d
1
Fraunhofer IMS, 47057 Duisburg, Germany
2
Department of Electronic Components and Circuits, University of Duisburg-Essen, Duisburg, Germany
Keywords:
Depth Camera, Tidal Volume, Vital Capacity, Vital Parameter, Respiratory Parameter, Contactless
Measurement.
Abstract:
Measurements of respiratory volumes involve a great deal of effort, either by immobile equipment such as
bodyplethysmography or by consumables as with spirometers. Contactless measurement methods can remedy
this situation. In this paper, a depth camera is used to generate a contactless respiratory signal. A region of
interest is placed over the subject’s upper body and the distance-time curve of respiratory motion is recorded.
Via selected signal features and the use of an artificial neural network, we can show that this method is equal
to the use of conventional volume determination. From a comparison with a spirometer connected in parallel
as a reference, a mean error for tidal volume of −0.10 l and vital capacity of 0.09 l is obtained.
1 INTRODUCTION
Diseases of the respiratory system are responsible for
one in three deaths in the world (ERS White Book,
2012). For early diagnosis, doctors test the function-
ing of the lungs in pulmonary function tests. These
tests show changes regarding the compliance of the
lungs and constrictions in the respiratory tract. Such
constrictions become apparent as a result of diseases
such as asthma or chronic obstructive pulmonary dis-
ease (COPD). After a diagnosis, appropriate therapy
can thus be started at an early stage.
In clinical practice, spirometers and bodyplethys-
mographs are considered the gold standard for such
pulmonary function tests. In spirometry, the patient
breathes through a mouthpiece into the spirometer,
which measures the volume of air passing through
it (Moore, 2012). A nose clip prevents air volume
from escaping. Volume-time and flow-volume dia-
grams are calculated by integrating the volume flow
over time. In bodyplethysmography, the patient sits
in a closed glass chamber. Pressure changes in the
chamber are measured, as well as ordinary spirometry
in addition. The clear confines of the bodyplethysmo-
a
https://orcid.org/0000-0002-3586-2802
b
https://orcid.org/0000-0002-2368-9774
c
https://orcid.org/0000-0002-2511-4659
d
https://orcid.org/0000-0001-6197-5037
graph additionally allow assessment of the full lung
volume (Cri
´
ee et al., 2011).
Despite their advantages, both methods cannot be
used for all patients, as there are limitations due to the
nature and size of the devices on mobility. Also, a
high degree of patient cooperation is required. Non-
contact measurement techniques represent a new and
innovative approach to improving medical diagnos-
tics and therapy evaluation. In addition to easier han-
dling, optical methods are characterised by better hy-
giene and potentially reduced costs. No virus filters
need to be replaced and no consumables are required
when measuring patients.
For this reason, we propose a non-contact mea-
surement method for measuring respiratory parame-
ters based on a depth camera. While simpler res-
piratory parameters such as the respiratory rate can
already be measured with a simple RGB camera
(Wuerich et al., 2021), it requires depth information
of the chest movement to derive respiratory volumes.
In our work, we show a conceptual proof that with
suitable signal features and processing with artificial
neural networks, respiratory volumes can be deter-
mined calibration-free with a depth camera.
In this paper, we first present the state of the art in
the determination of non-contact respiratory parame-
ters in Section 2. In Section 3, we outline the methods
used to determine the respiration parameters. There-
fore, we explain the acquisition of our dataset with
150
Wichum, F., Hassel, J., Wiede, C. and Seidl, K.
Contactless Measurement of Respiratory Volumes: A Calibration Free Method based on Depth Information.
DOI: 10.5220/0010813300003123
In Proceedings of the 15th International Joint Conference on Biomedical Engineering Systems and Technologies (BIOSTEC 2022) - Volume 4: BIOSIGNALS, pages 150-158
ISBN: 978-989-758-552-4; ISSN: 2184-4305
Copyright
c
2022 by SCITEPRESS – Science and Technology Publications, Lda. All rights reserved

the hardware used in Section 4. This is followed by
the results in Section 5. The discussion is presented
in Section 6. We conclude with our findings and an
outlook on future developments in Section 7.
2 STATE OF THE ART
In addition to the conventional measurement methods
for measuring respiratory parameters using spirom-
eters or bodyplethysmographs, more and more non-
contact measurement methods have been developed
in recent years.
Approaches using an RGB camera relate to the
measurement of the respiration rate. Based on fa-
cial recognition, a region of interest is selected in the
thorax region of the subjects. Prominent points are
tracked over time via the optical flow. This is fol-
lowed by bandpass filtering of the trajectories and
artifact reduction by principal component analysis
(PCA). Finally, the respiratory rate is determined via
frequency analysis. Thereby the strongest signal in
the power spectral density is crucial. (Wuerich et al.,
2021)
The method by (Lim et al., 2014) includes a
Kinect camera. The respiration rate is determined
from the moving average of the depth information us-
ing a spline interpolation. This is extended in (Ostad-
abbas et al., 2016) by an automatic selection of the
region of interest on the chest area.
Using projected light patterns and an RGB cam-
era, it has been possible to infer deformations of the
thorax and thus changes in volume (de Boer et al.,
2010) (Bernal et al., 2014). More promising, how-
ever, is the direct acquisition of depth information via
depth cameras.
If one measures depth information of chest move-
ments, they do not correspond to real volume-time
curves. Therefore, a calibration in the form of a scal-
ing factor is needed to reflect the real volume changes.
One use for determining the scaling factor is to use
keypoints, which are automatically determined from
the curve, and linear regression as described in (Sharp
et al., 2017).
(Imano et al., 2020) use a Kinect camera to infer
respiratory volumes and respiration rates from depth
data. The determined tidal volumes thereby vary by
more than 10 % from a reference value. The approach
from (Soleimani et al., 2015) and (Soleimani et al.,
2017) is based on a complex upper body reconstruc-
tion procedure. Using a point cloud, the upper body is
3D-modulated and thus volume variations are calcu-
lated. Scaling factors are determined via torso move-
ments. Even though attempts to generalize the scal-
ing factor have been made already in this case, no
patient-specific data such as age, height and weight
are included.
The use of level-set segmentation-based volume
estimation leads to errors of almost 8 %. However,
the computational effort of almost 10 min for a sin-
gle measurement of 4 s alone also hinders a practical
application in this case. (Oh et al., 2019)
In this work, a method is proposed to determine
the scaling factor automatically and without calibra-
tion, thus indicating the respiration parameters. For
this purpose, extracted features from the signal and
additionally patient data are processed by an artifi-
cial neural network. This offers the possibility to
output the respiration parameters immediately after
a measurement. The possibilities of machine learn-
ing will be used in this work to specifically capture
the changes in signal quality and additionally include
patient information to thus automatically determine a
scaling factor for each measurement.
3 METHOD
The proposed method allows the separate measure-
ment of tidal volume and vital capacity based on the
data from a depth camera. The associated signal pro-
cessing is outlined below.
3.1 Overview
The measurement of normal breathing allows the de-
termination of tidal volume TV. Respectively, vi-
tal capacity VC can be measured via forced breath-
ing. For this reason, the methods presented here are
applied to both volumes. The general procedure is
shown in figure 1 and further elaborated in the fol-
lowing.
Our approach is based on using the data of a depth
camera. Subsequently, a region of interest (ROI) is
placed in the subjects’ upper body. After a back-
ground elimination, the depth values obtained are av-
eraged per frame in the ROI. A depth-time diagram
is created, which is then smoothed with a moving av-
erage. A reference measurement of a spirometer pro-
vides a volume-time diagram and the corresponding
reference volumes. To determine the respective respi-
ratory volumes V, a total of three methods are com-
pared:
• Direct Method. Via feature extraction of the pro-
cessed depth data and subsequent feature selec-
tion, an artificial neural network is trained and
then the hyperparameters are optimised. This re-
Contactless Measurement of Respiratory Volumes: A Calibration Free Method based on Depth Information
151
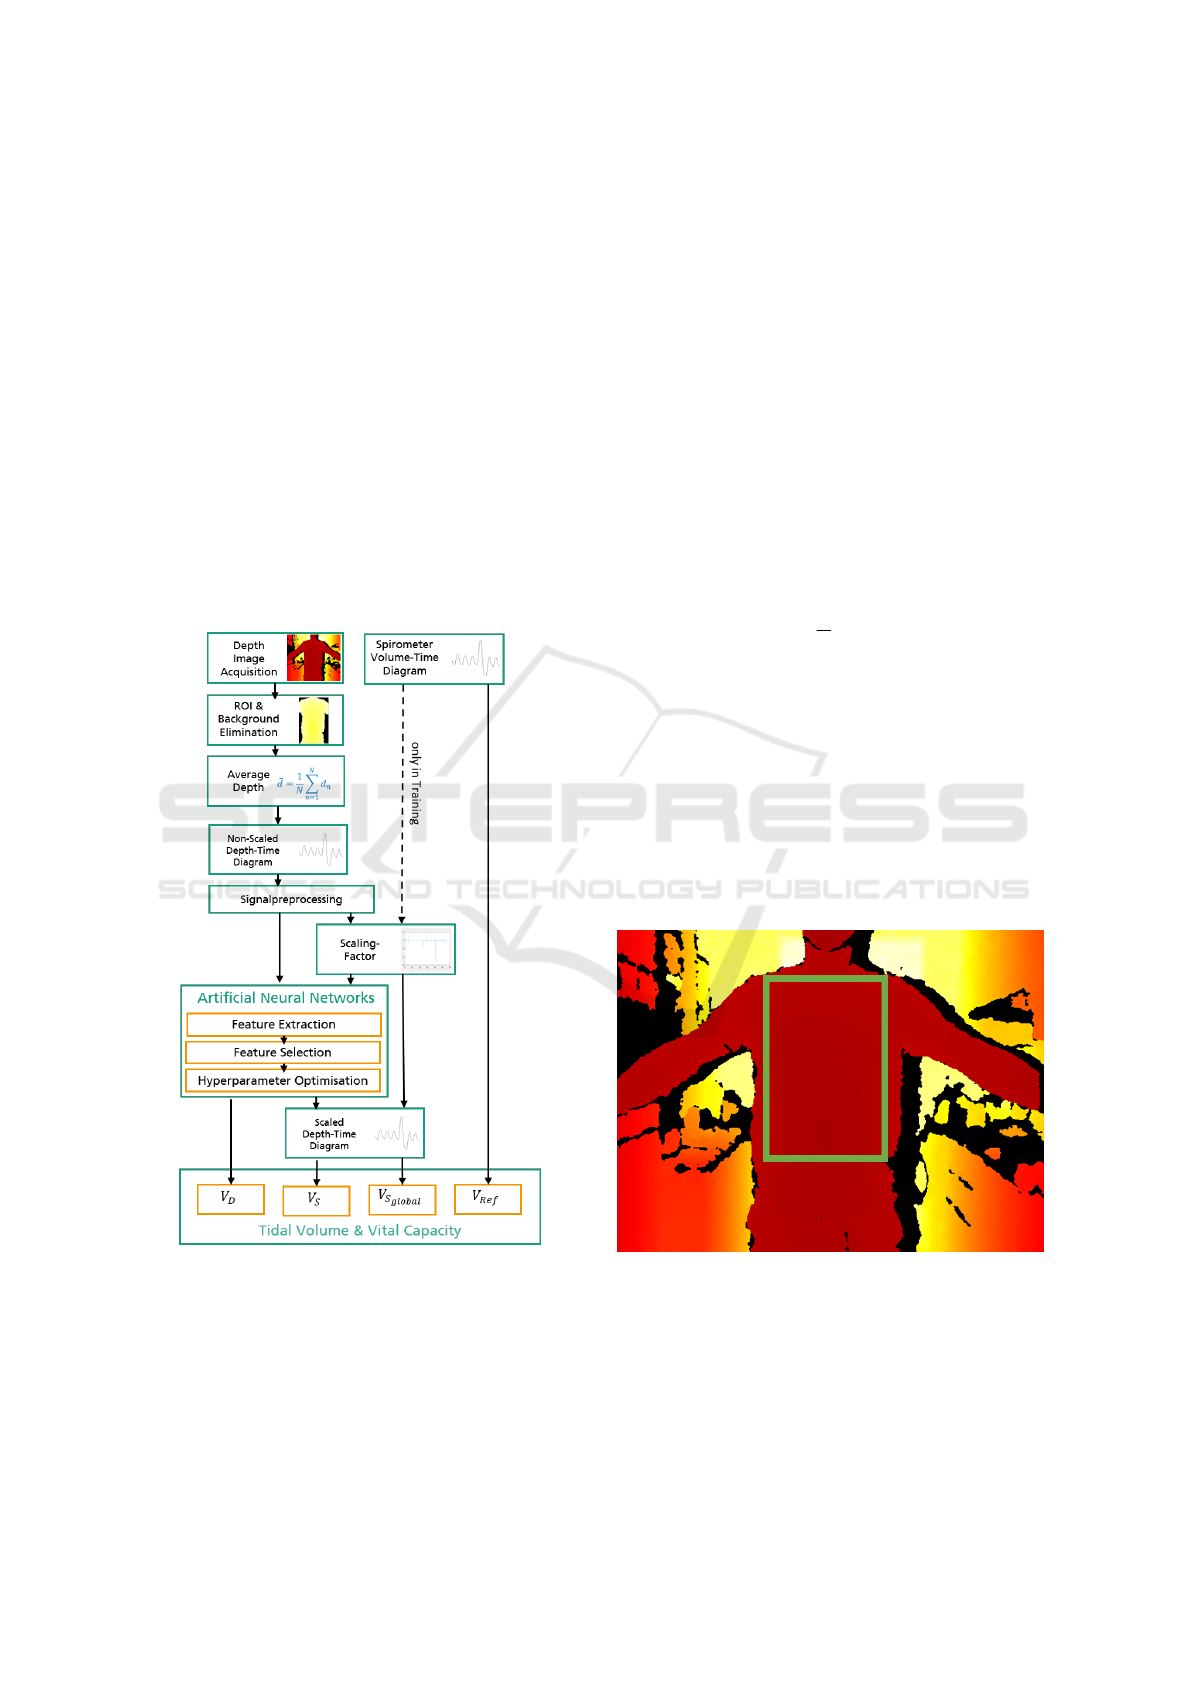
turns the corresponding volumes directly as out-
put: V
D
= {TV
D
, VC
D
}.
• Individual Scaling Factor Determination. The
extracted features are used together with the fea-
ture selection and subsequent hyperparameter op-
timisation as well. However, the neural network
outputs an individual scaling factor with which
the depth data can be mapped onto the volume
data. The volumes from the scaling factor method
can be extracted from the resulting volume-time
curve: V
S
= {TV
S
, VC
S
}.
• Application of the Global Scaling Factor. In
contrast, a conventional variant is tested in which
a scaling factor is derived as the mean value of all
calculated scaling factors from the training data
and then applied to the test data set. The volumes
extracted are V
S
global
= {TV
S
global
, VC
S
global
}.
Figure 1: Signal processing flow-chart. The volumes V re-
fer to the corresponding origins: V
Ref
as reference volume
of the spirometer, V
D
as direct calculation via artificial neu-
ral networks, V
S
as calculation via an individual scaling fac-
tor via artificial neural networks and V
S
Global
as result of the
application of a global scaling factor. In the training phase,
the optimal scaling factors are calculated with the spirome-
ter data.
3.2 Depth Data in Region of Interest
When recording depth information, only some image
regions contain the relevant parts of the body. A re-
gion of interest (ROI) is therefore manually selected
and considered afterwards, see figure 2. This ROI is
fixed in the recording. A rectangle is manually se-
lected, always positioned to encompass the chest and
abdominal area. The region extends from the clavi-
cles to below the belly button. The arms and sides are
not included.
To ensure that no background pixels are included,
all pixels with a distance d
n
>2 m are excluded. From
the remaining pixels, the mean value
¯
d is calculated
for each frame k according to equation 1. N is the
number of all pixels in the ROI within the specified
distance.
¯
d[k] =
1
N
N
∑
n=1
d
n
[k] (1)
A moving average with a window size of ten sam-
ples is applied to reduce overlapping body move-
ments. The resulting signal
¯
d
LP
is then mean-
centered, see equation 2. Thereby d
LP,mean
corre-
sponds to the average depth over all frames of this
filtered signal.
d[k] = d
LP,mean
−
¯
d
LP
[k] (2)
Thus, the signal pre-processing results in a single
depth information d for each frame k.
Figure 2: Selection of the Region of Interest (ROI). The
ROI is manually placed within the chest area and remains
there throughout the measurement.
3.3 Scaling of the Breathing Curve
The respiratory signal from the distance measurement
must be provided with a scaling factor in order to
BIOSIGNALS 2022 - 15th International Conference on Bio-inspired Systems and Signal Processing
152
determine the respiratory volumes from it. One ap-
proach of this work is to have this scaling factor es-
timated by artificial neural networks. The determina-
tion of the ground truth is described in this section.
Since the spirometer and depth camera cannot be
started synchronised, the start and end of the mea-
surement is done manually. In order to achieve
temporal synchronicity, the temporal displacement of
the signals is determined and trimmed using cross-
correlation.
The sample-wise scaling factor s is obtained by di-
viding the depth-distance and corresponding volume
V from the reference system for each sample k, see
equation 3.
s[k] =
d[k]
V [k]
(3)
The Median Absolute Deviation (MAD) is deter-
mined (see equation 4) and an outlier correction is ap-
plied. The outlier-corrected scaling factor s
MAD
is the
result of all the scaling factors within three times the
MAD.
MAD = median(|s[k] − median(s)|) (4)
The mean value from s
MAD
provides the scaling
factor S
c
for this measurement, see equation 5. M rep-
resents the number of all scaling factors (corresponds
to the number of frames) reduced by the number of
outliers.
S
k
=
1
M
M
∑
m=1
s
MAD
[m] (5)
Finally, S
global
denotes the mean of all measure-
ments C across all subject, see equation 6.
S
global
=
1
K
K
∑
k=1
S
k
(6)
3.4 Feature Extraction
Essentially, the respiration volumes can be deter-
mined in two ways. First, by applying the global
scaling factor S
global
to the depth signal. Second, by
machine learning methods (individual scaling factor
determination and direct volume extraction). For ma-
chine learning methods, features extracted from the
pre-processed depth signal are used.
The points A
1
, A
2
, A
3
, B
1
, B
2
, B
3
as well as C and
D, which represent the local extreme points of the res-
piratory signal, are referred to as keypoints and are
shown in Figure 3. The respective distance as well as
the temporal information of these keypoints are fea-
tures for the further steps. Since no scaling factor has
been applied yet, the unit of these quantities is still
in mm. Therefore, the indexing is performed with
dist for distance. In addition, the mean tidal volume
TV
dist
and the vital capacity VC
dist
are calculated, see
equation 7 and equation 8 respectively. The enclosed
breathing curve area is another feature.
TV
dist
=
1
3
3
∑
i=1
A
i
− B
i
(7)
VC
dist
= C − D (8)
Other characteristics are mean, standard deviation
σ and skewness of the distribution. The standard de-
viation results from equation 9 as follows:
σ = +
s
1
K
K
∑
k=1
d[k]
2
(9)
The skewness h is defined according to equation
10, where K corresponds to the number of all frames.
h =
1
K
∑
K
k=1
d[k]
3
q
1
K
∑
K
k=1
d[k]
2
3
(10)
Between the keypoints, the slope in the turning
points (Slope
i
) is calculated in each case. For this
purpose, the first three derivatives of the signal are
calculated. In addition, the distances are determined
in the range of 2 samples before and after the respec-
tive maxima. This is to ensure that the environment
Figure 3: Distinctive keypoints of the signal. Global max-
ima are marked A for tidal volume and C for vital capacity.
Global minima are marked B for tidal volume and D for
vital capacity.
Contactless Measurement of Respiratory Volumes: A Calibration Free Method based on Depth Information
153
and thus noise influences around the keypoints are de-
scribed. The points obtained in this way are named
with a + (-) in the index, for example A
i+
( A
i−
).
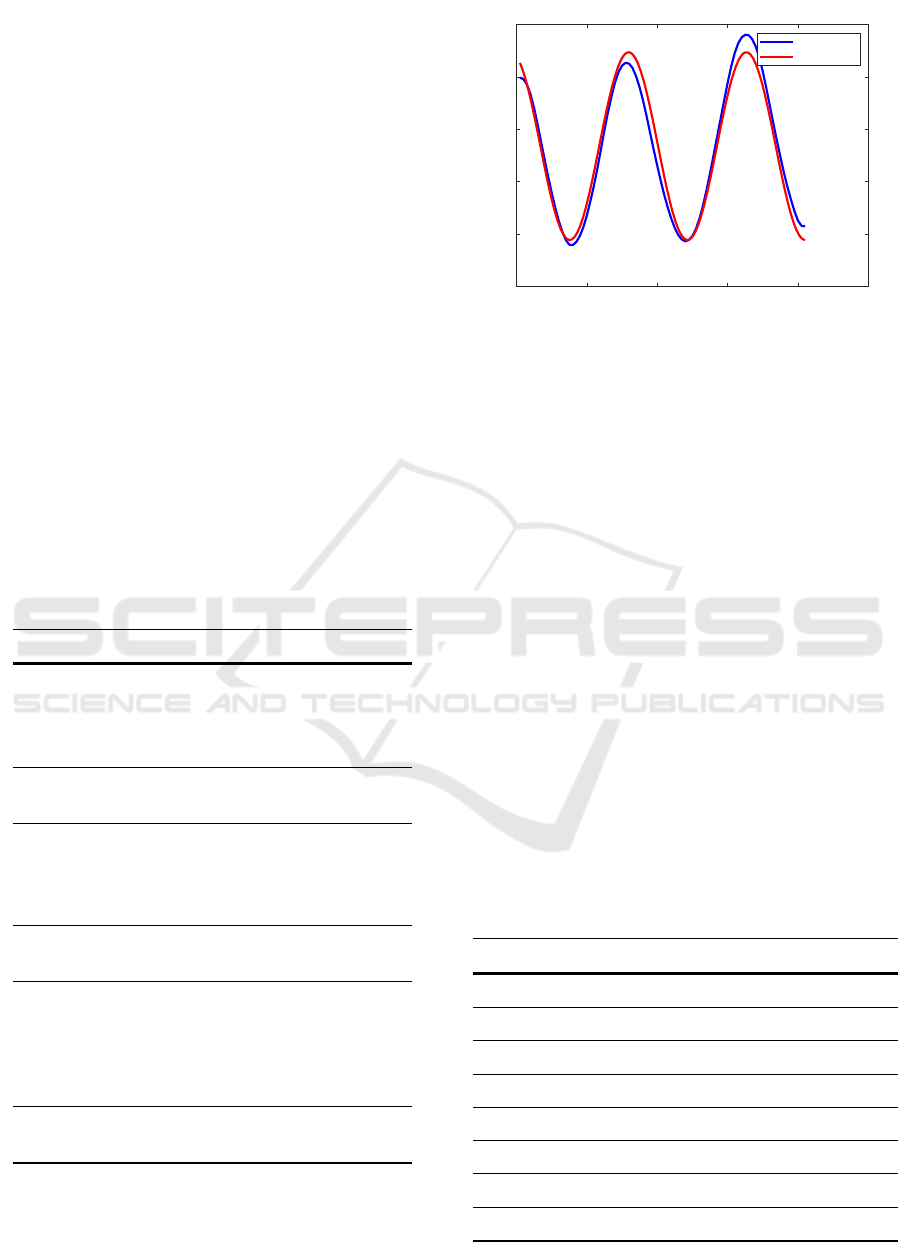
Other features result from a sinusoidal regression.
This involves fitting a sine function to the breathing
curve via least squares minimisation. The resulting
features are: range of values, period w, amplitude v,
mean value u and goodness of fit. The regression is
shown in figure 4. The sine function f[k] is repre-
sented in equation 11 with t representing a shift.
f [k] = u + v · sin(k · w +t) (11)
Furthermore, other characteristics of the subjects
are collected. This includes: age, gender, height and
weight of the subjects. Through these parameters, we
aim to find a general description of the subjects and
thus a connection with the breathing characteristics.
Thus, in summary, 43 features are obtained for the
sections of tidal volume and 27 features for vital ca-
pacity. The features are shown in table 1.
Table 1: Overview of features used for vital capacity and
tidal volume. Points A (C) denote the global maxima dur-
ing natural breathing (forced breathing), and points B (D)
denote the global minima, each with ascending index. A +
(−) indicates that the value is shifted by 2 samples to the
right (left).
Tidal volume Vital capacity
A
1
, A
2
, A
3
, B
1
, B
2
and B
3
with distance
and time respectively,
TV
dist
C and D with distance
and time respectively,
VC
dist
mean, standard devia-
tion and skewness
mean, standard devia-
tion and skewness
slope and distance of
turning point between
A
1
and B1, A
2
and B2,
A
3
and B3
slope and distance of
turning point between
C and D
A
1+
, A
1−
, A
2+
, A
2−
,
A
3+
, A
3−
C
+
, C
−
Range of values, pe-
riod, amplitude, mean
value and goodness of
fit (sinusoidal regres-
sion)
Range of values, pe-
riod, amplitude, mean
value and goodness of
fit (sinusoidal regres-
sion)
age, gender, height
and weight
age, gender, height
and weight
0 20 40 60 80 100
Samples
-4
-2
0
2
4
6
Depth [mm]
Sinus Regression
Mean depth
Fitted Sinus
Figure 4: Sinusoidal Regression. A sine function is fitted
into the depth signal via the least squares error. The param-
eters of the sine function serve as a feature for the further
processing steps.
3.5 Feature Selection
From this large number of features, a subset is se-
lected. This so-called feature selection has the follow-
ing advantages: faster training, reduced complexity of
the model and reduced overfitting.
A filtering approach was used to select the fea-
tures, evaluating the relationship between feature and
target value with a score. This evaluation is based on
the calculation of statistical F-tests, which enables a
ranking of the features via a score. Based on these
rankings, the eight highest-scoring features are se-
lected for each of the four neural networks. All se-
lected features are shown as an overview in table 2.
Table 2: Selected features through the filter approach. Point
A
2
denote the second global maxima during natural breath-
ing. A + indicates that the value is shifted by 2 samples to
the right. Features created by sinusoidal regression prefix
the names with Sin. Range refers to the range of values,
Ampl to the amplitude of the sine and Center to the mean
value.
TV
D
TV
S
VC
D
VC
S
height gender weight weight
TV
dist
weight gender height
weight height height gender
SinRange Slope
1
age age
Slope
5
Slope
4
Slope
2
SinRange
mean Slope
3
SinAmpl Slope
1
A
2+
TV
dist
TurnPoint
3
SinAmpl
Slope
1
Slope
2
SinCenter VC
dist
BIOSIGNALS 2022 - 15th International Conference on Bio-inspired Systems and Signal Processing
154
Weight and height of the subjects are among the
first three features in all rankings, reflecting the cor-
relation of these parameters with breathing volumes.
Eight times the slope in the turning point Slope
i
is
used as well. It is noticeable that in three out of four
approaches the specific volume over distance (TV
dist
or VC
dist
) was included as a feature. For the method
VC
D
, the sinus amplitude is represented as a feature
instead, which also qualitatively describes this vol-
ume. Other features of the sine regression are fre-
quently (five times) used as features as well.
3.6 Neural Network Design
After the feature selection, the structure of the neural
networks is described in this section. For this work,
a feedforward network architecture with one hidden
layer each is used. A larger number of hidden layers
did not empirically lead to better results. The sigmoid
function serves as the activation function. The output
is determined by a linear output function.
Subsequently, a hyperparameter optimisation of
the number of neurons and the learning rate
is performed. The neural networks are trained
using Levenberg-Marquardt backpropagation, ran-
domly splitting the training and test datasets. As a
cost function for the search for the global minimum
during optimisation the mean square error is utilised.
This results in four different neural networks, see ta-
ble 3.
Table 3: Optimised artificial neural network (ANN) hyper-
parameters with a total of three layers.
ANN Neurons in
Hidden Layer
Learning Rate
TV
D
31 0.1
TV
S
10 0.1
VC
D
4 0.001
VC
S
2 0.01
4 EXPERIMENTAL SETUP
A self-created data set with a total of nine healthy
subjects was collected. The Astra Pro camera from
Orbecc was used to record the depth data. The Min-
iSpir, a mobile spirometer with its own turbines for
each subject, was used as a reference.
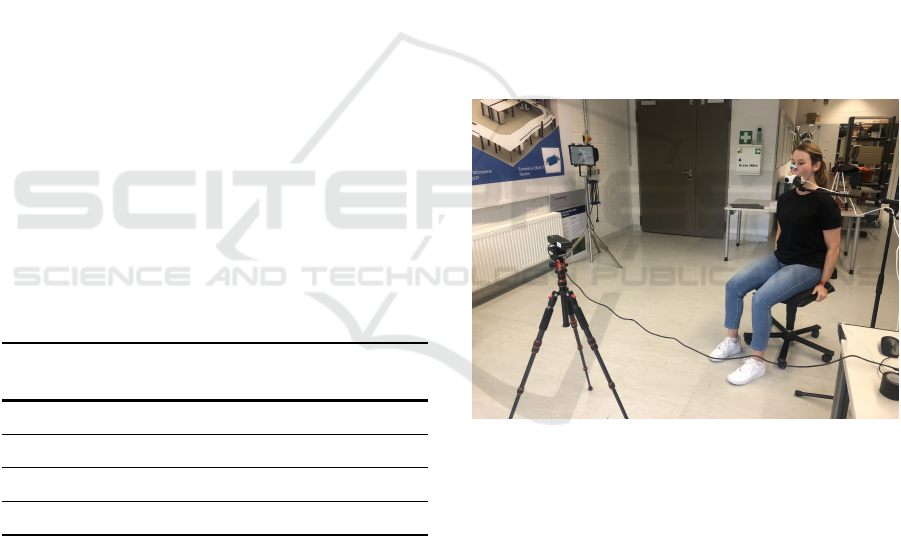
4.1 Test Procedure
During the measurements, the subjects’ upper body
was recorded frontally with the depth camera while a
spirometer simultaneously measured volume flow for
validation. For this purpose, the subjects were seated
on a chair at a distance of 1.0 m, 1.3 m or 1.6 m. This
encompasses an optimal range for comparable mea-
surements (Soleimani et al., 2017). The spirometer
is attached to a microphone stand so that the sub-
ject does not have to hold it and the arms hang down
by the upper body. Before starting the measurement,
the subject puts on a nose clip and completely sur-
rounds the spirometer with the mouth. The experi-
mental setup is shown in figure 5.
A total of 60 s of measurement is taken with a
camera frame rate of 30 fps. The probands breathed
naturally for three to four breaths until they inhaled
maximally and exhaled maximally. This breathing
manoeuvre was repeated twice in the 60 seconds. The
subjects were acoustically supported in breathing in
and out to the maximum by the study leader.
Figure 5: Setup of the experiment. The subject sits at a
defined distance in front of the depth camera and breathes
through a spirometer attached to a microphone stand. The
nose is closed with a nose clip.
4.2 Structure of the Dataset
The healthy nine subjects are divided into four fe-
male and five male participants. The average age
is (25.00±1.12)yrs. The average weight is (72.20±
15.14)kg and the height is (177.33±9.59)cm.
The two breathing manoeuvres are extracted from
the recorded data. Each breathing manoeuvre is then
further divided into two sections: three breaths in rest-
ing breathing and forced maximal breathing. The sub-
division is shown in figure 3 and is obtained as fol-
lows. Starting with a local maximum, the first three
breaths up to forced breathing are counted for tidal
Contactless Measurement of Respiratory Volumes: A Calibration Free Method based on Depth Information
155

volume. The signal section for vital capacity starts
with the global minimum and ends with and ends with
the next global maximum after complete inhalation
and exhalation.
In total, the recorded data set thus contains 43 sig-
nal segments, each for normal respiration (TV av-
erage (1.152 ± 0.617)l) and forced respiration (VC
average (4.452 ± 1.029)l). Another dataset contains
pure depth information of the subjects without refer-
ence values of a spirometer. The so-called free breath-
ing is intended to reveal potential influences of body
posture when using a spirometer as a reference mea-
surement device.
5 RESULTS
Due to the small size of the data set, 5-fold cross-
validation is used for TV and VC respectively. In
five runs, the data set is thus divided into 10 % test
data and 90 % training data. The cross-validation re-
duces the dependence of the results on the respective
data set. This is done for each of our four neural net-
works. The same split datasets for our ANN approach
are also used to test the approach of a global scaling
factor. This allows a better comparison.
5.1 Tidal Volume
The methods for determining the tidal volume are on
average all within a deviation of −0.09 l or more. The
tidal volume is thus underestimated in all tested meth-
ods, see table 4. The mean error is approximately
at the same level of −0.10 l. This does not apply to
the determination of the scaling factor and the sub-
sequent volume calculation. In this case, the devia-
tions from the reference value are larger. The larger
root mean square error (RMSE) indicates that there
are isolated larger deviations. TV
D
, with a value of
0.61 l, is above the errors of the other methods, which
have an RMSE of 0.45 l.
Table 4: Averaged results for determination of tidal volume
(TV) via five-fold cross-validation. Using neural networks,
a direct determination of the volumes (D) and a determina-
tion using the scaling factor (S). The results using a global
scaling factor (S
global
) are given for both data sets.
TV
D
TV
S
TV
S
global
,D
TV
S
global
,S
Mean
Error
−0.10 l −0.14 l −0.10 l −0.09 l
RMSE 0.61 l 0.46 l 0.45 l 0.45 l
Comparing the derivation of an individual scaling
factor with the application of a global scaling factor,
we find that the mean error with the machine learn-
ing approach is 0.05 l higher and the RMSE is 0.01 l
higher. The same comparison for the direct volume
calculation via artificial neural networks shows the
same mean error and a 0.16 l higher RMSE in con-
trast to the global scaling factor.
5.2 Vital Capacity
These results are reflected in the vital capacity as well,
see table 5. The direct calculation of the volume per-
forms better than a prior determination of the scaling
factor. Compared to the use of a global scaling fac-
tor over all measurements, the mean error is at the
same level. In contrast to the tidal volume, the RMSE
for the direct calculation of the vital capacity is lower
compared to the use of a global scaling factor.
The only method to overestimate the vital capac-
ity on average is the direct method. The deviation is
0.01 l smaller than the method with the global scal-
ing factor. The RMSE is 0.26 l lower than with the
conventional approach. The determination of the in-
dividual scaling factor increases the mean deviation
by more than double by 0.14 l compared to the global
scaling factor.
Table 5: Averaged results for determination of vital capacity
(VC) via five-fold cross-validation. Using neural networks,
a direct determination of the volumes (D) and a determina-
tion using the scaling factor (S). The results using a global
scaling factor (S
global
) are given for both data sets.
VC
D
VC
S
VC
S
global
,D
VC
S
global
,S
Mean
Error
0.09 l −0.24 l −0.10 l −0.10 l
RMSE 0.62 l 1.23 l 0.88 l 1.07 l
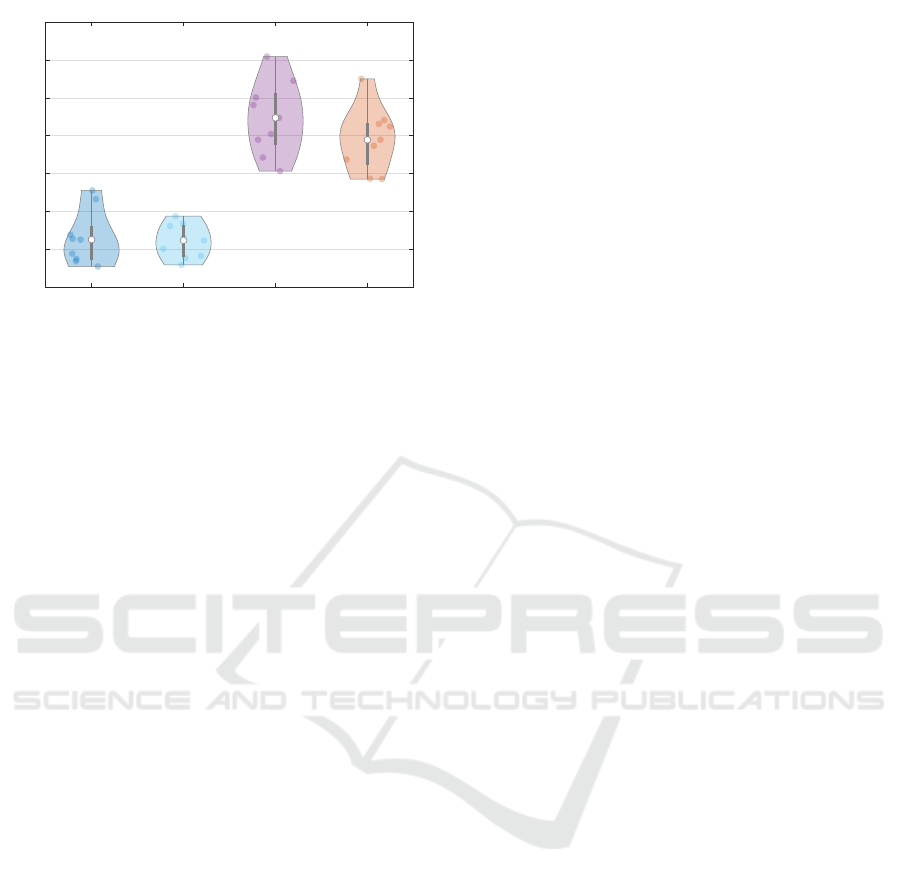
5.3 Free Breathing
To test whether the setup with spirometer has an in-
fluence on the body posture, another measurement of
the subjects without spirometer was performed. Since
no reference values are available, the volumes deter-
mined are compared with the previous reference vol-
umes, see figure 6. The determined volumes for free
respiration are within the previous reference values.
For the tidal volumes, there is a narrower distri-
bution of the determined measured values for free
breathing compared to the reference values. The vital
capacity also shows a slightly smaller spread in the
distribution. Thus, the measured volume values are in
the plausible range of the previous reference values.
BIOSIGNALS 2022 - 15th International Conference on Bio-inspired Systems and Signal Processing
156
TV Ground Truth TV Free VC Ground Truth VC Free
0
1
2
3
4
5
6
7
Volume [l]
Volume Comparison
Figure 6: Violin plot of free breathing and previous
recorded spirometer data (ground truth). For tidal volume
(TV) and vital capacity (VC), measurement results of our
direct method without a spirometer are compared with ref-
erence values. These reference values are taken from previ-
ous measurements with a spirometer.
6 DISCUSSION
The results presented in the previous section show
that measurements of respiratory volumes (tidal vol-
ume and vital capacity) without contact is possible
with the developed methods. On average, the artifi-
cial neural networks for direct volumes are equally
good as the use of a global scaling factor as an av-
erage over many subjects. The preceding calculation
of an individual scaling factor for each subject by an
ANN shows slightly larger deviations. Nevertheless,
this method has the advantage of being able to use the
complete distance-time diagram for the measurement
of further respiration parameters. Thus, dynamic pa-
rameters such as FEV1 can be determined in the fu-
ture.
It is noteworthy that for both tidal volume determi-
nation and vital capacity determination, the mean er-
rors are approximately at the same level. In contrast,
the RMSE for vital capacity increases. It is therefore
more difficult to determine the vital capacity correctly
than the tidal volume. A possible cause can be found
in the signal sections. Three breaths are available for
tidal volume determination, whereas only one breath
was taken with forced maximal breathing. This can-
not be avoided in future measurements due to patient
stress. Repeated strong breathing manoeuvres put a
lot of stress on patients if they are performed consec-
utively without a break.
The mean deviations of 0.10 l performs better
compared to (Imano et al., 2020). Especially for vi-
tal capacity, the method proposed in this paper has
a low percentage deviation. For further comparisons
regarding (Soleimani et al., 2017), a larger data set is
needed. In this context, our estimate of the individual
scaling factor serves as a first indication for the mea-
surement of further respiratory parameters. The trans-
ferability of the measurements to lung disease cases in
particular should be verified with additional subjects.
It should be examined whether lung diseases such as
COPD or asthma affect respiratory movements to the
extent that they influence the selected features for de-
termining the respiration rate via artificial neural net-
works.
The use of the algorithms in free breathing shows
that the measured results are plausible in comparison
to the previously determined reference values. Even if
there is a temporal offset and the effort of the test sub-
jects during breathing may have varied, it is still ev-
ident that the respiratory volumes can be determined
with this measurement setup and that there are no fur-
ther influences in, for example, the posture.
All of our subjects were normally clothed (t-shirt,
shirt, pullover) and measured at various distances. We
used an average of the depth information in the re-
gion of interest. Wrinkling or concealment of cloth-
ing could therefore also influence this value. We
aimed to reduce the influence by using artificial neu-
ral networks and features extracted for this purpose.
In the small dataset of nine subjects, the features
age, gender, height were taken very frequently. Even
though individual patient information was processed
with this, these features need to be retested in a larger
data set with more variance. Additionally, possible
influences of clothing can be addressed in the future
by splitting the ROI and collecting the previous pa-
rameters in different subregions. Texture features and
variance of the raw depth data can contribute further
information. Furthermore, it should be examined to
what extent the preprocessing of the signal has an in-
fluence on the subsequent results. With our mean fil-
tering, we may have neglected high frequency com-
ponents for a more comparable signal section.
7 CONCLUSIONS
In this study, we presented a non-contact, automatic,
and calibration-free approach to determine respiratory
volumes via a depth camera. This involves matching
the respiratory signal of the depth data to the respira-
tory volumes by a scaling factor. This scaling factor is
determined by processing suitable raw signal features
and patient data using an artificial neural network. We
thus achieve a mean error of −0.14 l for the tidal vol-
ume and −0.24 l for the vital capacity. Via a direct es-
timation of the respiratory volumes via artificial neu-
Contactless Measurement of Respiratory Volumes: A Calibration Free Method based on Depth Information
157

ral networks we obtain a mean error of −0.10 l and
0.09 l respectively. The method is so far equivalent to
the use of a global scaling factor.
In the future, we would like to further reduce the
error by using a larger data set and additional signal
features. The volume-time diagram can as well be
used to determine other respiration parameters. An
automatic selection and tracking of the region of in-
terest shall be implemented for a real world applica-
tion.
ACKNOWLEDGEMENTS
We would like to thank Dr. med. Sohrab for testing all
of our patients for health suitability and for advising
us from a medical perspective.
REFERENCES
Bernal, E. A., Mestha, L. K., and Shilla, E. (2014). Non
contact monitoring of respiratory function via depth
sensing. In 2014 IEEE-EMBS International Con-
ference on Biomedical and Health Informatics (BHI
2014), Piscataway, NJ. IEEE.
Cri
´
ee, C. P., Sorichter, S., Smith, H. J., Kardos, P., Mer-
get, R., Heise, D., Berdel, D., K
¨
ohler, D., Magnussen,
H., Marek, W., Mitfessel, H., Rasche, K., Rolke, M.,
Worth, H., and J
¨
orres, R. A. (2011). Body plethys-
mography – its principles and clinical use. Respira-
tory Medicine, 105(7):959–971.
de Boer, W., Lasenby, J., Cameron, J., Wareham, R., Ah-
mad, S., Roach, C., Hills, W., and Iles, R. (2010). Slp:
A zero-contact non-invasive method for pulmonary
function testing. In Labrosse, F., Zwiggelaar, R.,
Liu, Y., and Tiddeman, B., editors, Procedings of the
British Machine Vision Conference 2010, pages 85.1–
85.12. British Machine Vision Association.
ERS White Book (2012). The burden of lung disease.
Imano, W., Kameyama, K., Hollingdal, M., Refsgaard, J.,
Larsen, K., Topp, C., Kronborg, S. H., Gade, J. D., and
Dinesen, B. (2020). Non-contact respiratory measure-
ment using a depth camera for elderly people. Sensors,
20(23):6901.
Lim, S. H., Golkar, E., and Abd. Rahni, A. A. (2014).
Respiratory motion tracking using the kinect camera.
In 2014 IEEE Conference on Biomedical Engineering
and Sciences (IECBES), pages 797–800. IEEE.
Moore, V. C. (2012). Spirometry: step by step. Breathe,
8(3):232–240.
Oh, K., Shin, C. S., Kim, J., and Yoo, S. K. (2019). Level-
set segmentation-based respiratory volume estimation
using a depth camera. Ieee Journal of Biomedical and
Health Informatics, 23(4):1674–1682.
Ostadabbas, S., Sebkhi, N., Zhang, M., Rahim, S., Ander-
son, L. J., Lee, F. E.-H., and Ghovanloo, M. (2016).
A vision-based respiration monitoring system for pas-
sive airway resistance estimation. IEEE Transactions
on Biomedical Engineering, 63(9):1904–1913.
Sharp, C., Soleimani, V., Hannuna, S., Camplani, M.,
Damen, D., Viner, J., Mirmehdi, M., and Dodd, J. W.
(2017). Toward respiratory assessment using depth
measurements from a time-of-flight sensor. Frontiers
in Physiology, 8:65.
Soleimani, V., Mirmehdi, M., Damen, D., Dodd, J., Han-
nuna, S., Sharp, C., Camplani, M., and Viner, J.
(2017). Remote, depth-based lung function assess-
ment. IEEE Transactions on Biomedical Engineering,
64(8):1943–1958.
Soleimani, V., Mirmehdi, M., Damen, D., Hannuna, S.,
Camplani, M., Viner, J., and Dodd, J. (2015). Remote
pulmonary function testing using a depth sensor. In
2015 IEEE Biomedical Circuits and Systems Confer-
ence (BioCAS 2015), Piscataway, NJ. IEEE.
Wuerich, C., Wichum, F., Wiede, C., and Grabmaier, A.
(2021). Contactless optical respiration rate measure-
ment for a fast triage of sars-cov-2 patients in hospi-
tals. In Proceedings of the International Conference
on Image Processing and Vision Engineering, pages
29–35. SCITEPRESS - Science and Technology Pub-
lications.
BIOSIGNALS 2022 - 15th International Conference on Bio-inspired Systems and Signal Processing
158
