
Pima Indians Diabetes Database Processing through
EBBM-Optimized UTM Model
Luigi Lella
1
, Ignazio Licata
1
and Christian Pristipino
2
1
ISEM, Ins. For Scientific Methodology, PA, Italy
2
Interventional and Emergency Cardiology Unit, San Filippo Neri – ASL Roma 1, Rome, Italy
Keywords: Artificial Intelligence, Data Mining, Computational Optimization.
Abstract: A new predictive model tested on the Pima Indians Diabetes Database is presented. This model represents a
particular subclass of A-Type Unorganized Turing machine (UTM), where the state is unique. It appears as
a simple combinational network of NAND gates (it is not the more generic sequential type described by
Turing, but it is enough to solve the examined predictive task). The optimal architecture of this network is
identified by the use of evolutionary algorithms, which are therefore used as computational optimization
algorithms. In particular, a classic genetic algorithm and an hybrid evolutionary-swarm algorithm that we
have called Evolutionary Bait Balls Model (EBBM) were tested for this purpose. The predictive model thus
defined, made it possible to achieve higher performances than those obtained with other classic predictive
models. The final combinational network of NAND gates obtained through our model has allowed us to
identify a simple Boolean rule to determine the existence of the risk of incurring diabetes mellitus.
1 INTRODUCTION
Pima Indians Diabetes Database is provided by the
National Institute of Diabetes and Digestive and
Kidney Diseases (Pima Indians Diabetes Database,
2021) (Rossi and Ahmed, 2021) (Pima Indians
Diabetes on Rishabh Nimje Github section, 2021).
The goal of the dataset is to predict diagnostically
whether or not a patient may develop diabetes, based
on certain diagnostic measurements included in the
dataset. Several constraints have been placed on
selecting these instances from a larger database.
Notably, all patients here are women of at least 21
years of Pima Indian descent.
The considered variables to make diabetes risk
predictions are the following: number of pregnancies
(pn), plasma glucose concentration (pgc) at 2 hours
in an oral glucose tolerance test, diastolic blood
pressure in mm Hg (dbp), the thickness of the skin
fold of the triceps in mm (tsft), 2 hour serum insulin
in mu U / ml (si), body mass index (bmi) calculated
as (weight in kg) / ((height in m) ^ 2) , diabetes
pedigree function (dpf), age.
The diabetes pedigree function provides some
insight into the history of diabetes mellitus in
relatives and the genetic relationship of those
relatives to the patient. This measure of genetic
influence allows us to have an estimate of the
hereditary risk that could be had with the onset of
diabetes mellitus.
This work intends to present the results of the
experimentation on the Pima Indians Diabetes
Database of a single state A-type model of
Unorganized Turing Machine (UTM) (Turing,
1948), consisting of a combinational network of
NAND gates whose optimal configuration is
identified by evolving a population of chromosomes
each of which represents the coding of a UTM
configuration.
UTM is generated “in a unsystematic and
random way” from a set of two-input NAND gates.
Turing chose a NAND gate because every other
logical operations can be accomplished by a set of
NAND units. A Turing A-type unorganised machine
can be considered “a kind of Boolean neural
network without a layered structure, due to the fact
that recurrent connections are allowed with no
constraints” (Teuscher and Sanchez, 2000).
We used at first a genetic algorithm (GA)
(Mitchell, 1996) to determine the best A-type
network configuration. GAs are used to find high
quality solutions in optimization and search
problems by relying on bioinspired operators of
384
Lella, L., Licata, I. and Pristipino, C.
Pima Indians Diabetes Database Processing through EBBM-Optimized UTM Model.
DOI: 10.5220/0010806500003123
In Proceedings of the 15th International Joint Conference on Biomedical Engineering Systems and Technologies (BIOSTEC 2022) - Volume 5: HEALTHINF, pages 384-389
ISBN: 978-989-758-552-4; ISSN: 2184-4305
Copyright
c
2022 by SCITEPRESS – Science and Technology Publications, Lda. All rights reserved

natural selection like mutation, crossover and
selection.
Then a hybrid evolutionary-swarm algorithm
was experimented, that we called Evolutionary Bait
Balls Model (EBBM), where the chromosomes are
considered as individuals members of a swarm. Each
of them is capable of carrying out just three
elementary operations (repulsion from one's
neighbor, attraction towards another particularly
performing individual, orientation with respect to
one's neighbor). The evolution of this population
leads to the appearance of emergent behaviors (the
state in which a sort of bubble is formed in which
most individuals tend to orient themselves with
respect to their neighbors), manifesting a kind of
collective intelligence.
2 EBBM VS GA ALGORITHM
The first considered algorithm used to optimize the
configuration of the UTM network was a classic
model of genetic algorithm where elitism is also
used, that is, in each new generation the most
performing individual of the previous one is
preserved. Both the uniform crossover operator and
the mutation operator are used. First of all, with the
tournament selection strategy, the winners of two
tournaments involving 5 randomly chosen
individuals are identified. Their chromosomes are
crossed through uniform crossover (i.e. the
probability that the new individual acquires a gene
from parent i1 is exactly the same as that of
acquiring a gene from parent i2) corresponding to a
crossoverRate of 0.5. The new individual is subject
to mutation with probability equal to mutationRate.
Input: Array of individuals I to be
updated
Output: The position vectors (binary
vectors) of each individual in I will
be changed.
1: call function to alter the positions
of each individual
2: for all i ϵ I do
3: perform elitism;
4: i1 =
tournamentSelection(I,tournamentSize);
5: i2 =
tournamentSelection(I,tournamentSize);
6: perform crossover(i1,i2);
7: perform mutation(mutationRate);
8: end for
The original evolutionary model of the bait ball,
that inspired our EBBM, was developed by some
researchers who found that within the group of
fishes that try to escape from predators a
spontaneously generated nucleus constitutes what
they called "selfish herd" (Roberts, 2021) (Yang,
2018). This naming derives from the selfish herd
theory that individuals within the population attempt
to reduce their risk of predation by placing other
conspecifics between themselves and the predators.
Returning to the bait ball model, it is precisely this
"selfish" behavior adopted by individuals that leads
to the formation of the optimal collective
configuration. This configuration tends to persist
even when the inner core becomes less secure than
the outside. Paradoxically, the ball shape of the
group of individuals becomes even more regular in
these cases. On the other hand, by increasing the
level of insecurity of the center, the sphere
disintegrates and leads to the formation of many
groups of distinct individuals. Summarizing all these
are examples of optimal collective configurations
that emerge over time by defining simple rules that
individuals must respect, such as that of finding and
maintaining the safest position (or the one with the
highest fitness).
The EBBM ibrid evolutive-swarm algorithm,
that we tested as an alternative optimization
algorithm, was the following one.
Input: Array of individuals I to be
updated
Output: The position vectors (binary
vectors) of each individual in I will
be changed.
1: call function to alter the positions
of each individual
2: for all i ϵ I do
3: perform ZOR, ZOA, ZOO sets
calculations
4: if individual detected in ZOR then
5: perform repulsion (R)
6: else if individual detected in ZOO
then
7: perform orientation (O)
8: else if individual detected in ZOA
then
9: perform attraction (A)
10: end if
11: end for
Where ZOR is the Repulsion Zone: an individual
cannot occupy the position of another, that is, it
cannot be represented by the same binary vector. In
this case it assumes another position at random
(every single bit of the chromosome is changed with
Pima Indians Diabetes Database Processing through EBBM-Optimized UTM Model
385
probability repulsionRate). ZOA is the Zone of
Attraction: an individual tends to approach
individuals characterized by greater fitness (with
probability attractionRate each single bit of the
chromosome can assume the same value as the bit at
the same position of the best performing individual
in the ZOA set). ZOO is the Orientation Zone: an
individual tends to get closer, among the individuals
close to him, to the best performing one (with
probability orientationRate, every single bit of the
chromosome can assume the same value as the bit at
the same position of the best performing neighbor).
For each individual, to define ZOR, ZOA, ZOO sets
of other chromosomes, we introduced the
ZORrange, ZOArange and ZOOrange parameters
which represent the maximum number of different
bits between the considered chromosome and the
individual belonging to the chromosome ZOR, ZOA
and ZOO respectively.
3 TEST SET CODING CRITERIA
Pima Indian Diabetes Database (Pima Indians
Diabetes Database, 2021) (Rossi and Ahmed, 2021)
is a data set with 768 observations (i.e. 768 records)
and 9 variables. The target population consisted of
women who were at least 21 years old, of Pima
Indian heritage.
For testing purposes, we decided to code the
training set of our models, consisting of 60% of the
available data with the same distribution of variable
values, in a binary format, according to the criteria
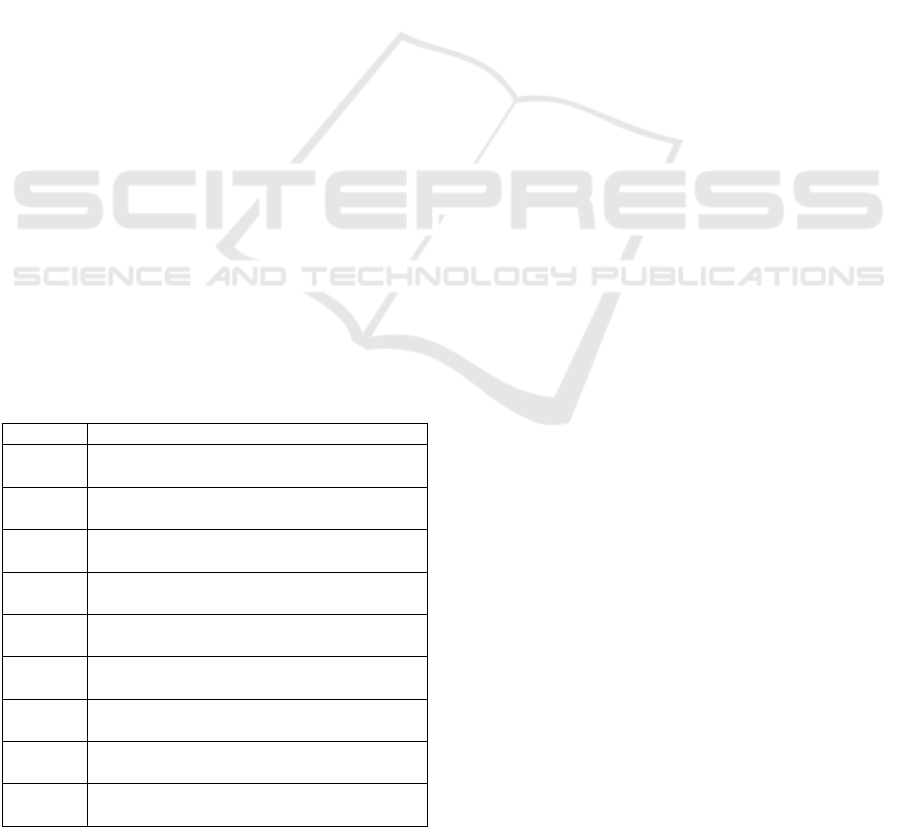
explained in table 1.
Table 1: Test set coding criteria.
Variable Coding Criteria
pn pn <= 5 code: 100; 6<= pn <= 10 code:
010;
p
n >= 11 code: 001
pgc pgc <= 103 code: 100; 104<= pgc <= 150
code: 010;
p
gc >= 151 code: 001
dbp dbp <= 52 code: 100; 53 <= dbp <= 80
code: 010; dbp >= 81 code: 001
tsft tsft <= 25 code: 100; 26 <= tsft <= 43 code:
010; tsft >= 44 code: 001
si si <= 291 code: 100; 292 <= si <= 568
code: 010; si >= 569 code: 001
bmi bmi <= 34 code: 100; 35 <= bmi <= 50
code: 010; bmi >= 51 code: 001
dpf dpf <= 776 code: 100; 777 <= dpf <= 1552
code: 010; d
p
f >= 1553 code: 001
age age <= 41 code: 100; 42 <= age <= 61
code: 010; a
g
e >= 62 code: 001
outcome risk of diabetes code: 1; no risk of diabetes
code: 0
In this way, the bit position is related to the
discretized value of the considered variable (that is
the discretized variable class), i.e. 100 stands for low
values of the considered variable, 010 stands for
medium values and 001 stands for high values. The
three intervals chosen for the discretization of each
variable where chosen subdividing the global
variation interval of the variable in three equal parts.
These bit sequences have been assembled to create
the encodings of the considered cases, which
consisted of 3*8+1=25 bits.
4 UTM MODELS TRAINING
Each possible UTM configuration, that corresponds to
a given chromosome, was also codified in a binary
form in the following way. The first 24 bits represent
all the choosable variables classes for the first input of
the NAND gates of the UTM model (first input
variable classes). For example a sequence starting
with “011 100 …” means that 6<= pn <= 10, pn >=
11, pgc <= 103 are chosen as possible input
conditions for input 1 of NAND gates. The following
24 bits represent all the choosable variables classes
for the second input of the NAND gates of the UTM
model (second input variable classes). The remaining
54 bits were used to codify the architecture of the 18
available NAND gates. Each NAND gate was
codified with three bits. If the value of the first bit is 1
the first input of the considered NAND gate is a first
input variable class, otherwise the first input is
connected with the output of the following NAND
gate. If the value of the second bit is 1 the second
input of the considered NAND gate is a second input
variable class, otherwise the first input is connected
with the output of another NAND gate. If the value of
the third bit is 1, this means that the inputs of the
considered NAND gates are short circuited and just
the first input has to be considered. In this way each
chromosome, representing a possible NAND network
configuration, is represented by 24+24+54=102 bits.
In order to represent a combinational NAND
network, when a chromosome is tested to evaluate
its fitness all the first input variable classes, all the
second input variable classes and all the 18 available
NAND gates are selected sequentially just one time.
The first NAND gate (NAND#1) of the 54 bits
sequence is the output gate of the network. If the
first bit of its code is 1, the input 1 of NAND#1 is
the first choosable first input class variable. If the
first bit of its code is 0, the input 1 of NAND#1 is
the output of NAND#2, whose code is represented
by the following three bits of the 54 bits sequence. If
HEALTHINF 2022 - 15th International Conference on Health Informatics
386
the second bit of NAND#1 code is 1, the input 2 of
NAND#1 is the first choosable second input class
variable. If the second bit of NAND#1 is 1, the input
2 of NAND#1 is the output of NAND#3, whose
code is represented by the third triplet of bits within
the 54 bits sequence.
In evolutionary algorithms (including the hybrid
one of EBBM) it is important to adequately choose
the fitness function associated with each
chromosome. The codified configuration of network
represented by the chromosome was tested with the
training dataset, extracted following the criteria
explained in section 2. The fitness score of the
chromosome is the count of all the cases where the
output of the corresponding combinational NAND
network equals to the real output of the case (that is
the value of the 9
th
variable of the test set).
A population of 50 chromosomes, represented by
randomly chosen sequences of 102 bits, was evolved
for 100000 generations.
The chosen values for GA parameters were the
following: tournamentSize = 5, crossoverRate = 0.5,
mutationRate = 0.015.
The chosen values for EBBM parameters were
the following: repulsionRate = 0.5, attractionRate =
0.1, orientationRate = 0.5, ZOArange = 100,
ZOOrange = 5, ZORrange = 0.
5 UTM MODELS TRAINING
Both GA-based and EBBM-based UTM models
were tested with the remaining 40% of the Pima
Indians Diabetes Database.
The performances of GA-based UTM and
EBBM-based UTM were compared with the
performances of other algorithms that were tested on
the same database (Pima Indians Diabetes on
Rishabh Nimje Github section, 2021). The test
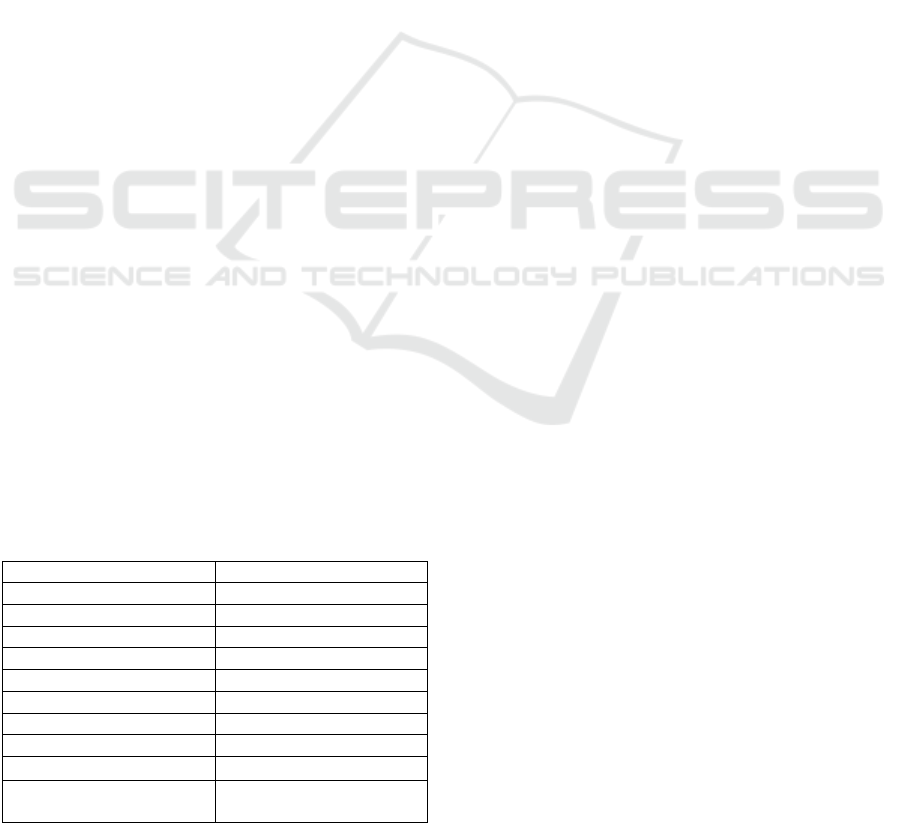
results are shown in table 2.
Table 2: Prediction accuracy of different tested models.
Model Prediction accurac
y
EBBM-
b
ased UTM 76.04%
GA-
b
ased UTM 75.91%
Su
pp
ort Vector Classifie
r
74.68%
Lo
g
istic Re
g
ression 73.38%
XG Boost 72.73%
Random Forest 71.43%
Naïve Bayes 71.43%
K Nearest Nei
g
hbo
r
70.78%
Decision Tree
70.13%
Stochastic Gradient
Descent
51.3%
Both GA-based and EBBM-based UTM models
performed better than the other ones, but the best
results in terms of prediction accuracy were reached
by the EBBM-based UTM model.
Following the principles suggested by (Minati
and Licata, 2012), we demonstrated that the
collective behavior of individuals defined by our
EBBM model develops emerging phenomena over
time (for example the units tend to orient themselves
with neighboring ones rather than repel each other or
approach the safest positions).
We considered as mesoscopic state variables the
attraction state (A), the orientation state (O); and the
repulsion state (R) of the individuals. These
mesoscopic state variables take as values the number
of individuals who assume the related state over
time. The mesoscopic state O demonstrate a certain
degree of ergodicity (0.98), which was computed
according to the following formula:
E
=1 / [ 1 + ( X
% - Y
% )
2
] (1)
Where Y
% is the average percentage of time
spent by a single individual in state O and X
% is
the average percentage of individuals lying in the
same state.
We further trained and tested the EBBM-based
UTM model by the use of a filtered dataset where
records with missing data, i.e. not executed
observations corresponding to a value equals to 0,
were not taken into consideration. The number of
records dropped from 768 to 392.
Using a subset of 60% filtered samples for
training and the remaining 40% filtered samples for
testing we reached an accuracy of 80,1%. We
obtained 78 true positives, 26 false positives, 236
true negatives and 52 false negatives corresponding
to a sensitivity equal to 60,00%, a specificity equal
to 90,08% and a prevalence equal to 33,16%.
The resulting most performing network
configuration is represented in figure 1. The
chromosome is splitted in three parts representing
the first input variable classes, the second input
variable classes and the 18 NAND gates represented
by 18 triplets. All the picked up first input variable
classes, second input variable classes and NAND
gates are underlined. The first triplet of the 18
NAND gates represents the output gate which is
NAND#1. The second triplet of the 18 NAND gates
represents the NAND#2, whose output is chosen as
the first input of NAND#1. The third triplet of the 18
NAND gates represents the NAND#3, whose output
is chosen as the second input of NAND#1. The first
input 1 variable class picked up by NAND#2 is the
class variable in the third position that is pn>=11.
Pima Indians Diabetes Database Processing through EBBM-Optimized UTM Model
387
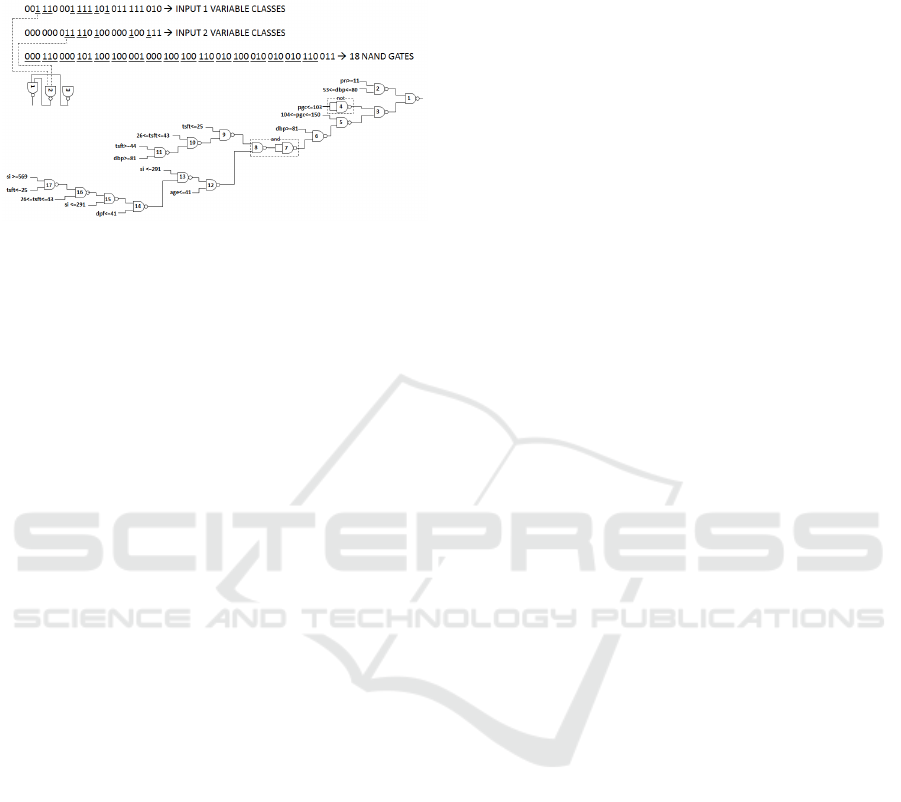
The first input 2 variable class picked up by
NAND#2 is the class variable in the eighth position
i.e. 53<=dbp<=80.
Figure 1: The best UTM combinational network
corresponding to the fittest chromosome.
This combinational network of NAND gates
corresponds to the following boolean rule:
IF(NOT(AND(NOT(AND(pn>=11;dbp>=53;dbp<=80));NOT(
AND(NOT(pgc<=103);NOT(AND(pgc>=104;pgc<=150;NOT(
AND(dbp>=81;AND(NOT(AND(tsft<=25;NOT(AND(tsft>=2
6;tsft<=43;NOT(AND(tsft>=44;dbp>=81))))));NOT(AN
D(NOT(AND(si<=291;NOT(AND(NOT(AND(NOT(AND(NOT(AN
D(si>=569;tsft<=25);tsft>=26;tsft<=43);si<=291);
dpf<=776);age<=41))))))))))))))))) THEN
OUTCOME=1
(2)
6 CONCLUSIONS
Nature has developed intelligent techniques to find a
solution to various types of problems, such as the
adaptation of species to environmental variations or
coordination between individuals operating within
populations. The study of these phenomena has
made it possible to develop intelligent systems
characterized by a high level of resilience (that is,
they still perform their function even in the presence
of local malfunctions) and adaptability to possible
changes in the environment in which they operate.
Genetic algorithms (Mitchell, 1996) (and
evolutionary computation in general) draw
inspiration from the theory of natural evolution
according to which individuals able to adapt better
to their environment (with greater fitness) live
longer and produce more offspring. Their genetic
heritage is recombined (crossover) and passed on to
offspring with small random variations (mutation).
In this way the positive characteristics of the
individuals are combined, but also limited elements
of novelty are introduced into the genetic heritage.
Swarm intelligence algorithms emulate the
behavior of individuals operating within a
population. Each individual belonging to any genus
and species present in nature seems to behave
following a series of elementary rules that lead to an
organized population behavior aimed at achieving
objectives (for example, identifying the most
favorable conditions for survival) (Bouffanais,
2016). The interesting aspect of these biological
systems is that these behaviors arise (emerge)
autonomously, without the presence of a
coordinator/ supervisor. The study of these
behavioral models leads to the development of
algorithms that belong to the class called "swarm
intelligence".
These considerations lead us to develop an
“hybrid” algorithm with characteristics that can be
associated with both evolutionary algorithms and
swarm intelligence algorithms. The EBBM
algorithm allowed us to train a combinational UTM
network which reached the highest performances in
predicting the outcomes of Pima Indians Diabetes
Database with respect to other prediction models.
This model can be used, within the healthcare
sector, not only to develop expert systems for
diagnostic support, but also to define useful
guidelines for the preventive medicine. This model
opens also new perspectives in the field of
personalized medicine (Lella et al., 2019), given its
capability to reach the highest prediction accuracies
and to explain the used criteria to human experts.
We are also going to implement, by the use of the
same EBBM algorithm for the optimization of the
architectural configuration, a sequential network of
NAND gates in order to explore the full potentials of
Turing's unorganized A-type machine model.
REFERENCES
Bouffanais R. (2016). A Biologically Inspired Approach to
Collective Behaviours. In Design and Control of
Swarm Dynamics, Springer Briefs in Complexity.
Lella L., Licata I., Minati G., Pristipino C., De Belvis A.G.
(2019). Predictive AI Models for the Personalized
Medicine. In Proceedings of the 12th International
Joint Conference on Biomedical Engineering Systems
and Technologies, pp. 396-401.
Minati G., Licata I. (2012). Meta-Structural properties in
Collective Behaviours. In International Journal of
General Systems, pp. 1-23.
Mitchell M. (1996). An Introduction to Genetic
Algorithms. Cambridge, MA: MIT Press.
Pima Indians Diabetes Database download page,
https://networkrepository.com/pima-indians-
diabetes.php , last accessed 2021/09/30.
Pima Indians Diabetes Database on Rishabh Nimje Github
section, https://risx3.github.io/pima-diabetes/, last
accessed 2021/09/30.
HEALTHINF 2022 - 15th International Conference on Health Informatics
388

Roberts T.J.: Dynamical and computational structures
under the sea: modelling of fish motion,
http://studentnet.cs.manchester.ac.uk/resources/library/
3rd-year-projects/2016/timothy.roberts-2.pdf , last
accessed 2021/09/30.
Rossi R., Ahmed N.: The Network Data Repository with
Interactive Graph Analytics and Visualization,
https://networkrepository.com, last accessed
2021/09/30.
Teuscher C., Sanchez E. (2000). A Revival of Turing’s
Forgotten Connectionist Ideas: Exploring
Unorganized Machines. In Proceedings of the 6th
Neural Computation and Psychology Workshop,
NCPW6, University of Lige.
Turing A. (1948). Intelligent Machinery. In Collected
Works of A.M. Turing: Mechanical Intelligence.
Edited by D.C. Ince. Elsevier Science Publishers,
1992.
Yang W. (2018). When the Selfish Herd is Unsafe in the
Middle. In: The 22nd Asia Pacific Symposium on
Intelligent and Evolutionary Systems.
Pima Indians Diabetes Database Processing through EBBM-Optimized UTM Model
389
