
Oil Spill Detection and Visualization from UAV Images using
Convolutional Neural Networks
Val
´
erio N. Rodrigues Junior
1
, Roberto J. M. Cavalcante
1
, Jo
˜
ao A. G. R. Almeida
1
, Tiago P. M. F
´
e
1
,
Ana C. M. Malhado
2
, Thales Vieira
1 a
and Krerley Oliveira
3 b
1
Institute of Computing, Federal University of Alagoas, Macei
´
o, AL, Brazil
2
Institute of Biological and Health Sciences, Federal University of Alagoas, Macei
´
o, AL, Brazil
3
Institute of Mathematics, Federal University of Alagoas, Macei
´
o, AL, Brazil
Keywords:
Oil Spill, Convolutional Neural Network, Deep Learning, Ummanned Aerial Vehicles, Geospatial Data
Analysis.
Abstract:
Marine oil spills may have devastating consequences for the environment, the economy, and society. The
2019 oil spill crisis along the northeast Brazilian coast required immediate actions to control and mitigate the
impacts of the pollution. In this paper, we propose an approach based on Deep Learning to efficiently inspect
beaches and assist response teams using UAV imagery through an inexpensive visual system. Images collected
by UAVs through an aerial survey are split and evaluated by a Convolutional Neural Network. The results are
then integrated into heatmaps, which are exploited to perform geospatial visual analysis. Experiments were
carried out to validate and evaluate the classifiers, achieving an accuracy of up to 93.6% and an F1 score of
78.6% for the top trained models. We also describe a case study to demonstrate that our approach can be used
in real-world situations.
1 INTRODUCTION
Marine oil spills are one of the highest profiles
and ecologically destructive polluting events with so-
cial and environmental consequences that can last
many years after the oil has been removed/dispersed
(Burger, 1997; Kingston, 2002).
For instance, the highly publicized 1989 spill of
oil from the Exxon Valdez into Prince William Sound,
Alaska was initially responsible for an enormous in-
crease in mortality followed by prolonged sub-lethal
effects that have led to the postponed recovery of
many species (Peterson et al., 2003). Likewise, a re-
cent review of the 2010 Deepwater Horizon oil spill
in the northern Gulf of Mexico (Beyer et al., 2016) re-
vealed a multiplicity of biological effects, with long-
term impacts on large fish species, deep-sea corals,
sea turtles, and cetaceans. Both the Exxon Valdez and
Deepwater Horizon spills had a clear point of origin in
time and space, with scientists able to closely monitor
the spread of oil and the consequences of the pollution
very soon after the spill had occurred.
a
https://orcid.org/0000-0001-7775-5258
b
https://orcid.org/0000-0002-7385-3114
This is very different from the recent (and still
mysterious) oil spill in Brazil whose origin and timing
are still unclear despite intensive investigation (Ma-
gris and Giarrizzo, 2020; Zacharias et al., 2021). The
first indication that a major oil spill had occurred off
the northeast coast of Brazil was the presence of large
quantities of oil on beaches in August/September
2019 (Soares et al., 2020). Up to March 2020 re-
ports of oiled areas were recorded in nearly 550 sites
spanning 3000 km of coastline, affecting up to 55 en-
vironmental protection areas (Ladle et al., 2020). A
study in Alagoas State indicates that fish and seafood
sales decreased by more than 50% strongly impact-
ing some of the most economically vulnerable com-
munities of the northeast region. Likewise, tourism
in the area was also dramatically affected (Ribeiro
et al., 2021). Preliminary data suggests that diverse
ecosystems were affected, including seagrasses (Ma-
galh
˜
aes et al., 2021), unique rhodolith beds (Sissini
et al., 2020) and reef-building corals (Miranda et al.,
2020). Soares et al. (Soares et al., 2020) identify four
characteristics that make this oil spill unique: 1) the
characteristics of the oil spill; 2) the characteristics
of the affected region in tropical Brazil; 3) the scale
of the disaster and; 4) the absence of measures and/or
Rodrigues Junior, V., Cavalcante, R., Almeida, J., Fé, T., Malhado, A., Vieira, T. and Oliveira, K.
Oil Spill Detection and Visualization from UAV Images using Convolutional Neural Networ ks.
DOI: 10.5220/0010802600003124
In Proceedings of the 17th International Joint Conference on Computer Vision, Imaging and Computer Graphics Theory and Applications (VISIGRAPP 2022) - Volume 5: VISAPP, pages
331-338
ISBN: 978-989-758-555-5; ISSN: 2184-4321
Copyright
c
2022 by SCITEPRESS – Science and Technology Publications, Lda. All rights reserved
331

flaws in the measures taken by the federal government
to address this environmental and social emergency.
One of the major challenges in the early stage
of such a disaster is to quickly collect accurate spa-
tiotemporal oil pollution data (Soares et al., 2020).
In this sense, Deep Learning (DL) approaches have
achieved outstanding results in object detection and
localization tasks during the last years (Redmon et al.,
2016; Ren et al., 2016; Massa et al., 2021). Specif-
ically, geospatial data analysis has greatly benefited
from Deep Learning algorithms to tasks such as crop
type detection (Kussul et al., 2017) and road extrac-
tion (Zhang et al., 2018), for instance. SAR remote
sensing has been proposed for microplastic pollution
in oceans (Davaasuren et al., 2018) and for marine
oil spill detection (Shaban et al., 2021). In particu-
lar, the latter study is focused on segmenting large oil
spills offshore using satellite images. In this work,
we tackle a different problem: detecting and localiz-
ing tiny oil spills that may be washing up on beaches
or inshore, using low cost unmanned aerial vehicles
(UAV’s).
A recent review (Fingas and Brown, 2018)
claimed that oil spill detection using the visible spec-
trum is challenging, limiting the use of UAV’s to per-
form such a task. More recently, Jiao et al. (Jiao et al.,
2019) proposed a DL method to inspect facilities us-
ing UAV imagery, based on the Faster R-CNN (Ren
et al., 2016). However, in that work oil spills’ appear-
ance, size and backgrounds are significantly different
than in the problem we address herein. Consequently,
we consider it a substantially different Computer Vi-
sion problem. We refer the reader to (Cazzato et al.,
2020) for a comprehensive presentation on computer
vision methods for UAV object detection.
In this paper, we propose a DL approach to assist
response teams in the cleaning of oil spills washing
up on beaches. In this situation, oil is usually scat-
tered in many small connected compounds, which are
found in a diversity of different backgrounds (sand,
water, seaweed,...), as shown in Figures 1 and 5b.
We exploit images acquired by low-cost UAVs to per-
form oil detection through an automated image anal-
ysis technique based on DL, achieving up to 93.6% of
accuracy and an F
1
score of 78.6%. We also validate
and evaluate our approach through a visual system
that combines satellite imagery and heatmaps of oil
density, to promptly and accurately notify response
teams, thus avoiding significant environmental im-
pacts.
The core of our approach is a Convolutional
Neural Network (CNN) classifier, whose architecture
was optimized to accurately recognize oil in small
patches. Differently from more advanced deep neu-
ral network architectures, we opt for a small archi-
tecture specially trained to identify small oil spills in
coastal land covers (i.e., floating on the water surface
or washing up on beaches). To integrate numerous
CNN predictions in a visual manner, we propose a
practical method to promptly and accurately notify re-
sponse teams, thus avoiding significant environmental
impacts.
Overall, our main contribution is to investigate
whether a low-cost DL classifier, jointly with a visual
interface, may provide quick, accurate and intuitive
georeferenced information about small oil spills lo-
cated on the beach or inshore, for rapid response pur-
poses. In particular, the whole approach relies only
on an inexpensive UAV and on a small neural network
architecture, which is trainable in a low-cost desktop
computer.
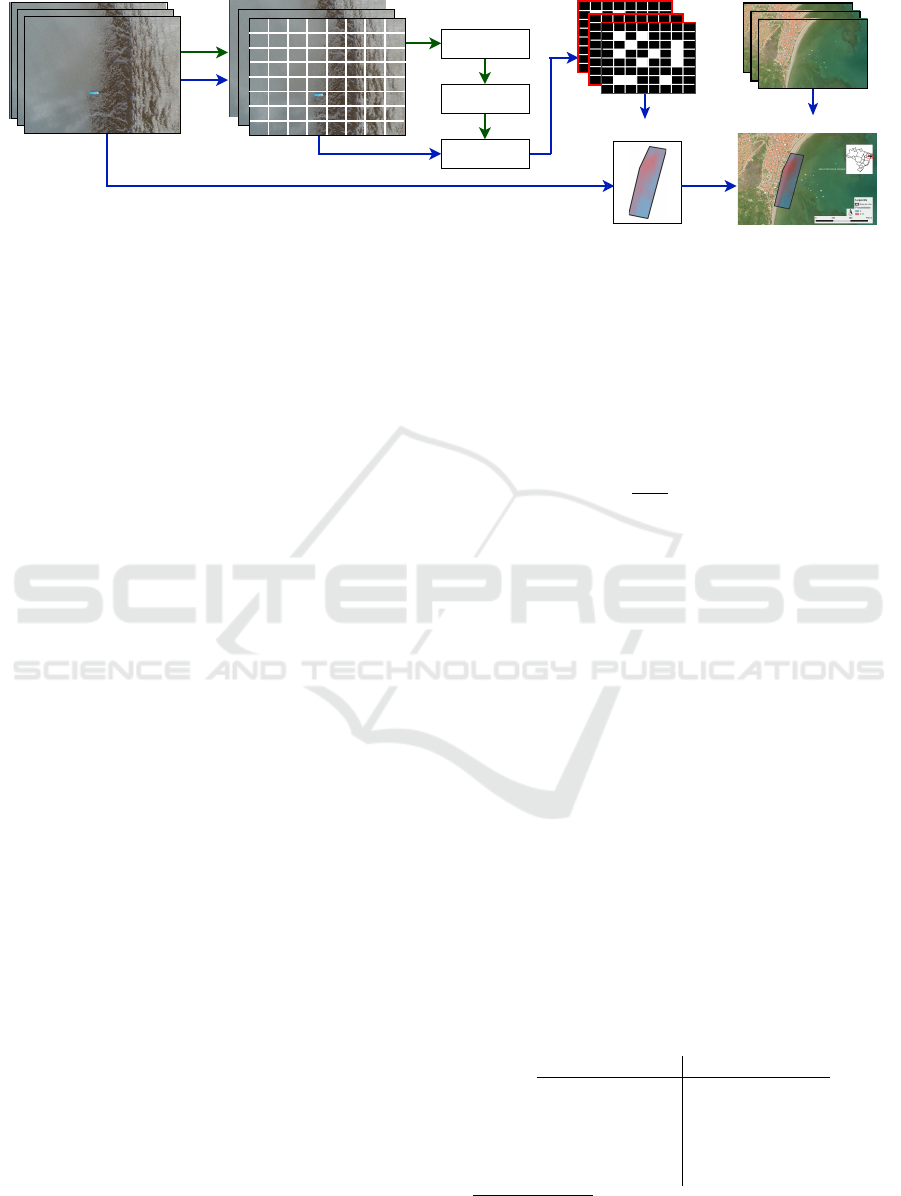
2 METHODOLOGY
Our approach is based on georeferenced RGB images
collected through an aerial survey, by using UAVs. As
illustrated in Figure 1, each image is first split into a
grid of small patches. In the training phase, patches
are manually annotated with a binary label indicating
the presence of oil. Next, the supervised dataset is
exploited to train a CNN binary classifier, which is
then expected to recognize oil from small patches. In
the detection phase, UAV images acquired through an
aerial survey are first split into patches that are eval-
uated by the CNN. The resulting predictions are or-
ganized in oil maps representing the occurrence of oil
in the region covered by each particular UAV image.
The oil maps are combined with the original UAV im-
ages geolocations to build a heatmap (Nogueira et al.,
2019) of the region covered in the aerial survey. Fi-
nally, the heatmap is superimposed over satellite im-
agery.
2.1 Imagery Acquisition, Preprocessing
and Annotation
Firstly, a UAV collects georeferenced RGB imagery
covering a region of interest, where oil may be po-
tentially found. Each collected image covers a region
that may contain superficial oil only in small subar-
eas. Thus, to provide precise locations of oil spills,
we propose to first split the captured images into small
squared patches before training a CNN classifier ca-
pable of providing patch-level oil spills detections.
To train the CNN binary classifier, a dataset com-
prised of many of the aforementioned patches must
be annotated by human trainers, in a binary fashion.
VISAPP 2022 - 17th International Conference on Computer Vision Theory and Applications
332
annotation
training set
CNN
Oil maps
Heatmap
Georeferenced UAV images Patches split Satellite imagery
Geospatial Visualization
Figure 1: Overview of our approach, with two distinct phases: training a CNN classifier from small RGB patches (green
arrows); and recognizing, localizing, and visualizing oil spots (blue arrows). As a common preprocessing step to both phases,
UAV’s georeferenced RGB imagery, acquired through an aerial survey, is split into small RGB patches.
In our experiments, we empirically concluded that
this may be accomplished visually, without relying on
prior oil spill geospatial information.
An appropriate patch size must satisfy both human
trainers, who must be capable of visually recognizing
oil in the patches; and the CNN classifier. In our ex-
periments, we empirically found that a CNN could
still achieve top results when each input patch was set
to 128 × 128 pixels. This patch size was also satis-
factory for the human annotation task. More specifi-
cally, we collected UAV images with spatial dimen-
sions of 4864 × 3648 pixels, which were split into
1064 patches with a size of 128 × 128 pixels. A thor-
ough investigation of optimal patch size parameters
may be conducted in future work.
2.2 Supervised Classification
We adopt a classical CNN architecture but performed
many experiments to tune hyperparameters. The in-
put patches are first filtered by C blocks of convo-
lutional layers with F filters of size K, followed by
max-pooling layers. Then, the resulting feature maps
are flattened and given as input to one or two dense
layers with D
1
and D
2
units each. The output layer
is made up of a single neuron with a sigmoid acti-
vation function, which outputs the probability of oil
occurrence in the input patch. The hyperparameter
search space is shown in Table 1 and the best classi-
fier found in our experiments is revealed in Figure 2.
More details on our experiments on hyperparameter
optimization will be given in Section 3.
2.3 Postprocessing and Visual
Geospatial Analysis
We propose to visually analyze the oil spill distribu-
tion in a specific area by computing heatmaps that in-
tegrate the outputs of the CNN classifier, and the geo-
coordinates of the images. Let I be an image, which
is split into a grid G
I
with m × n patches; and let
f
I
[i, j] ∈
{
0,1
}
be the binary CNN prediction of the
patch at the position [i, j] of G
I
. Note that f
I
is the oil
map of image I, as shown in Figure 1. We define the
density of oil in I, as the mean value of the oil map:
d
I
=
1
m · n
m
∑
i=1
n
∑
j=1
f
I
[i, j]. (1)
By combining information from many images col-
lected to cover a specific area of interest, we build a
polygonal heatmap by interpolating the densities d
I
using the geocoordinates g
I
of image I. To this aim,
we adopt the well-known Inverse Distance Weighting
(IDW). Finally, to perform visual geospatial analysis,
we employed the QGIS
1
system to plot the resulting
heatmap over satellite imagery of the area of interest.
3 EXPERIMENTS
We performed experiments to validate the whole ap-
proach, compare and optimize CNN hyperparameters,
and evaluate the best model performance. We also
present a case study to investigate whether the pro-
posed visual analysis system is appropriate to easily
reveal oil pollution patterns in the images.
With this aim, we collected a dataset from APA
Costa dos Corais – a coastal marine conservation unit
Table 1: Hyperparameter search space.
hyperparameter values
C 1, 2 or 3
F 16, 32 or 64
K 3 or 5
D
1
25, 50 or 100
D
2
0, 25, 50 or 100
1
https://qgis.org
Oil Spill Detection and Visualization from UAV Images using Convolutional Neural Networks
333
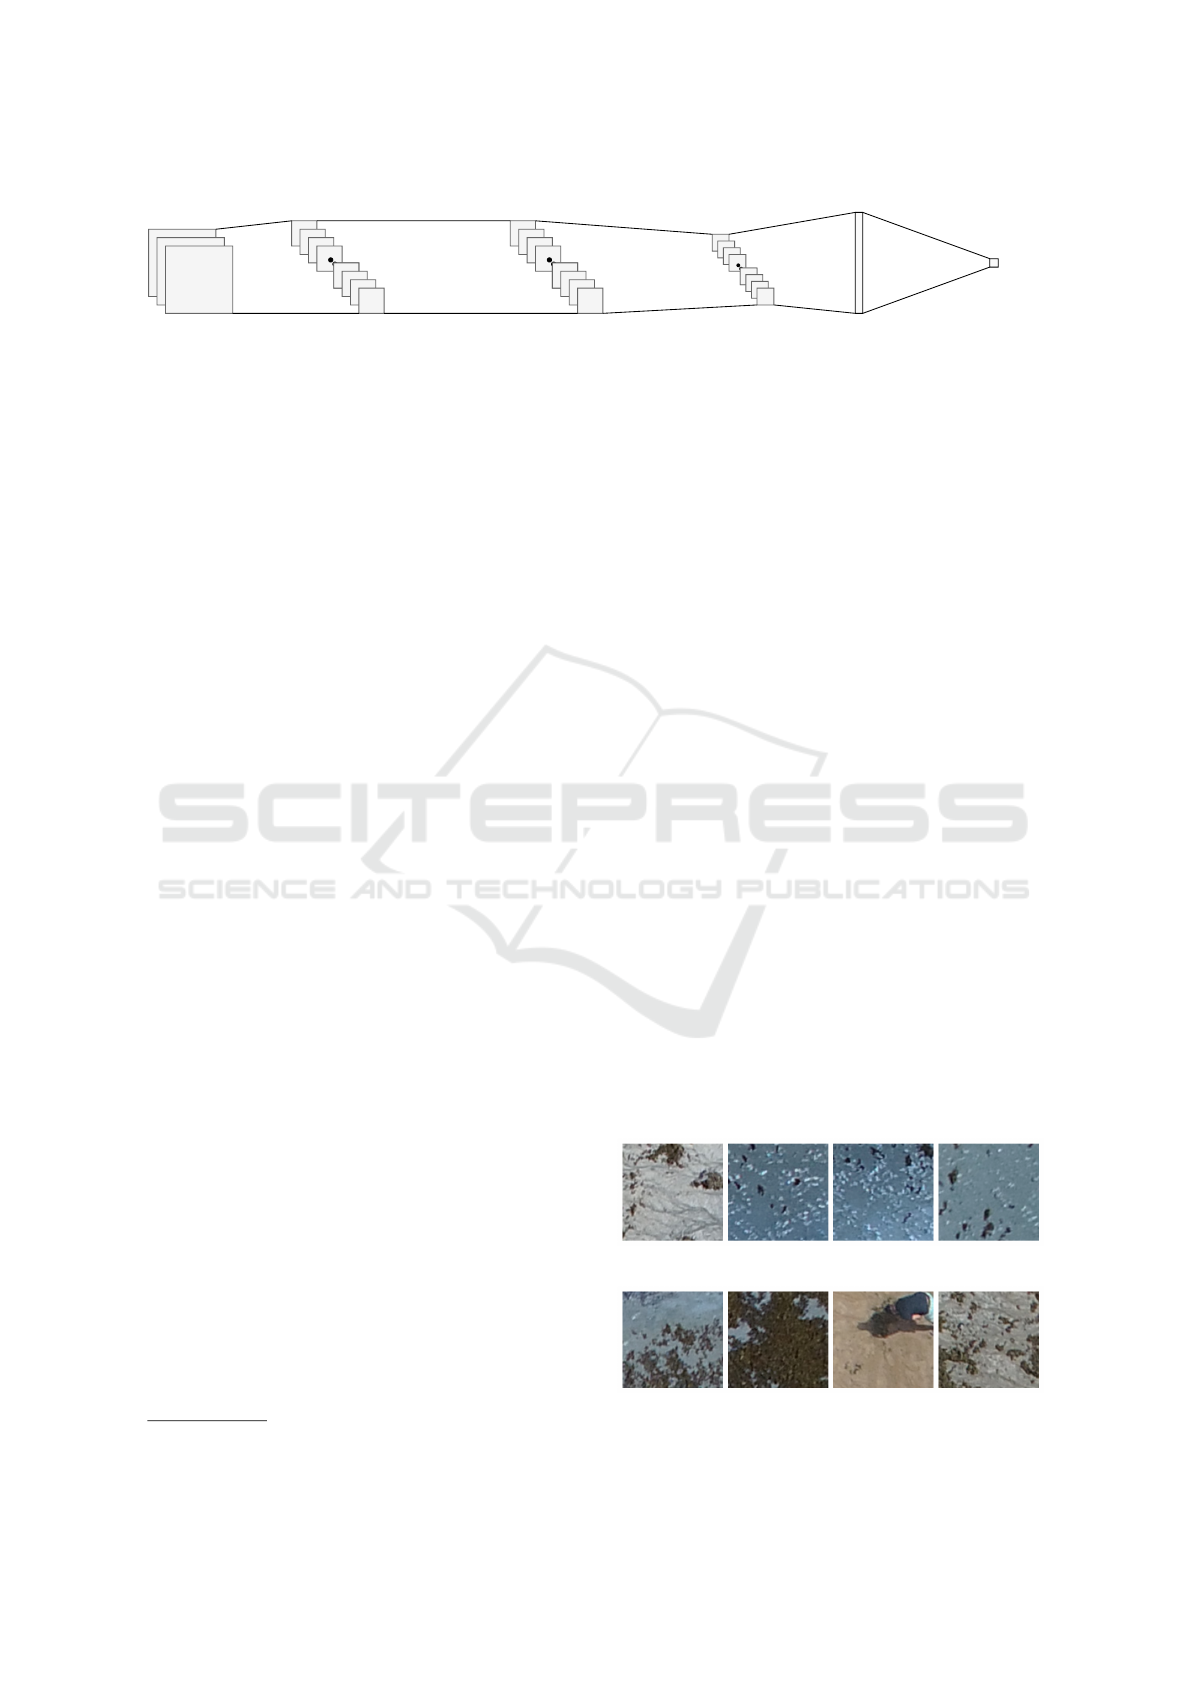
3@128x128
Input
Convolutional layer
32@128x128
Convolutional layer
32@64x64
Convolutional layer
32@32x32
Max-pool
Max-pool
Flatten
Dense
Output
50
1
Figure 2: Architecture of the top performing CNN.
located in the Brazilian states of Alagoas and Pernam-
buco. More specifically, data collection was carried
out in the municipality of Japaratinga, Alagoas, in the
peak phase of the crisis. A DJI Phantom 4 Advanced
drone and the Dronedeploy
2
tool were used. Four
flights were made, all at 60 meters high, collecting
vertical images with a resolution of 1.8 centimeters
per pixel and no filter. On average, each flight took
11 minutes and covered an area of roughly 70,000m
2
,
resulting in approximately 200 images. The paths of
the flights were planned to cover different types of ar-
eas including sand, seaweed, trees, seawater, and river
water. Each flight covered a disjoint region of inter-
est. Optimal flight hyperparameters, such as flight al-
titude, may be a topic of future research.
Some of the captured UAV images were manu-
ally chosen to compile a training set. Visual diver-
sity was considered the main selection criterion, to
assure that all types of covered areas were signifi-
cantly represented. To avoid erroneous annotations,
annotation redundancy (Puttemans et al., 2018) was
adopted: each patch was annotated by at least two
humans, and inconsistent annotations were then re-
vised by a third human annotator. The final training
set was comprised of 6,907 patches, which was split
into 5,180 negative samples (not containing oil) and
1,727 positive samples (containing oil).
3.1 CNN Validation and
Hyper-parameters Optimization
We performed a grid search over the hyperparame-
ter search space described in Section 2.2 and sum-
marized in Table 1. All possible combinations were
experimented with through a cross-validation proce-
dure by randomly splitting the dataset examples into
training and test sets, considering 75% of the patches
for training and 25% for testing, in a stratified man-
ner. This procedure was repeated 10 times, and the
average value was considered.
To train the networks, we adopted the Adam op-
timization algorithm (Kingma and Ba, 2014) of the
Keras library (Chollet et al., 2015), which was em-
ployed to minimize the well-known categorical cross-
2
https://www.dronedeploy.com
entropy loss with an initial learning rate of 0.001.
Class imbalance of the dataset was tackled by setting
each class weight to be inversely proportional to their
respective frequency. However, since false negatives
(patch containing oil, but not detected) are considered
more harmful than false positive results (patch does
not contain oil, but oil was detected) in this problem,
the positive class weight was doubled. To put it an-
other way, a false alarm would result in wasting re-
sponse personnel resources. Missing oil spills, how-
ever, is much more harmful, due to environmental im-
pacts.
Table 2 reveals the top 10 architectures, according
to their F
1
score. One can see promising results, with
many models achieving up to 93.59% of accuracy and
an F
1
score of 78.6%. By visually examining some
incorrectly predicted images shown in Figure 3, we
found challenging and unusual situations, including
very small oil spills hidden in seaweed; oil spills, re-
sembling shadows in the water; a person using a black
t-shirt, which looks similar to oil; and seaweed mixed
with small black dots, which is similar to previously
labeled small oil spills.
We also infer that, fortunately, the CNNs are not
much sensitive to hyperparameters values in terms of
accuracy: all top-performing networks achieved sim-
ilar accuracy, even though their number of trainable
weights varies greatly.
Nevertheless, this finding does not hold for the F
1
score, precision and recall, which are more suitable
measures since the dataset is imbalanced. Further-
more, a high recall is more relevant than a high pre-
(a) False negative patches.
(b) False positive patches.
Figure 3: Examples of incorrect predictions.
VISAPP 2022 - 17th International Conference on Computer Vision Theory and Applications
334

Table 2: Configuration, F
1
score, accuracy, precision, recall and number of trainable weights of the top 10 CNN configurations
and the compared methods, sorted by F
1
score. Best results in bold.
C F K D
1
D
2
F
1
acc. prec. rec. weights
(%) (%) (%) (%)
3 32 3 50 0 78.6 93.6 84.9 73.3 333,144
3 32 3 50 50 77.7 92.6 75.4 80.1 335,694
3 64 3 100 0 77.3 92.6 76.2 78.4 1,330,350
3 16 3 25 0 77.2 93.5 88.9 68.2 83,565
2 32 3 25 25 75.7 92.3 77.0 74.4 730,871
3 16 3 50 0 75.1 92.8 84.4 67.6 162,040
2 32 3 100 50 74.9 92.0 76.0 73.9 2,895,396
3 64 3 50 25 74.8 92.6 82.7 68.2 704,225
3 64 3 50 0 72.7 92.8 92.9 56.6 703,000
3 64 3 100 50 67.4 91.8 94.8 52.3 1,335,300
thresholding 56.9 71.0 48.2 69.6 -
HOG+SVM 22.0 72.0 24.0 20.0 -
cision, as aforementioned. The F
1
score of the top
CNNs ranges from 67.4% to 78.6%, revealing high
variance. This mostly occurred due to changes in
the precision-recall tradeoff. Overall, we consider the
second-best model to be an appropriate choice, since
it achieved a recall of 80.1%, while still keeping a
high accuracy of 92.6%. Besides, it is a small net-
work with only 335,694 trainable weights. It is also
worth considering that oil spills rarely occur in a sin-
gle patch of the UAV image. Thus, a single UAV im-
age comprised of several patches with oil spills will
have its density of oil (Equation 1) underestimated by
only approximately 20%, if the second-best model is
used.
In summary, the presented results validate our ma-
chine learning approach and indicate that it may be
effectively employed in real-world scenarios. As an
alternative to avoid the costs related to false positive
predictions, we suggest developing a more sophis-
ticated visual interface where a human would visu-
ally validate reddish spots, before sending a response
team.
3.2 Comparison with Baseline Image
Classification Methods
We compare the results of our CNN classifiers to the
traditional HOG+SVM (Han et al., 2006) approach,
which combines Histogram of Gradients features with
a linear Support Vector Machines (SVM) classifier;
and to a baseline thresholding method (Vyas et al.,
2015), since thresholding is a common oil spill detec-
tion approach (Al-Ruzouq et al., 2020). Class weight-
ing was similarly employed for the compared meth-
ods, as described in Section 3.1. The results shown
in Table 2 reveal inferior results for the HOG+SVM
method, with a poor F
1
score of 22%. Threshold-
ing achieved intermediate results, with an F
1
score of
56.9% but still inferior to the top 10 CNN configura-
tions. In this latter method, it is also worth noting a
reasonable recall of 69.6%, which may be exploited
in future work to improve the results of the CNN.
3.3 Case Study
In this case study, we followed the discussion of Sec-
tion 3.1 and opted for the second-best model of Ta-
ble 2, since it achieves the higher recall while keep-
ing high accuracy and a small number of trainable
weights, thus resulting in an accurate and compu-
tationally efficient model. The selected model was
employed to predict all patches in a large area of
70,000m
2
composed of 200 images collected by a
drone flying over Japaratinga. Prediction time was
approximately only 3 secs in a 2.5Ghz Intel i5 CPU
with 8GB of RAM, since patches prediction occurred
in batches.
After applying the postprocessing steps described
in Section 2.3, the heatmap shown in Figure 4 was ob-
tained. One can see the flight area bounded by a black
polygon, with color-coded oil densities. The heatmap
reveals a red spot in the northern part of the polygon,
indicating a concentration of oil in that region that
should be cleaned. It is worth noting that the loca-
tion of this specific flight was chosen because of high
concentrations of oil spills that were localized approx-
imately in the reddish spots of Figure 4. This is quali-
tative evidence that validates our method. Figure 5 ex-
hibit examples of a variety of correct predictions, in-
cluding challenging situations in the sand, water, and
seaweed. We thus conclude that the whole proposed
approach is practical to rapidly identify oil pollution
in beaches and allow a prompt response, minimizing
Oil Spill Detection and Visualization from UAV Images using Convolutional Neural Networks
335
Figure 4: Visualization of the resulting heatmap built from images collected in the municipality of Japaratinga, following the
pipeline shown in Figure 1. Our methodology allows to quickly identify a red spot indicating the presence of oil pollution in
the beach.
(a) True negative predictions. (b) True positive predictions.
Figure 5: Examples of correctly predicted patches of the heatmap shown in Figure 4.
environmental impacts. It is worth mentioning, how-
ever, that the trained model may not generalize to dif-
ferent coastal environments, requiring retraining the
model.
4 CONCLUSION
In this paper, we proposed a DL approach based on
low-cost UAVs images to efficiently identify and visu-
ally localize oil floating on the water surface or wash-
ing up on beaches. By combining a CNN, trained in
VISAPP 2022 - 17th International Conference on Computer Vision Theory and Applications
336

a supervised manner to evaluate small patches, with
a geospatial visual system, we showed that oil spills
can be rapidly detected and localized, allowing imme-
diate reactions and avoiding substantial environmen-
tal impact. Our classifiers achieved up to 93.6% of
accuracy and an F
1
score of 78.6% in a small dataset
comprised of 6,907 patches, revealing promising re-
sults that may be enhanced in future work by exploit-
ing larger datasets and more elaborate DL techniques,
such as image segmentation networks.
ACKNOWLEDGMENT
This work is part of the Long Term Eco-
logical Research – Brazil site PELD-CCAL
(Projeto Ecol
´
ogico de Longa Durac¸
˜
ao -
Costa dos Corais, Alagoas) funded by CNPq
–(#441657/2016 − 8, #442237/2020 − 0), and
FAPEAL (#60030.1564/2016). This research was
partially financed by the Justice Court of Alagoas
through the I Workshop on Mathematical Solutions
in Justice and Tourism.
REFERENCES
Al-Ruzouq, R., Gibril, M. B. A., Shanableh, A., Kais,
A., Hamed, O., Al-Mansoori, S., and Khalil, M. A.
(2020). Sensors, features, and machine learning for
oil spill detection and monitoring: A review. Remote
Sensing, 12(20):3338.
Beyer, J., Trannum, H. C., Bakke, T., Hodson, P. V., and
Collier, T. K. (2016). Environmental effects of the
deepwater horizon oil spill: a review. Marine pollu-
tion bulletin, 110(1):28–51.
Burger, J. (1997). Oil spills. Rutgers University Press.
Cazzato, D., Cimarelli, C., Sanchez-Lopez, J. L., Voos, H.,
and Leo, M. (2020). A survey of computer vision
methods for 2d object detection from unmanned aerial
vehicles. Journal of Imaging, 6(8):78.
Chollet, F. et al. (2015). Keras. https://keras.io.
Davaasuren, N., Marino, A., Boardman, C., Alparone, M.,
Nunziata, F., Ackermann, N., and Hajnsek, I. (2018).
Detecting microplastics pollution in world oceans us-
ing sar remote sensing. In IGARSS, pages 938–941.
IEEE.
Fingas, M. and Brown, C. E. (2018). A review of oil spill
remote sensing. Sensors, 18(1):91.
Han, F., Shan, Y., Cekander, R., Sawhney, H. S., and Kumar,
R. (2006). A two-stage approach to people and ve-
hicle detection with hog-based svm. In Performance
Metrics for Intelligent Systems 2006 Workshop, pages
133–140.
Jiao, Z., Jia, G., and Cai, Y. (2019). A new approach to oil
spill detection that combines deep learning with un-
manned aerial vehicles. Computers & Industrial En-
gineering, 135:1300–1311.
Kingma, D. P. and Ba, J. (2014). Adam: A
method for stochastic optimization. arXiv preprint
arXiv:1412.6980.
Kingston, P. F. (2002). Long-term environmental impact of
oil spills. Spill Science & Technology Bulletin, 7(1-
2):53–61.
Kussul, N., Lavreniuk, M., Skakun, S., and Shelestov, A.
(2017). Deep learning classification of land cover and
crop types using remote sensing data. IEEE Geo-
science and Remote Sensing Letters, 14(5):778–782.
Ladle, R., Malhado, A. C., Campos-Silva, J., and Pinheiro,
B. (2020). Brazil’s mystery oil spill: an ongoing social
disaster. Nature, 578(7793):37–37.
Magalh
˜
aes, K. M., de Souza Barros, K. V., de Lima, M.
C. S., de Almeida Rocha-Barreira, C., Rosa Filho,
J. S., and de Oliveira Soares, M. (2021). Oil spill+
covid-19: A disastrous year for brazilian seagrass
conservation. Science of The Total Environment,
764:142872.
Magris, R. A. and Giarrizzo, T. (2020). Mysterious oil
spill in the atlantic ocean threatens marine biodiversity
and local people in brazil. Marine pollution bulletin,
153:110961.
Massa, L., Barbosa, A., Oliveira, K., and Vieira, T. (2021).
Lrcn-retailnet: A recurrent neural network architec-
ture for accurate people counting. Multimedia Tools
and Applications, 80(4):5517–5537.
Miranda, R. J., Almeida, E. C., Pinto, T. K., Sampaio, C. L.,
Pereira, P. H., Nunes, J. A., and Ladle, R. J. (2020).
Re: Oil spill disaster in brazil: impact assessment ne-
glecting unique coral reefs. Science.
Nogueira, V., Oliveira, H., Silva, J. A., Vieira, T., and
Oliveira, K. (2019). Retailnet: A deep learning ap-
proach for people counting and hot spots detection in
retail stores. In SIBGRAPI, pages 155–162. IEEE.
Peterson, C. H., Rice, S. D., Short, J. W., Esler, D., Bodkin,
J. L., Ballachey, B. E., and Irons, D. B. (2003). Long-
term ecosystem response to the exxon valdez oil spill.
Science, 302(5653):2082–2086.
Puttemans, S., Van Beeck, K., and Goedem
´
e, T. (2018).
Comparing boosted cascades to deep learning archi-
tectures for fast and robust coconut tree detection in
aerial images. In Proceedings of the 13th interna-
tional joint conference on computer vision, imaging
and computer graphics theory and applications, vol-
ume 5, pages 230–241. SCITEPRESS.
Redmon, J., Divvala, S., Girshick, R., and Farhadi, A.
(2016). You only look once: Unified, real-time ob-
ject detection. In CVPR, pages 779–788.
Ren, S., He, K., Girshick, R., and Sun, J. (2016). Faster
r-cnn: towards real-time object detection with region
proposal networks. IEEE transactions on pattern
analysis and machine intelligence, 39(6):1137–1149.
Ribeiro, L., Souza, K., Domingues, E., and Magalh
˜
aes,
A. S. (2021). Blue water turns black: economic im-
pact of oil spill on tourism and fishing in brazilian
northeast. Current Issues in Tourism , 24(8):1042–
1047.
Oil Spill Detection and Visualization from UAV Images using Convolutional Neural Networks
337

Shaban, M., Salim, R., Abu, H., Khelifi, A., Shalaby, A., El-
Mashad, S., Mahmoud, A., Ghazal, M., and El-Baz,
A. (2021). A deep-learning framework for the detec-
tion of oil spills from sar data. Sensors, 21(7):2351.
Sissini, M., Berchez, F., Hall-Spencer, J., Ghilardi-Lopes,
N., Carvalho, V., Schubert, N., Koerich, G., Diaz-
Pulido, G., Silva, J., et al. (2020). Brazil oil
spill response: Protect rhodolith beds. Science,
367(6474):156–156.
Soares, M., Teixeira, C., Bezerra, L., Rossi, S., Tavares, T.,
and Cavalcante, R. (2020). Brazil oil spill response:
Time for coordination. Science, 367(6474):155–155.
Vyas, G., Bhan, A., and Gupta, D. (2015). Detection of
oil spills using feature extraction and threshold based
segmentation techniques. In 2015 2nd International
Conference on Signal Processing and Integrated Net-
works (SPIN), pages 579–583. IEEE.
Zacharias, D. C., Gama, C. M., and Fornaro, A. (2021).
Mysterious oil spill on brazilian coast: Analysis and
estimates. Marine Pollution Bulletin, 165:112125.
Zhang, Z., Liu, Q., and Wang, Y. (2018). Road extraction
by deep residual u-net. IEEE Geoscience and Remote
Sensing Letters, 15(5):749–753.
VISAPP 2022 - 17th International Conference on Computer Vision Theory and Applications
338
