
Impact of Machine Learning Assistance on the Quality of Life Prediction
for Breast Cancer Patients
Mikko Nuutinen
1,2 a
, Sonja Korhonen
1
, Anna-Maria Hiltunen
1
, Ira Haavisto
1,3
,
Paula Poikonen-Saksela
4
, Johanna Mattson
4
, Haridimos Kondylakis
5
, Ketti Mazzocco
6,7
,
Ruth Pat-Horenczyk
8
, Berta Sousa
9
and Riikka-Leena Leskel
¨
a
1
1
Nordic Healthcare Group, Helsinki, Finland
2
Haartman Institute, University of Helsinki, Helsinki, Finland
3
Laurea University of Applied Sciences, Sustainable and Versatile Social and Health Care, Vantaa, Finland
4
Helsinki University Hospital Comprehensive Cancer Center and Helsinki University, Finland
5
FORTH-ICS, Heraklion, Greece
6
Department of Oncology and Hemato-oncology, University of Milan, Milan, Italy
7
Applied Research Division for Cognitive and Psychological Science, European Institute of Oncology IRCCS, Milan, Italy
8
Paul Baerwald School of Social Work and Social Welfare, The Hebrew University of Jerusalem, Jerusalem, Israel
9
Champalimaud Clinical Centre, Breast Unit, Champalimaud Centre for the Unknown, Champalimaud Foundation, Lisboa,
Portugal
Keywords:
Clinical Decision Support System, Breast Cancer, Resilience, Machine Learning.
Abstract:
Proper and well-timed interventions may improve breast cancer patient adaptation, resilience and quality of life
(QoL) during treatment process and time after disease. The challenge is to identify those patients who would
benefit most from a particular intervention. The aim of this study was to measure whether the machine learning
prediction incorporated in the clinical decision support system (CDSS) improves clinicians’ performance to
predict patients’ QoL during treatment process. We conducted an experimental setup in which six clinicians
used CDSS and predicted QoL for 60 breast cancer patients. Each patient was evaluated both with and without
the aid of machine learning prediction. The clinicians were also open-ended interviewed to investigate the
usage and perceived benefits of CDSS with the machine learning prediction aid. Clinicians’ performance
to evaluate the patients’ QoL was higher with the aid of machine learning predictions than without the aid.
AUROC of clinicians was .777 (95% CI .691 − .857) with the aid and .755 (95% CI .664 − .840) without the
aid. When the machine learning model’s prediction was correct, the average accuracy (ACC) of the clinicians
was .788 (95% CI .739 − .838) with the aid and .717 (95% CI .636 − .798) without the aid.
1 INTRODUCTION
Breast cancer is a major socio-economic challenge
due to its high prevalence. In 2018, more than 2 mil-
lion new breast cancer patients were diagnosed world-
wide (Bray et al., 2018). 28% of all cancers in Europe
were breast cancers. The concept of resilience refers
to a person’s ability to adapt and bounce back from
some challenging event (Deshields et al., 2016; Rut-
ter, 2006). How a breast cancer patient adapts to treat-
ment process and time after disease greatly affects a
patient’s quality of life (QoL). Proper and well-timed
interventions may be important in improving patient
adaptation and resilience. The challenge is to identify
a
https://orcid.org/0000-0002-7429-3710
in advance and in a timely manner those patients who
would benefit most from a particular intervention.
An advanced machine learning algorithms inte-
grated into clinical decision support system (CDSS
(Sutton et al., 2020)) can help a clinician to identify
target patients and to determine appropriate interven-
tions. As far as we know, no previous studies have
investigated the aid of machine learning prediction in-
tegrated into CDSS to identify patients who may need
attention and intervention for resilience of breast can-
cer treatment process and survival. In this study, we
investigated the use of machine learning prediction in-
tegrated into CDSS to identify breast cancer patients
who may need help. We conducted a user experiment
in which clinicians’ task was to predict patients’ qual-
344
Nuutinen, M., Korhonen, S., Hiltunen, A., Haavisto, I., Poikonen-Saksela, P., Mattson, J., Kondylakis, H., Mazzocco, K., Pat-Horenczyk, R., Sousa, B. and Leskelä, R.
Impact of Machine Learning Assistance on the Quality of Life Prediction for Breast Cancer Patients.
DOI: 10.5220/0010786900003123
In Proceedings of the 15th International Joint Conference on Biomedical Engineering Systems and Technologies (BIOSTEC 2022) - Volume 5: HEALTHINF, pages 344-352
ISBN: 978-989-758-552-4; ISSN: 2184-4305
Copyright
c
2022 by SCITEPRESS – Science and Technology Publications, Lda. All rights reserved

ity of life after the time period of 6 months from the
diagnosis of breast cancer. The independent variable
of the user experiment was the aid of machine learn-
ing algorithm. The aim was to measure whether the
machine learning prediction improves clinicians’ per-
formance to predict the QoL of patients. In addition,
we conducted an open-ended interview for each clini-
cian. The aim was to determine how this kind of deci-
sion support tool could be used and who would benefit
from it and how.
2 METHODS
2.1 Dataset
Patient data that is used in this study was collected
from four clinical sites: (1) Helsinki University Hos-
pital Comprehensive Cancer Center (HUS), (2) He-
brew University in Jerusalem, Israel, (3) Champal-
imaud Breast Unit (CHAMP) and (4) European In-
stitute of Oncology (IEO). The study was approved
by the European Institute of Oncology, Applied Re-
search Division for Cognitive and Psychological Sci-
ence (Approval No R868/18 – IEO 916) and the clin-
ical ethical committees of each hospital.
The retrospective data set contains sociodemo-
graphic and lifestyle, medical and treatment and psy-
chosocial assessment values for 608 breast cancer
patients
1
. For the user experiment, we selected 60
HUS patients (test set). The remaining 548 patients
(train set) were used for training the machine learn-
ing algorithm. The target variable for machine learn-
ing algorithm and user experiment was patients’ self-
assessed quality of life (QoL) value evaluated six
months (Month 6) after the baseline (Month 0). Each
patient’s baseline was 3-4 weeks after breast cancer
was diagnosed. The QoL value was measured us-
ing EORTC QLQ-Global QoL scale (Aaronson et al.,
1993).
Table 1 presents descriptive analysis of sociode-
mographic and lifestyle, medical and treatment and
psychosocial assessment values for the patients of the
test set. These variables were presented in the user
interface of the user experiment for the clinicians (Fig
1). In Table 1, the patients are divided into the low
and high QoL groups. The threshold of grouping is
the QoL value of 75. Patients whose self-assessed
QoL value was higher than 75 after 6 months from
the baseline were grouped in the high QoL group.
The same grouping was used for training the machine
1
HUS: 185 patients, Hebrew University: 138 patients,
CHAMP: 108 patients and IEO: 177 patients
learning classifier (Section 2.2). Table 1 shows that
the high QoL patients were significantly older and
they had lower BMI and better baseline values for the
overall health and quality of life and lower distress
level compared to the low QoL group.
2.2 Machine Learning Model
Train data set (n=548) was used for training machine
learning model (random forest classifier). The task of
machine learning model was to classify a patient to
be either in the group of low QoL or high QoL af-
ter 6 months from the baseline. The performance of
the trained machine learning model to classify high
and low QoL patients was evaluated on the test data
set (n=60) by calculating the standard performance
metrics, such as the area under the receiver operating
characteristic curve (AUROC), recall and precision.
2.3 User Experiment
The standard performance measurements of machine
learning algorithms are not sufficient to show that
CDSS is effective also in a real clinical environment.
The human decision-making process is complex and
biased. It cannot be assumed that clinicians will al-
ways closely follow the recommendations of machine
learning model (Vasey et al., 2021; Ginestra et al.,
2019). In this study we conducted a user experiment
for measuring the performance of decision making by
simulating the use of CDSS with or without the aid
of the machine learning prediction. The independent
variable was the aid of machine learning prediction.
The dependent variable was the predicted QoL value
for patients. The QoL values were given by using the
continuous scale from 0 (low QoL) to 100 (high QoL).
2.3.1 User Interface
Fig 1 presents the user interface of the user experi-
ment in which the machine learning prediction (prob-
ablity of high QoL) was presented for the participants.
In the case of without the aid of prediction, only pa-
tient background information and patient question-
naire data were presented for the participants. The
QoL predictions from the participants were stored
with the slider at the bottom of the user interface (in-
side the red square).
The patient background information presented on
the user interface tried to present the same informa-
tion as clinicians use at the normal patient admission.
It’s important to note that the results of the experiment
are comparable to normal patient examinations only
when all patient’s background information relevant to
Impact of Machine Learning Assistance on the Quality of Life Prediction for Breast Cancer Patients
345

Table 1: Sociodemographic and lifestyle, medical and treatment and psychosocial assessment values for the test set patient
cohort. The patients are divided into the low and high QoL (quality of life) groups according to the QoL value measured
using EORTC global QLQ scale (Aaronson et al., 1993). The threshold of grouping is the QoL value of 75. Patients whose
self-assessed QoL value was higher than 75 after 6 months from the baseline were grouped in the high QoL group. P values
were calculated by Fisher’s exact or Mann-Whitney U test. EORTC = European organization for research and treatment of
cancer, Avg. = Average, SD = Standard deviation, BMI = Body mass index.
Variable group Variable Low QoL (0-75) High QoL (75-100) P value
Number of patients 38 22
Sociodemographic
and lifestyle
Age, Avg.(±SD) 54.6 (7.61) 62.2 (6.38) < .001
BMI, Avg.(±SD) 27.3 (4.62) 24.2 (3.76) 0.006
Higher education
1
, n (%) 38 (100.0) 21 (95.5) 0.367
Part time or unemployment, n (%) 1 (2.6) 2 (9.1) 0.548
Low income
2
, n (%) 6 (15.8) 1 (4.5) 0.246
No exercise, n (%) 3 (7.9) 1 (4.5) 1
Living alone, n (%) 15 (39.5) 10 (45.5) 0.787
Number of children, Avg.(±SD) 1.4 (1.15) 1.8 (1.1) 0.064
Medical and
treatment
Chemotherapy treatment, n (%) 26 (68.4) 12 (54.5) 0.405
Preexisting mentalillness, n (%) 15 (39.5) 5 (22.7) 0.258
Chronic depression, n (%) 5 (13.2) 0 (0.0) 0.148
Psychosocial
assessment
Baseline self-assessment:
Overall quality of life
3
, Avg.(±SD)
5.3 (1.12) 6.2 (1.18) < .001
Baseline self-assessment:
Overall health
4
, Avg.(±SD)
5.1 (1.04) 6.3 (1.08) < .001
Baseline self-assessment:
Distress level
5
, Avg.(±SD)
4.7 (2.68) 1.6 (1.65) < .001
Month 6, self-assessment:
Global QLQ
6
, Avg.(±SD)
55.7 (14.77) 92.0 (7.03) < .001
1
Bachelor, high school, postgraduate school or vocational non academic diploma
2
Net monthly income 0 -1500C
3
QLQ30-29 (Aaronson et al., 1993), How would you rate your overall quality of life during the past week? 1 (very poor) - 7 (exellent)
4
QLQ30-30 (Aaronson et al., 1993), How would you rate your overall health during the past week? 1 (very poor) - 7 (exellent)
5
NCCN distress thermometer (Goebel and Mehdorn, 2011), Please circle the number (0-10) that best describes how much distress you have been experiencing in the past week,
including today: 1 (No distress) - 10 (Extreme distress)
6
QLQ30 functional scale Global, (Aaronson et al., 1993) [0-100], the higher is better
the task are presented on the user interface. The pa-
tient background information of this study presented
on the user interface was based on consultation of two
medical oncologists with long experience of breast
cancer treatment (HUS: Paula Poikonen-Saksela and
Leena Vehmanen, 5.10.2020). The selected patient
background variables were related to the patient’s age,
BMI, education, working life, physical activity, fam-
ily relationships, chemotherapy treatment and mental
health background. Also, previous research (Bonanno
et al., 2007; Molina et al., 2014) supports that the vari-
ables such as age, socioeconomic and marital status
and social support are important factors of resilience.
Furthermore, the user interface presented the pa-
tients’ answers for three psychosocial questions. The
questions were related to patient’s health, quality of
life and distress level at the baseline. The questions
were selected according to the variable importance
values of the trained machine learning model (Table
3).
2.3.2 Participants and Samples
To compare the performance of clinicians with and
without the aid of prediction, six clinicians diagnosed
three sets of 20 patients twice, in two separate ses-
sions, according to the crossover design detailed in
Fig 2. Participants were oncologists with median
7.5 (4-18) years of experience of treating breast can-
cer patients. During each session, clinicians inter-
preted half of patients with machine learning predic-
tion value, and half without. After a washout period
the clinicians diagnosed the same set of 20 patients
with the aid status reversed. The patients that were re-
viewed with the aid of predictions at the first session
were reviewed without the aid during the second ses-
sion, and vice versa. That is, the 60 patients (test set)
were randomly grouped into three groups, 20 patients
in each, and each clinician evaluated all the patients
in one group with and without the aid. Thus, each pa-
tient group was evaluated by two different clinicians.
To establish familiarity with the CDSS and the
machine learning predictions, each session began
HEALTHINF 2022 - 15th International Conference on Health Informatics
346
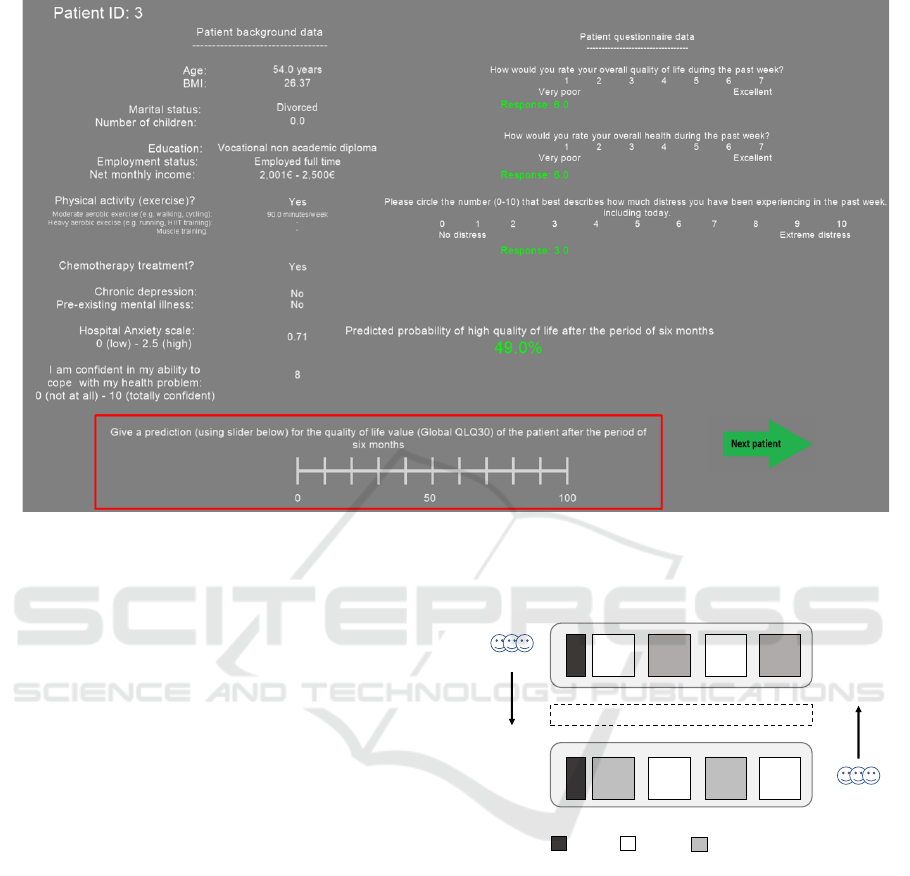
Figure 1: User interface of the user experiment. After participants have analyzed patient background information and selected
patient questionnaires, they rate quality of life value for the patient with or without the aid of machine learning prediction. The
quality of life values were given by using the continuous scale from 0 (low QoL) to 100 (high QoL) (inside the red square).
In this user interface example, the aid of machine learning prediction have been presented.
with an introduction and 4 training patients (2 with
and 2 without the aid) that were not part of the test
patients. Study administrator also clarified any ques-
tions about the functionality and the variables of user
experiment.
The washout period between the two sessions of
the crossover design was 2-4 weeks. According to
the recommendation (Pantanowitz et al., 2013) the
washout period should be at least 2 weeks. On the
other hand, with a long washout period, the partic-
ipant’s diagnostic criteria could have changed over
time. For example, participants could have gained
more experience or changed their attitude toward di-
agnostic criteria (Nielsen et al., 2010).
Too long experiment causes fatigue, which low-
ers the quality of input values. With a pilot study
we confirmed that the length of a single session with
20 patients was no more than 30 minutes. According
to standard (ITU-R, 2012) the duration of experiment
should be less than 60 minutes.
2.3.3 Open-ended Interview
After the second session of the user experiment, an
open-ended interview was conducted for the partici-
pants. The interview data was analyzed following the-
matic analysis and the approach identified by (Clarke
5 5 5
5 5 5
Washout period of 2 weeks
Training
With aid
Without aid
Order 2
Order 1
5
5
Figure 2: Experimental design. Each of the 6 clinicians
was randomly assigned to either test order 1 or 2. Each test
began with a brief practice block of 4 (2 with the aid and
2 without the aid) patient cases, followed by 4 experiment
blocks of 5 patients, with order 1 beginning with the aid of
machine learning predictions and order 2 beginning without
the aid.
and Braun, 2014). The interview included the follow-
ing questions:
• Could you make use of this kind of decision sup-
port tool when taking care of a patient and how?
• How would you envision it to be used in your or-
ganisation / department?
• Who (what role/s) in your organisation would use
such a tool?
• Who (what role/s) in your organisation would
Impact of Machine Learning Assistance on the Quality of Life Prediction for Breast Cancer Patients
347
make use of the information?
• How might the predicted score affect the patient
care processes from your perspective / in your or-
ganisation?
• Do you think the patients could benefit from this
kind of prediction? Under which conditions?
• What aspects should take in consideration when
further developing the decision support tool?
2.3.4 Statistical Analyses
The performance of the clinicians with the aid and
without the aid was evaluated by calculating the per-
formance metrics of the area under the receiver oper-
ating characterictic curve (AUROC), recall, precision
and balanced accuracy (ACC). Furthermore, we mea-
sured participants’ review time when decisions were
made with or without the aid of predictions. We used
bootstrapping (Seabold and Perktold, 2010) to com-
pute 95% confidential intervals (CI) and p-values for
the performance metrics.
3 RESULTS
3.1 Machine Learning Model
The AU ROC value of the trained machine learning
model (random forest) for the test data set was .832
(95% CI .757-.900). Recall and precision values were
.727 (95% CI .583-.857) and .727 (95% CI .589-.854)
when the threshold value of the model was .60. Table
2 presents the confusion matrix of the trained machine
learning model for the test data set when the threshold
value of the model was .60 or .70. With the thresh-
old of .60, the model classified 6/38 low QoL patients
in the group of high QoL (false positives). With the
threshold of .70, 1/38 low QoL patients were classi-
fied in the group of high QoL.
Table 3 lists the 10 most important variables of
the trained machine learning model according to the
random forest feature importance values. The vari-
ables of Global QLQ, mental health (HADS) and dis-
tress level at the baseline (Month 0) were important
psychosocial factors. Age, BMI and monthly income
were important sociodemographic and lifestyle fac-
tors.
3.1.1 User Experiment
Table 4 presents the performance values for the ma-
chine learning model and over clinicians with and
without the aid of the predictions. The overall
receiver operating characteristic (ROC) curves are
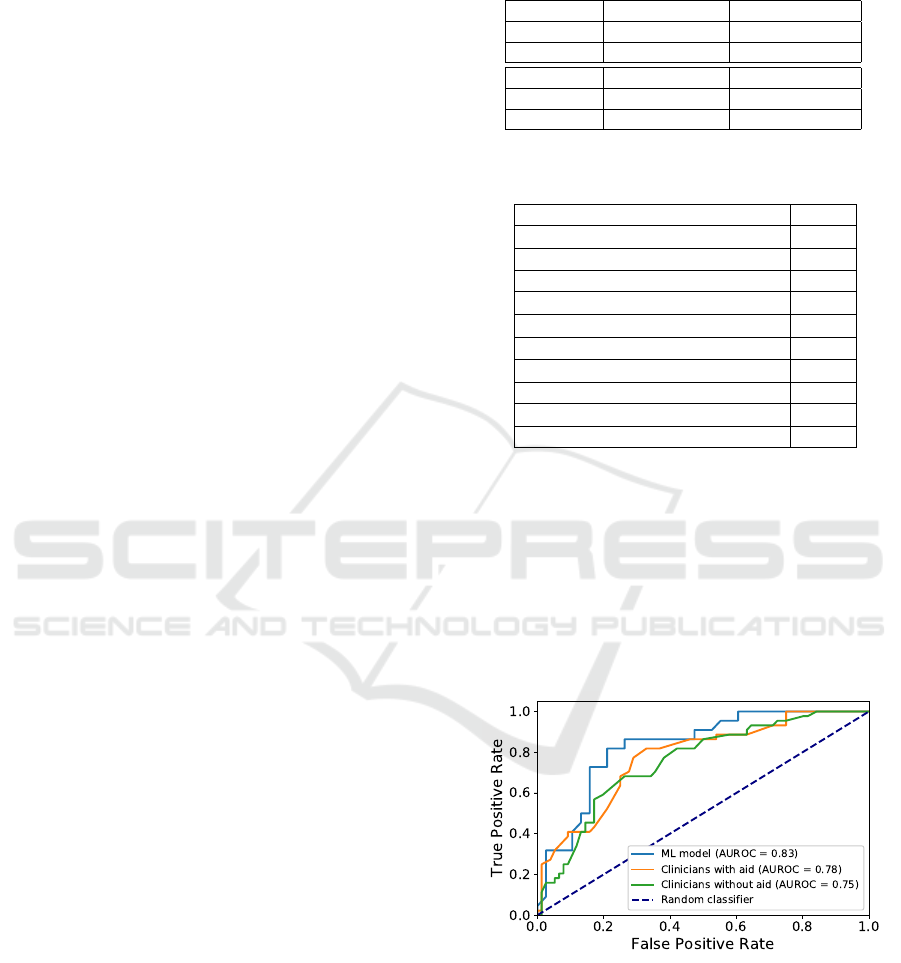
Table 2: Confusion matrix for the trained machine learning
model when the classification threshold (th) was .60 or .70.
QoL = Quality of life, Pred = predicted.
th = .60 Pred low QoL Pred high QoL
Low QoL 32 6
High QoL 6 16
th = .70 Pred low QoL Pred high QoL
Low QoL 37 1
High QoL 15 7
Table 3: Variable importance values of the trained machine
learning model.
Variable Value
Global QLQ
1
.106
Mental health, HADS
2
.079
Age .072
Distress level
3
.071
Overall quality of life, QLQ30-30
1
.057
Overall health, QLQ30-29
1
.048
Upset, PANAS 5
4
.044
Monthly income .043
Coping with cancer, CBI
5
.041
BMI .040
The psychosocial variabels were from the questionnaires:
1
EORTC quality of life questionnaire (QLQ-C30)
2
Hospital Anxiety and Depression Scale (HADS)
3
NCCN distress thermometer
4
Positive and Negative affectivity - short form (PANAS)
5
Cancer Behavior Inventory (self-efficacy in coping with cancer) (CBI-B)
shown in Fig 3. AUROC of clinicians was .755
(95% CI .664–.840) without the aid and .777 (95% CI
.691–.857) with the aid. AUROC of machine learn-
ing model was .832 (95% CI .757-.900) which is not
statistically significantly higher than AUROC of clin-
icians with or without the aid (p = .53 and p = .135).
Figure 3: The overall receiver operating characteristic
(ROC) curves for machine learning (ML) model and clin-
icians with/without the aid of machine learning prediction.
AUROC = Area under the receiver operating characteristic
curve.
The AUROC values of the individual clinicians
with or without the aid for the evaluated patient
groups (n = 20) are presented in Fig 4. The AUROC
values of the machine learning model are shown with
HEALTHINF 2022 - 15th International Conference on Health Informatics
348
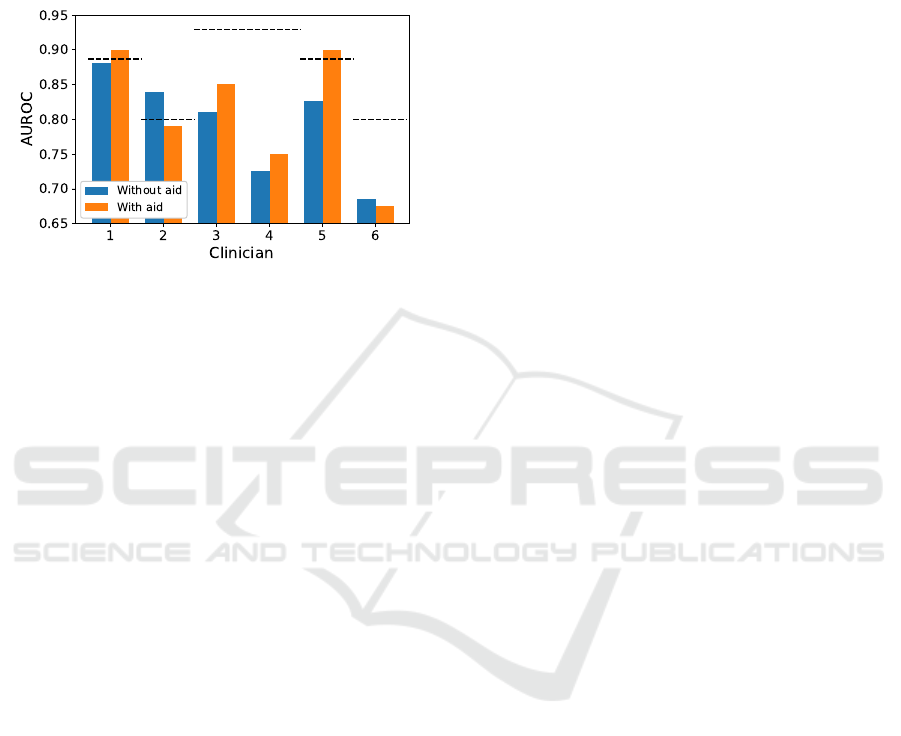
the dashed lines. Two clinicians (#1 and #5) with
the aid had higher AUROC than the machine learning
model had for the same 20 patient group. Four clini-
cians (#1, #3, #4, #5) with the aid had higher AUROC
than without the aid. Two clinicians (#2, #6) without
the aid had higher AUROC than with the aid.
Figure 4: Area under the receiver operating characteristic
curve (AUROC) values for the 6 clinicians with and without
the aid of machine learning prediction. The performance of
machine learning algorithm is shown with the dashed lines.
As can be seen from the results, on average, all
performance values (AU ROC, recall, precision, ACC)
were better with the aid than without the aid. It is also
clear, that the performance of the machine learning
model was higher than that of clinicians except for the
recall measure. However, recall and precision values
can be optimized by thresholding classifier. That is,
by using a lower probability threshold, recall can be
higher and precision lower and vice versa.
Table 5 presents review time for clinicians with
and without the aid. The average review time was
34.01 s (95% CI 31.49 s - 36.53 s) without the aid
and 38.63 s (95% CI 36.58 s - 40.67 s) with the aid.
The difference is statistically significant (p < .001).
Only one clinician (#6) was faster to give the predic-
tion with the aid than without the aid.
Table 6 presents accuracy values (ACC) of the
clinicians, when machine learning model predicted
the QoL classes correctly or incorrectly. The aver-
age accuracy of the clinicians was .720 (95% CI .644-
.797) without the aid and .793 (95% CI .754-.832)
with the aid (p = .040) when the machine learning
model predicted the QoL classes correctly. The aver-
age accuracy of the clinicians was .532 (95% CI .264-
.799) without the aid and .476 (95% CI .208-.745)
with the aid (p = .363) when the machine learning
model predicted the QoL classes incorrectly. That is,
when the prediction of the machine learning model
was correct, the predictions of the clinicians were
more accurate on average.
3.1.2 Open-ended Interview
All clinicians found the CDSS to be useful if incor-
porated into the care of breast cancer patients. Ac-
cording to clinicians, the information provided by the
CDSS would not likely affect the actual breast cancer
treatment of patients or the choice of therapies, but
rather influence the psychosocial support and other
possible interventions offered to patients. However,
there was a consensus that for the resilience predic-
tion to be valuable it must lead to an actual interven-
tion for the patient. The usefulness of the tool is there-
fore affected by the availability of interventions to im-
prove resilience. Furthermore, one clinician thought
that the prediction would be most useful and informa-
tive in cases where the predicted resilience is lower
than the clinician’s intuitive prediction. Several clin-
icians viewed that the CDSS would be most useful
if it could identify the patients with weak resilience
12 months after the end of treatment, at which point
in time a portion of patients are generally less vigor-
ous than the majority. The resilience prediction could
then be used to target specific individually planned in-
terventions and a higher level of support for this group
of patients. The optimal timing for the use of the
CDSS is thought to differ between patients, varying
from the time of planning adjuvant treatment to the
post-treatment period.
Most clinicians thought that both doctors and
nurses may be possible users of the CDSS and could
make use of resilience prediction information. How-
ever, the suitable user depends on which interventions
would follow from the prediction, as offering certain
interventions may require a referral from a doctor.
However, the likelihood and motivation of clinicians
to use the CDSS is generally believed to be signif-
icantly affected by the ease of use and convenience
of the tool. With regards to breast cancer patients,
there were conflicting views on whether the informa-
tion provided by the tool would be useful to be shared
with patients. While some clinicians viewed that pa-
tients learning their resilience prediction may moti-
vate and encourage them through their treatment and
rehabilitation process, some clinicians worried that a
poor predicted resilience may cause discouragement
and increase stress. Therefore, if the resilience pre-
diction is shared with patients the manner in which
the information is communicated must be paid atten-
tion to.
In further development of the CDSS, one clini-
cian highlighted the importance of the incorporation
of more parameters concerning breast cancer treat-
ment and possible comorbidities into the CDSS, while
another hoped for more detailed information of the
Impact of Machine Learning Assistance on the Quality of Life Prediction for Breast Cancer Patients
349

Table 4: The performance measurements of the area under the receiver operating characteristic curve (AUROC), recall, pre-
cision and balanced accuracy (ACC) for machine learning (ML) model and over all participants with and without the aid of
machine learning prediction. Recall, precision and ACC were calculated for the clinicians by using the threshold QoL value of
75 and for machine learning model by using the threshold probability value of .60. Avg. = Average, CI = Confidence interval.
Set AUROC Recall Precision ACC
ML, Avg. (95% CI) .832 (.757-.900) .727 (.587-.854) .727 (.589-.854) .785 (.704-.863)
With aid, Avg. (95% CI) .777 (.686-.858) .818 (.696-.930) .590 (.465-.707) .745 (.663-.820)
Without aid, Avg. (95% CI) .755 (.656-.840) .773 (.636-.887) .540 (.412-.662) .696 (.607-.778)
Table 5: Review time of the clinicians with and without the aid of the machine learning predictions. s = seconds, Avg. =
Average.
Clinician Review time with aid (s) Review time without aid (s)
1 38.99 29.05
2 40.78 32.96
3 35.02 29.32
4 38.60 35.55
5 32.99 27.81
6 45.38 49.40
Avg. 38.63 34.02
mental health and possible medications of the patient.
Furthermore, one clinician also hoped for the patient
perspective in terms of their feelings towards learning
their predicted resilience to be explored further.
4 DISCUSSION
The aim of this study was to measure whether the ma-
chine learning prediction integrated into the CDSS af-
fects clinicians’ ability to predict the quality of life of
breast cancer patients during the treatment process.
Based on the results, the aid of machine learning pre-
diction improved the ability of clinicians to predict
patients’ quality of life. Clinicians’ performance im-
proved at a statistically significant level in patients for
whom the machine learning model was able to predict
the correct outcome. The same result has also been
observed in a previous study (Kiani et al., 2020).
Traditional performance measurements, such as
AUROC, accuracy, and sensitivity, measure numerical
accuracy values. A deeper understanding of advan-
tages and disadvantages of CDSS requires different
measures and methods. Previous studies (Lee et al.,
2020; Jang et al., 2020) have measured, for example,
clinician’s confidence in his or her own assessment
when the prediction of a machine learning model was
visible. In this study, in addition to traditional per-
formance measures, we conducted an open-ended in-
terview for the participants. The interview gathered
information for the development and use of decision
support tool. Based on the results, this kind of deci-
sion support tool was found to be useful. However, it
requires that the use of the tool would lead to real in-
terventions, which in turn requires that interventions
are available and possible to apply. This finding lim-
its the usefulness of the tool to hospitals which have
ready interventions for support of resilience in place
or the possibility to add such interventions into the
breast cancer care process.
The research setup of this experimental study sim-
ulated the use of decision support tool. This is a re-
search setup that should be conducted after the perfor-
mance validation of machine learning algorithm but
before field study. The goal of field study is to val-
idate tool for a real operating environment. In other
words, the results of this study determined whether
the tool needs to be further developed and what im-
provements are needed before field study. Based
on the results, several improvements are needed be-
fore the field study phase. First, based on the open-
ended interview, the patient’s medication, treatment,
and other conditions should be presented more de-
tailed level. More specific information may improve
clinicians’ confidence in both their own assessments
and predictions provided by the CDSS. Second, clin-
icians’ performance improved only slightly when the
prediction of machine learning method was available.
If the prediction of machine learning model was cor-
rect, performance of clinicians improved at statisti-
cally significant level. Based on this, the performance
of the machine learning model should be improved for
the field study phase. The number of false predictions
should be minimized that the usefulness of the tool in
actual use can be higher. Third, the machine learning
model outputs only single prediction value to the time
point after six months from the baseline. CDSS could
be more useful if more endpoints (e.g., 6, 9 and 12
months) are predicted and/or timeline-type QoL tra-
jectories are possible. Furthermore, from the point of
view of the interviewed clinicians the resilience pre-
HEALTHINF 2022 - 15th International Conference on Health Informatics
350
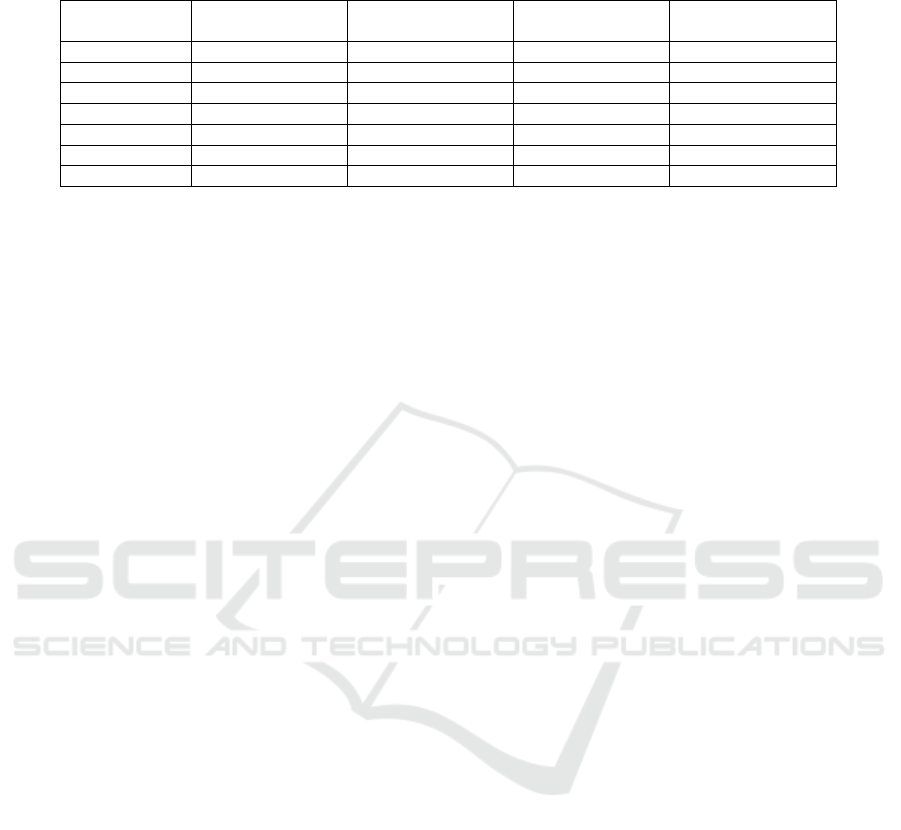
Table 6: Accuracy of individual participants when machine learning algorithm predicted correctly or incorrectly QoL (quality
of life) class for the patients. Avg. = Average, CI = Confidence interval.
With aid Without aid
Clinician Correct prediction Incorrect prediction Correct prediction Incorrect prediction
1 .765 .667 .647 .667
2 .846 .429 .846 .429
3 .722 .000 .667 .000
4 .833 1.000 .722 1.000
5 .824 .333 .824 .667
6 .769 .429 .615 .429
Avg. (95% CI) .793 (.754-.832) .476 (.208-.745) .720 (.644-.797) .532 (.264-.799)
diction would be most useful for the time point 12
months after the end of treatment, as more variance in
patients’ resilience is often observed at this point in
time.
As a follow-up study, the effect of the clinician’s
experience and test environment for the performance
should also be investigated. Previous research (Cai
et al., 2019) has shown that the aid of machine learn-
ing benefits more inexperienced clinicians. All partic-
ipants in this study were experienced clinicians. That
is, with inexperienced clinicians benefits from the aid
of machine learning predictions could be higher. Test
environment of this study did not correspond to a real
clinical environment. There were no unrelated dis-
tractions or other examinations requiring the attention
of clinicians. In noisy real clinical environment, the
aid of machine learning predictions can be higher that
should be studied.
5 CONCLUSIONS
Based on the study, the machine learning model in-
tegrated into the CDSS improved clinicians’ perfor-
mance in predicting patients’ quality of life after six
months from the baseline. Performance improved
especially in the cases where the machine learning
model was able to correctly predict patient’s QoL
value. It should be noted, however, that based on the
open-ended interview, this kind of tool is considered
useful only when resilience strengthening interven-
tions can be implemented for the patients identified
to have low predicted resilience
REFERENCES
Aaronson, N. K., Ahmedzai, S., Bergman, B., Bullinger,
M., Cull, A., Duez, N. J., Filiberti, A., Flechtner, H.,
Fleishman, S. B., and de Haes, J. C. (1993). The Eu-
ropean Organization for Research and Treatment of
Cancer QLQ-C30: a quality-of-life instrument for use
in international clinical trials in oncology. J Natl Can-
cer Inst, 85(5):365–376.
Bonanno, G. A., Galea, S., Bucciarelli, A., and Vlahov, D.
(2007). What predicts psychological resilience after
disaster? The role of demographics, resources, and
life stress. J Consult Clin Psychol, 75(5):671–682.
Bray, F., Ferlay, J., Soerjomataram, I., Siegel, R. L., Torre,
L. A., and Jemal, A. (2018). Global cancer statistics
2018: GLOBOCAN estimates of incidence and mor-
tality worldwide for 36 cancers in 185 countries. CA
Cancer J Clin, 68(6):394–424.
Cai, S. L., Li, B., Tan, W. M., Niu, X. J., Yu, H. H.,
Yao, L. Q., Zhou, P. H., Yan, B., and Zhong, Y. S.
(2019). Using a deep learning system in endoscopy
for screening of early esophageal squamous cell car-
cinoma (with video). Gastrointest Endosc, 90(5):745–
753.
Clarke, V. and Braun, V. (2014). Thematic Analysis, vol-
ume 3, pages 1947–1952.
Deshields, T. L., Heiland, M. F., Kracen, A. C., and Dua, P.
(2016). Resilience in adults with cancer: development
of a conceptual model. Psychooncology, 25(1):11–18.
Ginestra, J. C., Giannini, H. M., Schweickert, W. D., Mead-
ows, L., Lynch, M. J., Pavan, K., Chivers, C. J.,
Draugelis, M., Donnelly, P. J., Fuchs, B. D., and
Umscheid, C. A. (2019). Clinician Perception of a
Machine Learning-Based Early Warning System De-
signed to Predict Severe Sepsis and Septic Shock. Crit
Care Med, 47(11):1477–1484.
Goebel, S. and Mehdorn, H. M. (2011). Measurement of
psychological distress in patients with intracranial tu-
mours: the NCCN distress thermometer. J Neuroon-
col, 104(1):357–364.
ITU-R (2012). Itu-r rec. bt.500-13, methodology for the
subjective assessment of the quality of television pic-
tures. Report A 70000, ITU Radiocommunication
Sector.
Jang, S., Song, H., Shin, Y. J., Kim, J., Kim, J., Lee, K. W.,
Lee, S. S., Lee, W., Lee, S., and Lee, K. H. (2020).
Deep Learning-based Automatic Detection Algorithm
for Reducing Overlooked Lung Cancers on Chest Ra-
diographs. Radiology, 296(3):652–661.
Kiani, A., Uyumazturk, B., Rajpurkar, P., Wang, A., Gao,
R., Jones, E., Yu, Y., Langlotz, C. P., Ball, R. L.,
Montine, T. J., Martin, B. A., Berry, G. J., Ozawa,
M. G., Hazard, F. K., Brown, R. A., Chen, S. B.,
Wood, M., Allard, L. S., Ylagan, L., Ng, A. Y., and
Shen, J. (2020). Impact of a deep learning assistant on
the histopathologic classification of liver cancer. NPJ
Digit Med, 3:23.
Impact of Machine Learning Assistance on the Quality of Life Prediction for Breast Cancer Patients
351

Lee, J. H., Ha, E. J., Kim, D., Jung, Y. J., Heo, S., Jang,
Y. H., An, S. H., and Lee, K. (2020). Application
of deep learning to the diagnosis of cervical lymph
node metastasis from thyroid cancer with CT: external
validation and clinical utility for resident training. Eur
Radiol, 30(6):3066–3072.
Molina, Y., Yi, J. C., Martinez-Gutierrez, J., Reding, K. W.,
Yi-Frazier, J. P., and Rosenberg, A. R. (2014). Re-
silience among patients across the cancer continuum:
diverse perspectives. Clin J Oncol Nurs, 18(1):93–
101.
Nielsen, P. S., Lindebjerg, J., Rasmussen, J., Starklint, H.,
Waldstrøm, M., and Nielsen, B. (2010). Virtual mi-
croscopy: an evaluation of its validity and diagnostic
performance in routine histologic diagnosis of skin tu-
mors. Hum Pathol, 41(12):1770–1776.
Pantanowitz, L., Sinard, J. H., Henricks, W. H., Fatheree,
L. A., Carter, A. B., Contis, L., Beckwith, B. A.,
Evans, A. J., Lal, A., and Parwani, A. V. (2013). Vali-
dating whole slide imaging for diagnostic purposes in
pathology: guideline from the College of American
Pathologists Pathology and Laboratory Quality Cen-
ter. Arch Pathol Lab Med, 137(12):1710–1722.
Rutter, M. (2006). Implications of resilience concepts for
scientific understanding. Ann N Y Acad Sci, 1094:1–
12.
Seabold, S. and Perktold, J. (2010). Statsmodels: Econo-
metric and statistical modeling with python. Proceed-
ings of the 9th Python in Science Conference, 2010.
Sutton, R. T., Pincock, D., Baumgart, D. C., Sadowski,
D. C., Fedorak, R. N., and Kroeker, K. I. (2020). An
overview of clinical decision support systems: bene-
fits, risks, and strategies for success. NPJ Digit Med,
3:17.
Vasey, B., Clifton, D. A., Collins, G. S., Denniston, A. K.,
Faes, L., Geerts, B. F., Liu, X., Morgan, L., Watkin-
son, P., and McCulloch, P. (2021). DECIDE-AI: new
reporting guidelines to bridge the development-to-
implementation gap in clinical artificial intelligence.
Nat Med, 27(2):186–187.
HEALTHINF 2022 - 15th International Conference on Health Informatics
352
