
The Usage of Data Augmentation Strategies on the Detection of Murmur
Waves in a PCG Signal
Jos
´
e Torres
1
, Jorge Oliveira
2
and Elsa Ferreira Gomes
1,3
1
Instituto Superior de Engenharia do Porto, Porto, Portugal
2
Universidade Portucalense Infante D. Henrique, Porto, Portugal
3
INESC TEC, Porto, Portugal
fi
Keywords:
PCG, Deep Learning, Heart Disease, CNN, SMOTE.
Abstract:
Cardiac auscultation is a key screening tool used for cardiovascular evaluation. When used properly, it speeds
up treatment and thus improving the patient’s life quality. However, the analysis and interpretation of the
heart sound signals is subjective and dependent of the physician’s experience and domain knowledge. A
computer assistant decision (CAD) system that automatically analyse heart sound signals, can not only support
physicians in their clinical decisions but also release human resources to other tasks. In this paper, and to the
best of our knowledge, for the first time a SMOTE strategy is used to boost a Convolutional Neural Network
performance on the detection of murmur waves. Using the SMOTE strategy, a CNN achieved an overall of
88.43%.
1 INTRODUCTION
Cardiovascular Diseases (CVD) are the leading cause
of death worldwide. An estimated 17.9 million people
died from CVD in 2019, it represents 32% of the num-
ber of deaths worldwide (WHO, 2020). A common
method to detect cardiac diseases is through a car-
diac heart sound auscultation (Mustafa, 2020). Nev-
ertheless, heart sound auscultation is a difficult proce-
dure, since it requires continuous training and many
heart sounds are faint and hard to detect. Fortunately,
modern stethoscopes such as the Litmann 3200 can
amplify heart sounds, reduce the environment noise,
improve the user’s perception and, more importantly,
convert an acoustic to a digital signal (Prodoctor2019,
2020). This allowed, for the first time, the develop-
ment of computer assisted decision (CAD) systems
based on auscultation. Such systems can find sound
pattern features related to a dysfunctional or malfunc-
tion cardiac heart valve. An early detection allows a
more accurate treatment plan and thus improving the
patient’s life expectancy (Singh and Cheema, 2013;
Latif et al., 2018). The cost of CAD system is reduced
when compared to the cost of a specialised health-
care professional and more specific exams. These sys-
tems can also be used in developing countries where
people do not have the monetary power to access
an effective and equitable health service that meets
their needs. For the creation of CAD systems, a
heart sound dataset is required. However, the exist-
ing datasets have few heart murmur samples which
makes the training of machine learning algorithms
difficult. On the other hand oversampling methods
might mitigate this limitation by increasing the minor-
ity class in the dataset. In this paper, the application
data augmentation strategies on the detection of mur-
mur events are analysed, more specifically SMOTE
(synthetic minority oversampling technique) and its
effect on convolutional neural network (CNN) based
architectures. Up to our knowledge it is the first time
that, realistic and synthetic Mel spectrograms images
are generated from abnormal heartbeat signals. These
synthetic images are similar to the images generated
using the original sounds (Figure 3). This allows to
balance the data, reduce the overfitting and find a
more discriminate decision boundary. The paper is
organised as follows. Section 2 provides some back-
ground concerning the fundamental waves of each
phonocardiogram (PCG) signal . Section 3 refers to
the related works in the literature. Section 4 describes
the proposed methodology on the detection of mur-
mur waves. Section 5 presents the SMOTE oversam-
pling approach used. In Section 6 we discuss the re-
sults of our experiments. Finally, Section 7 presents
the conclusions and the future work.
128
Torres, J., Oliveira, J. and Gomes, E.
The Usage of Data Augmentation Strategies on the Detection of Murmur Waves in a PCG Signal.
DOI: 10.5220/0010784500003123
In Proceedings of the 15th International Joint Conference on Biomedical Engineering Systems and Technologies (BIOSTEC 2022) - Volume 4: BIOSIGNALS, pages 128-132
ISBN: 978-989-758-552-4; ISSN: 2184-4305
Copyright
c
2022 by SCITEPRESS – Science and Technology Publications, Lda. All rights reserved
2 BACKGROUND
Normal heart sounds are mainly generated by the vi-
brations of cardiac valves as they open and close dur-
ing each cardiac cycle and the turbulence of the blood
in the arteries. Blood flowing through these structures
creates audible sounds, which are more significant
when the flow is more turbulent (Libby et al., 2007).
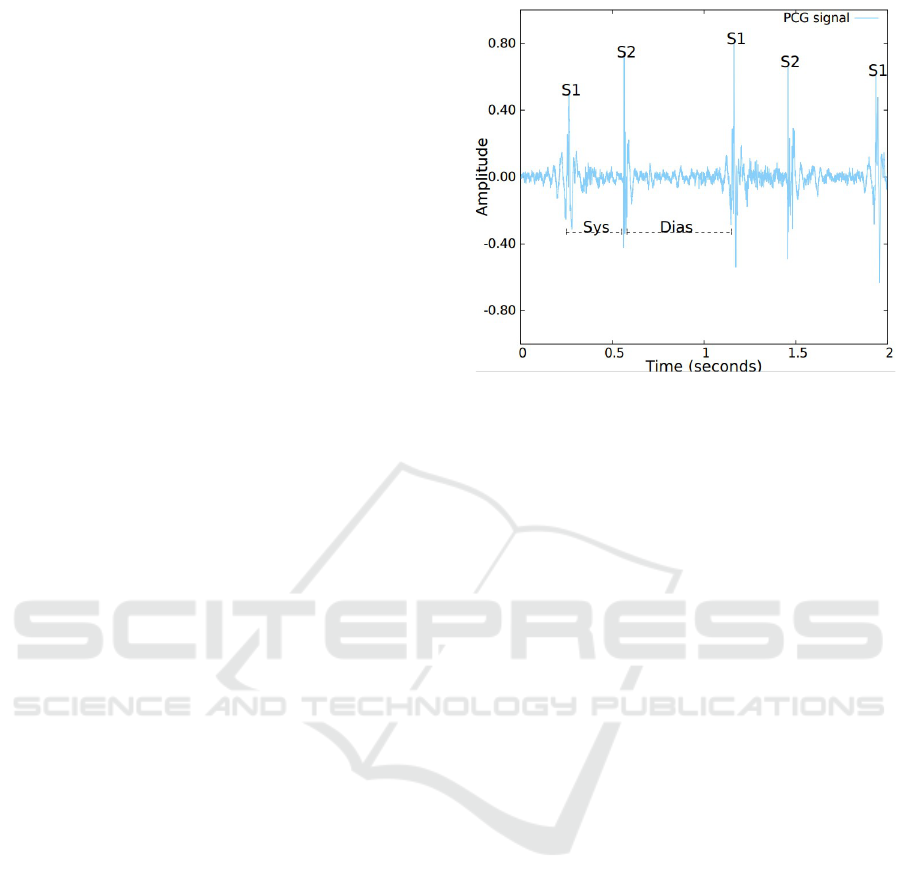
The heartbeat has two basic sounds, namely S1 and
S2. Each sound corresponds to a period called systole
and diastole. Systole is caused by ventricular pres-
sure on the tricuspid and mitral valves. The first heart
sound (S1) is audible on the chest wall and is pro-
duced by vibrations of both valves as they close in at
the beginning of the systole. (MA., 2008). Although
the mitral component of S1 is louder and occurs ear-
lier, under physiological resting conditions, both com-
ponents (mitral and tricuspid) occur closely enough,
making it hard to distinguish between them (Dorn-
bush S, 2021), an illustration of a S1 sound is pro-
vided in Figure 1. Diastole happens as the muscles
in the ventricles relax, causing pressures in the auri-
cles to be greater than those in the ventricles, forcing
the tricuspid and mitral valves to open and the pul-
monary valve and aortic valve to close. The second
heart sound (S2) is produced by the closure of the
pulmonary valve and aortic at the beginning of the
diastole. S2 is also formed by two components, with
the aortic component being louder and occurring ear-
lier than the pulmonary component (since the pressure
in the aorta is higher than in the pulmonary artery).
In contrast, unlike S1, under normal conditions, the
closure sound of the aortic and pulmonary valves can
be distinguishable. This is due to an increase in ve-
nous return during inspiration which slightly delays
the pressure increase in the pulmonary artery and con-
sequently the pulmonary valve closure (Dornbush S,
2021), an illustration of a S2 sound is provided in Fig-
ure 1.
3 RELATED WORK
Several works are available in the literature that
consider the problem of heart sound classification.
Banerjee and Majhi (Banerjee and Majhi, 2020) used
MFCC to extract the information from the heart sound
signals in PASCAL challenge dataset. These features
are further feed into several CNN models, an accu-
racy of 83% was reported by the authors. Potes (Potes
et al., 2016) also used MFCC to train an ensemble
classifier, and 86% accuracy was reported using Phy-
sioNet dataset. Khan (Khan et al., 2021) extracted
short-time Fourier transform (STFT) features as in-
Figure 1: An example of a normalized heart sound record-
ing, the position of the fundamental heart sounds S1 and
S2 are displayed and identified. Furthermore, the Systolic
(Sys) and the Diastolic (Dias) periods are also displayed and
identified.
put to CNN models. The authors reported an accu-
racy of 96.8% using PASCAL and PhysioNet dataset.
Boulares (Boulares et al., 2020) used MFCC spectro-
grams as input to pre-trained models, such as VGG-
19. The authors used PASCAL dataset and reported
an accuracy of 77%. Koike (Koike et al., 2020)
used MFCC and Mel Spectrogram to retrain a pre-
trained model entitled Pretrained Audio Neural Net-
works (PANNs). The authors used PhysioNet dataset
and reported a sensitivity of 96.9% and specificity of
88.6%. Zabihi (Zabihi et al., 2016) extracted several
features from time, frequency and time-frequency do-
main from PhysioNet dataset in order to train a feed
forward Artificial Neural Networks (ANNs). Due to
the imbalance problem between normal and abnor-
mal signals presented in the dataset, a bootstrap re-
sampling technique was used to balance the dataset.
The authors reported an overall of 85.90%. Baydoun
(Baydoun et al., 2020) extracted a set of statistical fea-
tures from PhysioNet dataset. To balance the dataset,
the authors used oversampling techniques to replicate
the information of the minority class. The best result
was obtained by combining LogitBoost and Bagging
with an overall of 86.6%.
4 METHODOLOGY
The proposed methodology for this study was tested
using PhysioNet dataset to compare our results with
current state of art approaches. Nevertheless, in the
training phase both PhysioNet and Pascal datasets
were used, as a result more murmur wave patterns are
The Usage of Data Augmentation Strategies on the Detection of Murmur Waves in a PCG Signal
129
provided during the learning process. In order to get
robust and trusty results, 10-fold stratified cross vali-
dation method was implemented. This method ensure
that the class distribution in each fold is similar to that
in the original dataset and is guaranteed that all data
is tested once.
4.1 Data Processing
Our pre-processing starts by resampling the signal
22000Hz frequency rate. After that, the sound is fil-
tered using the Butterworth 4th order, with a cut-off
bandpass filter at frequencies 20Hz-400Hz. In the last
step, the signal is divided into segments of 6 seconds
long. PCG signals shorter than 6 seconds are padded
with zeros until the desired length is reached. Follow-
ing the Koike et al. (Koike et al., 2020) experiments,
Mel Spectrograms were computed using a Hamming
window of 30ms and with a stride of 15ms. This set-
ting allows 50% overlap which ensures that no rel-
evant information is lost in the process. After that,
the spectrogram is normalised to the [0,1] range. For
training the CNN model, we use spectrogram images
206px width and 92px high. The dataset contains
sounds of different patients. For each patient differ-
ent sounds were recorded. To determine if a patient
is normal, in our work, we grouped these sounds by
patient.
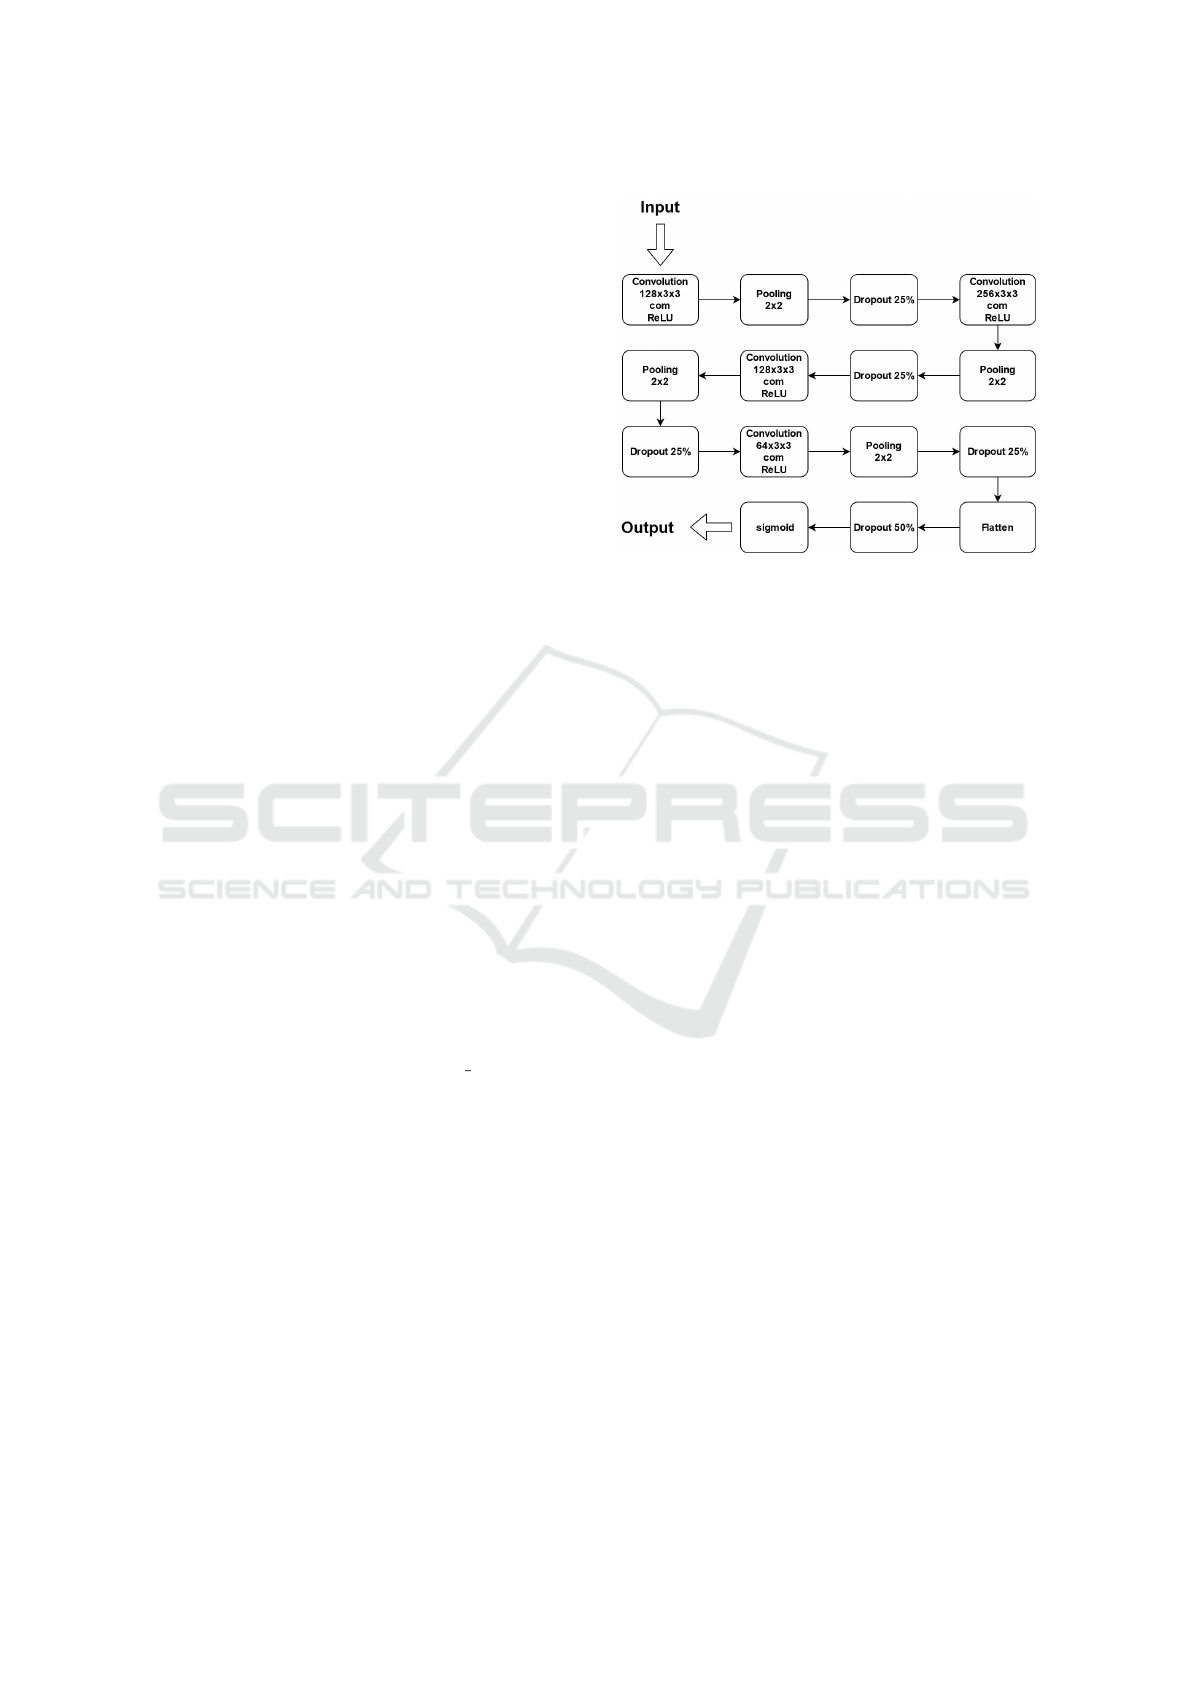
4.2 Model Selection and Configuration
For the detection of murmur events, we used a CNN
model where all the weights were randomly initialised
from a uniform distribution. The CNN architecture
adopted from (Khan et al., 2021) is shown in Figure 2.
The optimiser selected is the Adam function with
a learning rate of 0.01 and the binnary crossentropy
is our loss function. The model weights were updated
using a batch size of 64 random patient’s data.
After the model weights are updated, the model is
tested in the test set and grouped by patient. For each
patient from test set, all of their sounds are classi-
fied, and is determined whether or not the patient has
pathological heart condition. For a patient to be con-
sidered a patient with pathological heart condition, at
least one murmur wave must be detected in one of
their recordings, otherwise it is considered a normal
patient. This process is repeated until the model is
trained and tested for the number of epochs defined.
In our experiments the model was trained using 30
epochs.
When applying this methodology we have ensured
that signal segments from the same patient are not
Figure 2: The adopted CNN architecture. The architecture
is composed by four convolution layers, followed by a pool-
ing layer and a dropout layer. The last output layer is a sig-
moid layer.
placed in more that one fold. Thus avoiding, over-
fitting to a specific subject in our dataset.
4.3 Dataset
4.3.1 PASCAL Challenge Dataset
The dataset is composed of a total of 312 heart rates
recordings collected from children or adults in calm
or excited states, divided into two separate sets called
“dataset A” and “dataset B”. These sounds were
recorded at the Cardiology Unit of the Maternal-Fetal
Unit of the Hospital Real Portugu
ˆ
es in Recife, Brazil.
These recordings were collected in children. The du-
ration ranges from 1 to 10 seconds. Each sound was
categorised into one of three classes: Normal, Mur-
mur and Extrasystole. The Normal class has 200
heart sounds, the Murmur has 97 heart sounds and
Extrasystole has 46 heart sounds.
4.3.2 PhysioNet Computing in Cardiology
Challenge
The PhysioNet dataset was made available in 2016
for a phonocardiogram classification challenge. This
is composed by 6 datasets (A-F), with a total of
3240 cardiac sounds (2575 normal e 665 abnormal).
The recordings were collected from different research
groups. The patients include children, adults and el-
ders. The duration of recordings ranges from 5 sec-
onds to 120 seconds.
BIOSIGNALS 2022 - 15th International Conference on Bio-inspired Systems and Signal Processing
130

Figure 3: On the left, a spectrogram image from the PhysioNet database; On the right, a synthetic spectrogram image generated
by the adopted SMOTE algorithm.
4.4 Metrics
The metric used to evaluate the model’s performance
is an average between the sensitivity (1) and speci-
ficity (2), commonly named ”overall” (3). Overall,
sensitivity and specificity can be calculated by using
the following formulas:
Sensitivity =
T P
T P + FN
(1)
Speci f icity =
T N
T N + FP
(2)
Overall =
Sensitivity + Speci f icity
2
(3)
Where TP (True Positive) is the number of sub-
jects with CVD who have been correctly identified as
subject with CVD, TN (True Negative) is the num-
ber of healthy subject correctly identified as healthy,
FP (False Positive) is the number of healthy subject
incorrectly identified as subject with CVD and FN
(False Negative) is the number of subjects with CVD
incorrectly identified as healthy subjects.
5 DATA AUGMENTATION USING
SMOTE
For training the model, we use the Pascal and Phys-
ioNet dataset. Combining both datasets results in a
dataset with approximately 74% normal sounds and
26% abnormal sounds. The existing class ratio may
result in a poor learning process. To avoid it, the
dataset was balanced using a SMOTE technique. Syn-
thetic spectrograms similar to the ones of the minority
class were generated using the following procedure:
1. Identify the minority class;
2. Select the number of nearest neighbours K;
3. Compute a new tensor from a minority tensor and
any of its neighbours and using Eq. (4);
4. Repeat step 3 for all minority tensors and their K
neighbors until the dataset is balanced.
S = C + rand(0, 1) ∗ di f f (4)
Where S represents a synthetic tensor, C is the
considered minority tensor and di f f is a difference
tensor computed from C and the selected K. To be
able to generate new images using SMOTE, initially
we convert from a 4D (batch, width, height, channels)
to 2D array. To convert an array to 2D reshape tech-
niques are used. After that, we use a SMOTE ap-
proach with K of 20 to generate the synthetic ten-
sors. To get the desired image dataset, we need to
reshape the SMOTE dataset with shapes multiplied
previously. The Fig.3 shows an example of an abnor-
mal synthetic image.
6 RESULTS
In order to make fair comparisons with current state-
of-art solutions, we have implemented and tested the
algorithm proposed by (Nogueira et al., 2019). Ta-
ble 1 reports our findings.
Table 1: Comparison of results.
Alt. Sensitivity Specificity Overall
(Nogueira et al., 2019) 87.37% 79.07% 83.22%
CNN 85.41% 90.02% 87.72%
SMOTE-CNN 84.51% 92.34% 88.43%
Both implemented CNN model’s obtained a
higher overall performance than (Nogueira et al.,
2019). This might be due to the fact that, our CNNs
models are deeper and have a larger receptive field
than the CNN model implemented by (Nogueira
et al., 2019). Furthermore, the impact of a SMOTE
technique was evaluated and also reported in Table 1.
Using a SMOTE technique, synthetic spectrogram
images from abnormal examples are added to our
databases. As a result, abnormal patterns that have not
yet been seen by CNN models were extrapolated and
The Usage of Data Augmentation Strategies on the Detection of Murmur Waves in a PCG Signal
131

created. As a result, the network is more capable of
distinguishing normal from abnormal examples. The
application of SMOTE techniques boosted the CNN
model in overall by 0.71%.
7 CONCLUSIONS AND FUTURE
WORK
In this paper, the problematic concerning to the short-
age of abnormal heart sound examples is studied and
addressed. We proposed the usage of SMOTE tech-
niques to generate synthetic spectrogram images. The
best result was achieved by a SMOTE-CNN algo-
rithm, an overall of 88.43%, a Sensitivity of 84.51%
and a Specificity of 92.34%.
The current results, strongly indicate that the ap-
plication of oversampling techniques, such as the
SMOTE, can improve significantly the capability of
CNN model’s to discriminate between normal and ab-
normal heart beats. The proposed SMOTE approach
can serve as a basis for other unbalanced dataset prob-
lems besides heart sounds problems.
For future work we intend to extend out experi-
ments to pre-trained models. We also intend explore
other oversampling techniques.
ACKNOWLEDGEMENTS
This work is financed by National Funds through
the Portuguese funding agency, FCT-Fundac¸
˜
ao
para a Ci
ˆ
encia e a Tecnologia, within project
UIDB/50014/2020.
REFERENCES
Banerjee, M. and Majhi, S. (2020). Multi-class heart sounds
classification using 2d-convolutional neural network.
In 2020 5th International Conference on Computing,
Communication and Security (ICCCS), pages 1–6.
Baydoun, M., Safatly, L., Ghaziri, H., and El-Hajj, A.
(2020). Analysis of heart sound anomalies using en-
semble learning. Biomed. Signal Process. Control.,
62:102019.
Boulares, M., Alafif, T., and Barnawi, A. (2020). Transfer
learning benchmark for cardiovascular disease recog-
nition. IEEE Access, 8:109475–109491.
Dornbush S, T. A. (2021). Physiology, heart sounds.
Khan, K. N., Khan, F. A., Abid, A., Olmez, T., Dokur,
Z., Khandakar, A., Chowdhury, M. E. H., and Khan,
M. S. (2021). Deep learning based classification of un-
segmented phonocardiogram spectrograms leveraging
transfer learning.
Koike, T., Qian, K., Kong, Q., Plumbley, M. D., Schuller,
B. W., and Yamamoto, Y. (2020). Audio for audio is
better? an investigation on transfer learning models
for heart sound classification. In 2020 42nd Annual
International Conference of the IEEE Engineering in
Medicine Biology Society (EMBC), pages 74–77.
Latif, S., Usman, M., Rana, R., and Qadir, J. (2018).
Phonocardiographic sensing using deep learning for
abnormal heartbeat detection. IEEE Sensors Journal,
18(22):9393–9400.
Libby, P., Bonow, R., Mann, D., and Zipes, D. (2007).
Braunwald’s Heart Disease: A Textbook of Cardio-
vascular Medicine. 8th edition. Elsevier Science.
MA., C. (2008). Cardiac auscultation: rediscovering the
lost art. Curr Probl Cardiol., 7(33):326–408.
Mustafa, M. e. a. (2020). Detection of heartbeat sounds
arrhythmia using automatic spectral methods and
cardiac auscultatory. Journal of Supercomputing,
76(8):5899–5922.
Nogueira, D. M., Ferreira, C. A., Gomes, E. F., and Jorge,
A. M. (2019). Classifying heart sounds using images
of motifs, mfcc and temporal features. J. Med. Syst.,
43(6).
Potes, C., Parvaneh, S., Rahman, A., and Conroy, B. (2016).
Ensemble of feature-based and deep learning-based
classifiers for detection of abnormal heart sounds. In
2016 Computing in Cardiology Conference (CinC),
pages 621–624.
Prodoctor2019 (2020). Estetosc
´
opio eletr
ˆ
onico: tudo o que
voc
ˆ
e precisa saber.
Singh, M. and Cheema, A. (2013). Heart sounds classifi-
cation using feature extraction of phonocardiography
signal. International Journal of Computer Applica-
tions, 4(77):13–17.
WHO (2020). World health organization (2020) cardiovas-
cular diseases (cvds), cardiovascular diseases (cvds).
Zabihi, M., Rad, A. B., Kiranyaz, S., Gabbouj, M., and Kat-
saggelos, A. K. (2016). Heart sound anomaly and
quality detection using ensemble of neural networks
without segmentation. In 2016 Computing in Cardi-
ology Conference (CinC), pages 613–616.
BIOSIGNALS 2022 - 15th International Conference on Bio-inspired Systems and Signal Processing
132
