
Hybrid Method for Rapid Development of Efficient and Robust Models
for In-row Crop Segmentation
Paweł Majewski
1 a
and Jacek Reiner
2 b
1
Department of Systems and Computer Networks, Wrocław University of Science and Technology, Poland
2
Faculty of Mechanical Engineering, Wrocław University of Science and Technology, Poland
Keywords:
Crop Segmentation, Crop Row Detection, Mask R-CNN, Active Learning, Vegetation Indices, UAV.
Abstract:
Crop segmentation is a crucial part of computer vision methods for precision agriculture. Two types of crop
segmentation approaches can be observed – based on pixel intensity thresholding of vegetation indices and
classification-based including context (e.g. deep convolutional neural network). Threshold-based methods
work well when images do not contain disruptions (weeds, overlapping, different illumination). Although
deep learning methods can cope with the mentioned problems their development requires a large number
of labelled samples. In this study, we propose a hybrid method for the rapid development of efficient and
robust models for in-row crop segmentation, combining the advantages of described approaches. Our method
consists of two-step labelling with the generation of synthetic crop images and the following training of the
Mask R-CNN model. The proposed method has been tested comprehensively on samples characterised by
different types of disruptions. Already the first labelling step based mainly on cluster labelling significantly
increased the average F1-score in crop detection task compared to binary thresholding of vegetation indices.
The second stage of the labelling allowed this result to be increased. As part of this research, an algorithm for
row detection and row-based filtering was also proposed, which reduced the number of FP errors made during
inference.
1 INTRODUCTION
Crop growth monitoring systems (CGMS) are the ba-
sis for developing fertilisation and irrigation strategies
to meet the needs of individual crops, for selective
spraying strategies and yield prediction (Cardim Fer-
reira Lima et al., 2020). CGMS consist of two key
components – the data collection platform (e.g. un-
manned aerial vehicle (UAV)) with the camera and
the data analysis part, taking into account data pro-
cessing, machine learning models, visualisation and
interpretation of the obtained results. The main re-
quirements for CGMS include: (1) reliable, quantita-
tive information, (2) speed of inference, (3) universal-
ity and the ability to adapt quickly to new conditions,
(4) low operating cost, (5) low manufacturing cost.
The image analysis part in CGMS requires the use
of crop segmentation algorithms whose task is to ex-
tract crop pixels from other pixels. In the area of
precision agriculture, two approaches to segmenta-
tion can be observed. Threshold-based methods as-
a
https://orcid.org/0000-0001-5076-9107
b
https://orcid.org/0000-0003-1662-9762
sume pixel intensity thresholding of a single-channel
image in the form of e.g. a selected channel from a
specific colour space (e.g. Lab) or a vegetation in-
dex. The thresholds in these methods can be selected
unsupervised e.g. Otsu (Otsu, 1979), Kapur (Kapur
et al., 1985), Rosin (Rosin, 2001) thresholding or su-
pervised when the threshold value is tuned using la-
belled samples. The advantage of threshold-based
methods is the very short inference time. The second
group of methods are classification-based methods
taking into account the context, which include con-
volutional neural networks (CNN) and other classical
classifiers such as support vector machines (SVM),
k-nearest neighbours (KNN) and random forest (RF).
There are publications that have used and devel-
oped threshold-based methods. In (Qiao et al., 2020)
classical plant segmentation methods were used: Otsu
thresholding of the NIR channel and RGB vegeta-
tion index ExG (Woebbecke et al., 1995). In (Asha-
pure et al., 2019) the thresholding of RGB vegeta-
tion indices Canopeo (Patrignani and Ochsner, 2015),
ExG, MGRVI, RGBVI (Bendig et al., 2015) proved
to be the most effective method for cotton canopy ex-
274
Majewski, P. and Reiner, J.
Hybrid Method for Rapid Development of Efficient and Robust Models for In-row Crop Segmentation.
DOI: 10.5220/0010775400003124
In Proceedings of the 17th International Joint Conference on Computer Vision, Imaging and Computer Graphics Theory and Applications (VISIGRAPP 2022) - Volume 4: VISAPP, pages
274-281
ISBN: 978-989-758-555-5; ISSN: 2184-4321
Copyright
c
2022 by SCITEPRESS – Science and Technology Publications, Lda. All rights reserved
traction. In (Castillo-Mart
´
ınez et al., 2020) a plant
segmentation method based on thresholding modified
RGB vegetation indices was proposed.
Recently, the main focus has been on develop-
ing classification-based methods based on deep con-
volutional neural networks (DCNN), which are state-
of-the-art in numerous computer vision tasks. Re-
searchers have often used DCNN for precision agri-
culture and forestry problems. In (Chadwick et al.,
2020; G Braga et al., 2020) trees were segmented
and counted using Mask R-CNN (He et al., 2017)
and in (Lobo Torres et al., 2020) using SegNet
(Badrinarayanan et al., 2017), U-Net (Ronneberger
et al., 2015) and DeepLabv3 (Chen et al., 2017). In
(Machefer et al., 2020) low-density crops – potatoes
and lettuce – were segmented and counted using Mask
R-CNN. In (Bosilj et al., 2020) transfer-learning be-
tween crop types was studied for crop/weed seman-
tic segmentation with SegNet. Classification-based
methods related to DCNN achieve very high accuracy
and are characterised by high robustness.
Two directions of the development of crop seg-
mentation methods in precision agriculture are justi-
fied by the optimality of their application in specific
cases. When there is no weed infestation, crops do not
overlap, the background is homogeneous, the applica-
tion of methods of classical computer vision based on
RGB vegetation indices, automatic thresholding, blob
detection gives satisfactory results. On the other hand,
when the mentioned problems occur, the application
of the threshold-based methods is no longer optimal.
Methods based on deep learning are able to cope with
this limitation, however, training a robust model re-
quires a large number of labelled samples, which is
a considerable limitation for this approach.
The phenomena of weed infestation, shading and
overexposure are often local, resulting in a proportion
of individual crops that can be segmented by classical
methods and be the basis for developing more robust
deep learning methods. On the other hand, the use
of crop localisation patterns in the field (crops occur
in rows and the distance between rows and crops is
usually constant) can be used to assess the correctness
of class prediction for crops and non-crops.
Our research developed a hybrid method for rapid
development of efficient and robust models for in-
row crop segmentation, combining the advantages of
classical threshold-based methods and deep learning
models. It also proposed an approach to improve
model prediction by taking into account field geom-
etry and comprehensive evaluation.
2 MATERIAL AND METHODS
2.1 Dataset
The samples used in this study represent parts of
the research plot that was used to observe celery
growth during the 2019 season from June to Octo-
ber. A drone with RGB camera was used to collect
images from the field. The selected test samples rep-
resent different stages of crop growth (initial, flow-
ering, mature) and disruptions, taking into account:
weed infestation, crop overlapping, shadows, overex-
posure.
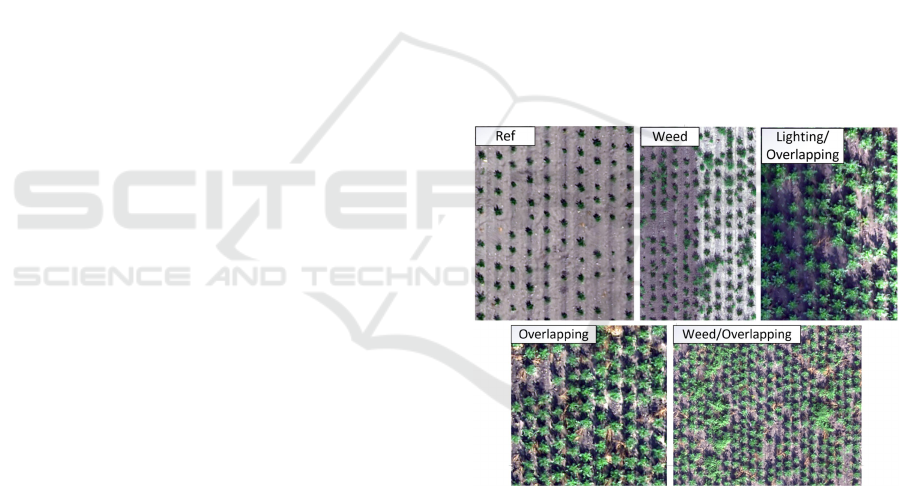
The characteristics of the selected test samples
are as follows: (1) Reference conditions (no dis-
ruptions), initial stage (Ref), (2) Only weeds, in-
homogeneous background, flowering stage (Weed),
(3) Only overlapping of crops, mature stage (Over-
lapping), (4) Weeds and overlapping of crops, ma-
ture stage (Weed/Overlapping), (5) Variable lighting
conditions and overlapping of crops, mature stage
(Lighting/Overlapping). The described test samples
are shown in Figure 1.
Figure 1: Test samples used in the study: Ref, Weed, Light-
ing/Overlapping, Overlapping, Weed/Overlapping.
Three types of labelling were used in the study. To
validate the methods in crop detection task, all crop
midpoints were labelled with point labels. Based on
these points, rows were manually identified and their
orientation was determined in the form of a row line
label. A summary of the number of point and line an-
notations for specific test samples is shown in Table 1.
Additionally, 10 areas each representing crop and
non-crop pixels (e.g. weeds, soil, etc.) were extracted
to validate the presented methods in the segmentation
task. In particular, areas that are most difficult to clas-
sify e.g. crop edges, shadows, weeds were selected.
Hybrid Method for Rapid Development of Efficient and Robust Models for In-row Crop Segmentation
275
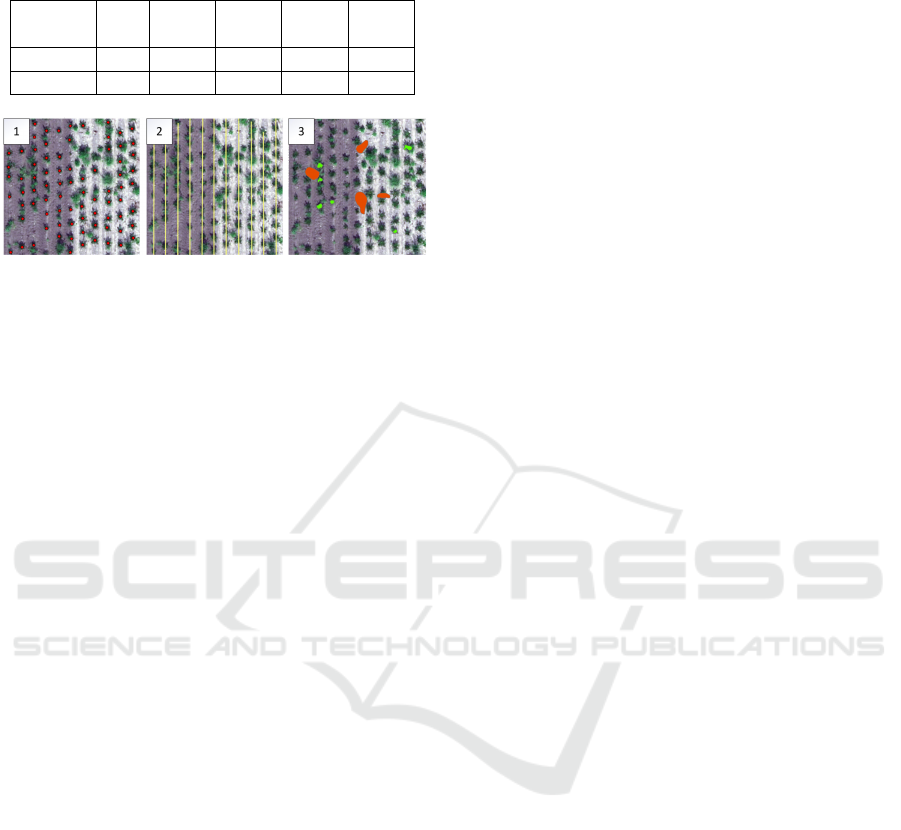
Table 1: Number of point (crops) and line (rows) annota-
tions for test samples.
Ref Weed Ligh./
Over.
Over. Weed/
Over.
crops 132 195 140 132 422
rows 10 11 10 11 22
Figure 2: Annotations used in the study: 1. Single crop
midpoints, 2. Row lines, 3. Crop and non-crop areas.
Example annotations are shown in Figure 2.
For training, fragments of the field that had no
common part with the test samples were used.
2.2 Threshold-based Segmentation with
RGB Vegetation Indices
For plant/background segmentation from RGB im-
ages, a commonly used classical method is threshold-
ing of vegetation indices of the general form:
V I(θ) = θ
R
R + θ
G
G + θ
B
B (1)
where R, G, B denote RGB image channels and
θ
R
, θ
G
, θ
B
- coeffs related to this channels.
For this study, ExG index was chosen, whose use-
fulness has been proven in many works concerning
segmentation in precision agriculture (Hamuda et al.,
2016; Riehle et al., 2020) with the form:
ExG = −R +2G − B (2)
The main assumption in determining the vegeta-
tion indices V I(θ) is that higher values of V I(θ) cor-
respond to plants and lower values to background.
Based on this fact, a binary plant/background segmen-
tation can be performed as follows:
Y
binary
predict
= (V I(θ) > T ) (3)
The use of fixed T threshold values is rarely ap-
plied because it is characterised by low robustness to
changes in image characteristics. The most common
is automatic thresholding, which determines the op-
timal threshold based on calculated statistics. Otsu
thresholding, which is typically used in combination
with RGB vegetation indices for plant/background
segmentation, was used in this study.
2.3 Segmentation with Mask R-CNN
The second type of models used in this research
are models for instance segmentation based on pre-
trained DCNNs. Mask R-CNN is a representative of
such methods and was chosen for this study due to its
widespread use among researchers.
Mask R-CNN is an extension of the Faster R-CNN
(Ren et al., 2015) algorithm for instance detection
with a segmentation part, which is a small Fully Con-
volutional Network (FCN) (Long et al., 2015). Its in-
tegral part is the so-called backbone, which is a spe-
cific convolutional neural network architecture pre-
trained on the ImageNet (Deng et al., 2009) dataset,
acting as a feature extractor. Backbone ResNet50 (He
et al., 2016) was used in this study.
The effectiveness and robustness of deep learning
models are strongly dependent on the number and va-
riety of samples prepared for training. The following
sections describe how an improved two-step labelling
process was conducted for the problems in question.
2.3.1 First Stage of Labelling for Mask R-CNN
The first labeling stage aimed to obtain a basic model
for instance segmentation very quickly. The improved
labelling process is shown in Figure 3.
Standard sample delineation is time-consuming.
To reduce the annotation time, a binary mask Y
binary
predict
obtained by thresholding the ExG index was used.
As can be seen in Figure 3 Otsu thresholding of ExG
index extracts the greenness from the background
very well. If the crops do not overlap, extracted clus-
ters of green pixels representing an individual crop
can be added to a collection of crop samples (exam-
ple individual samples selected for the collection are
marked with red rectangles in Figure 3). On the other
hand, the extracted background fragments after seg-
mentation can be added to the collection of non-
crop samples without additional user supervision.
A significant problem during instance segmentation
can be caused by green objects, which are not crops,
e.g. weeds. If they are not added to the non-crop
sample collection, the model will classify them as
crops during inference. To avoid this, it was de-
cided at the first labelling stage to label a few such ob-
jects and add them to the non-crop sample collection.
Due to frequent crop/weed overlaps, it was sometimes
necessary to manually delineate the non-crop sam-
ples. The total number of samples obtained in stage
one was 50 (including at most 10 non-crop samples),
which allowed fast labelling and a good representa-
tion of the data in the crop sample collection.
VISAPP 2022 - 17th International Conference on Computer Vision Theory and Applications
276
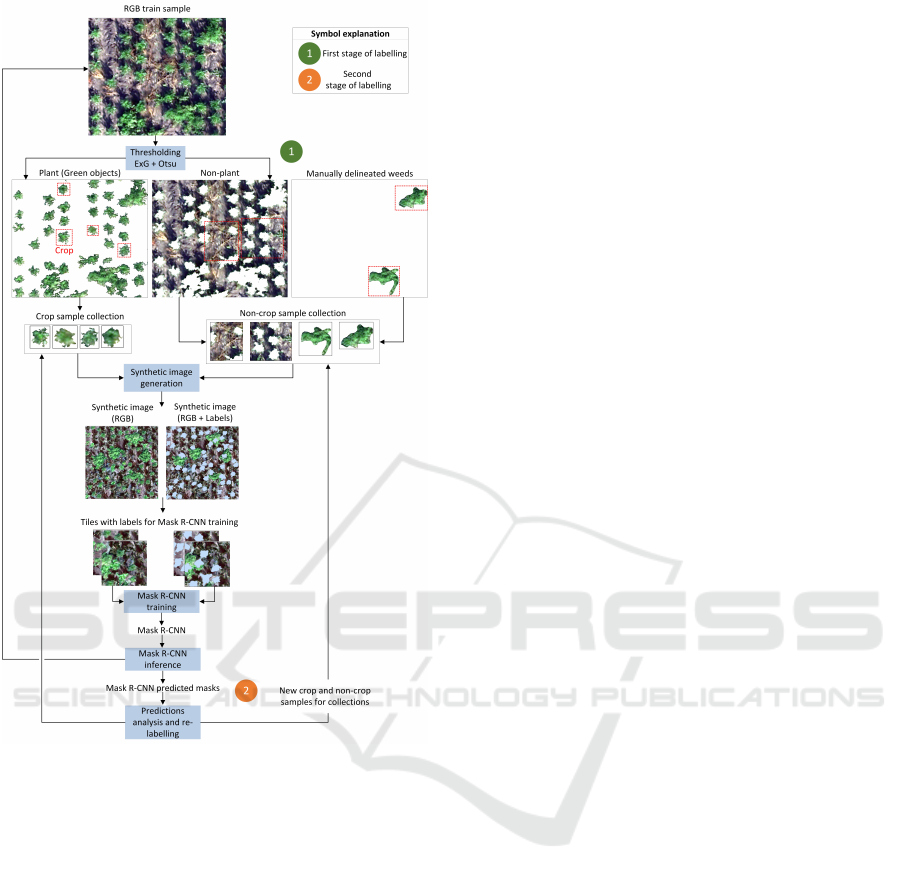
Figure 3: Conceptual scheme of the proposed method for
the development of crop segmentation models.
2.3.2 Synthetic Images Generation and Mask
R-CNN Training
The next step in preparing samples for Mask R-CNN
training is generating synthetic images. This ap-
proach has many advantages over standard instance
labelling on single images: (1) controlling the density
and overlapping of crop and non-crop objects, (2) ob-
taining accurate masks, even when the instances over-
lap and eliminating the problem of labelling cut in-
stances on the edges of images, (3) the possibility to
oversampling objects from minority classes.
The generation of synthetic images in this re-
search was conducted as follows. The input param-
eters of the proposed method were the number of
crop objects, the number of green non-crop objects
and the allowed object overlap. First, a heteroge-
neous background was generated by combining dif-
ferent non-green samples (formed after ExG+Otsu
segmentation) from the non-crop collection. Then
samples from the crop collection were placed at ran-
dom locations. Before adding the next sample, it
was checked if the overlap between the new sample
and the previous ones was smaller than acceptable.
If not, the position of the new sample was chosen
again. Adding crop samples was finished when the
specified number of samples of this class was reached.
The next step was to add green non-crop objects to
the synthetic image in the same way as crop objects.
The resulting synthetic image with its correspond-
ing mask was then divided into tiles of standard size
256, obtaining training samples for the Mask R-CNN
model, as shown in Figure 3.
2.3.3 Second Stage of Labelling for Mask
R-CNN
The second labelling stage was used to improve
the inference based on the prediction analysis of
the first model on the training samples.
During the second stage, the following objects
were labelled: (1) crops that were not detected (FN)
and formed a separate cluster (for crop collection),
(2) non-crop fragments that were detected as crops
(FP) and form a separate cluster (for non-crop collec-
tion), (3) fragments of crop and non-crop that are de-
tected as crop and form a common cluster (delineation
needed, individual fragments to crop and to non-crop
collection), (4) detected crops with a low confidence
score (< 70%).
After performing the described additional la-
belling, the selected or delineated objects were added
to the corresponding crop or non-crop collections.
The procedure for generating synthetic images and
training the Mask R-CNN model was repeated.
2.4 Crop Rows Detection and
Row-based Filtering
The crops considered in this study grew in rows. This
typical pattern for the problem undertaken can be used
to improve the detection of crops. In this section,
an algorithm for crop row detection and row-based fil-
tering will be presented.
In Figure 4 the geometric parameters of the field
used in the described methods are defined: α - slope
angle of crop row, d
row
- mean distance between rows,
d
crop
- mean distance between crops in row.
We can easily observe that the centres of the crops,
located in the same row, determine the direction of
the row. This fact was used in the designed algorithm.
For the classical segmentation method, the centres
were the midpoints of the detected blobs on the bi-
Hybrid Method for Rapid Development of Efficient and Robust Models for In-row Crop Segmentation
277
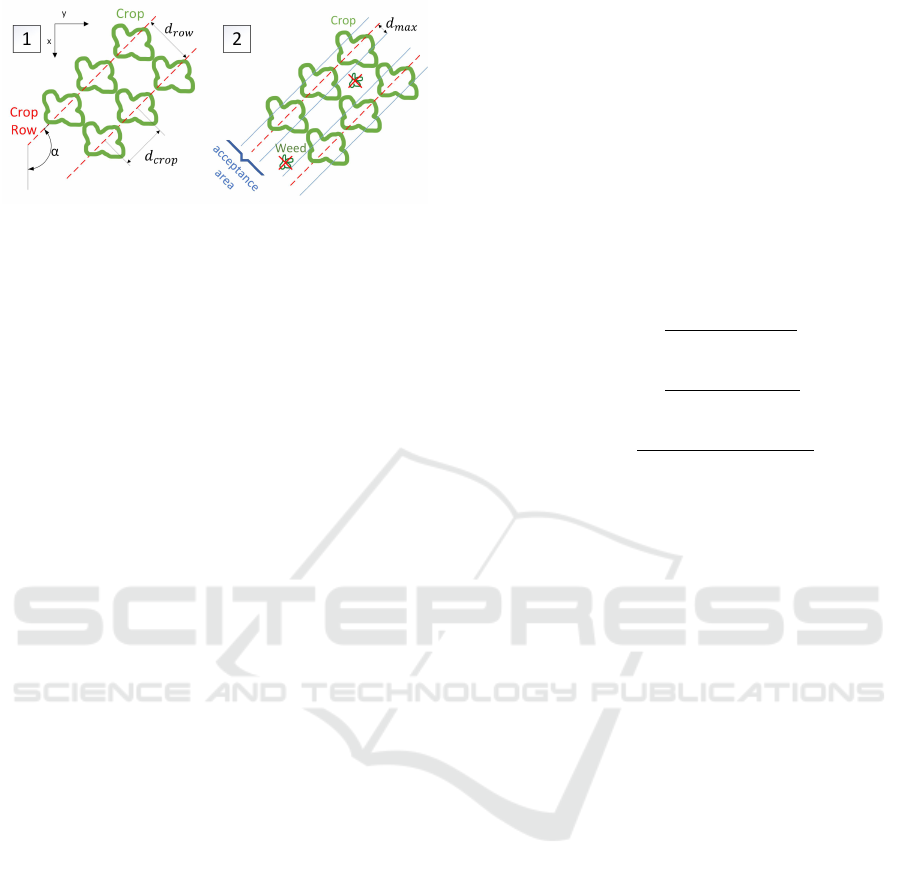
Figure 4: Basic geometric parameters of the field (1) and
the idea of row-based filtering (2).
nary mask Y
binary
predict
. The smallest blobs from this mask
were removed, as they would complicate the perfor-
mance of the algorithm. For the Mask R-CNN model,
the centres of the predicted instance masks were used.
As input parameters of the algorithm, the mini-
mum number of crops per row n
crop
and the maxi-
mum distance between crop and row d
max
were also
defined, to remove the influence of false positive crop
centres on line detection. The idea of row-based fil-
tering is shown in Figure 4. The proposed algorithm
for row detection is described in pseudocode:
Input:
S - set of centres of detected crops
alpha - angle of field rows
n_crop - min number of crops in row
d_max - max distance between crop and row
Output:
lines - sets of points belonging to rows
lines = dict()
line_counter = 1
while len(S) > 0:
xp, yp = random.choice(S)
b = yp - tg(alpha)*xp
points_in_line = {}
for each (x_i, y_i) in S:
calculate distance d_i between point
(x_i, y_i) and line with alpha and b
if d_i < d_max:
points_in_line.add((x_i, y_))
if len(points_in_line) >= n_crop:
lines[line_counter] = points_in_line
for each (x_i, y_i) in points_in_line:
S.remove((x_i, y_i))
line_counter += 1
else:
S.remove((x_p, y_p))
Due to randomness in the selection of points from
the set S, the algorithm was repeated k times. The fol-
lowing parameters were adopted for the row detection
algorithm: n
crop
= 5, d
max
= d
row
/4, k = 10.
2.5 Evaluation
The evaluation was conducted for the various tasks to
thoroughly compare the methods. This chapter de-
scribes the metrics used for the evaluation.
2.5.1 Crop Detection Metrics
The evaluation for crop detection was performed us-
ing crop midpoint annotations as in Figure 2. Three
metrics have been proposed for this problem, namely
precision (PPV
Crop
), recall (T PR
Crop
) and F1-score
(F1
Crop
), with the following formulas:
PPV
Crop
=
T P
Crop
T P
Crop
+ FP
Crop
(4)
T PR
Crop
=
T P
Crop
T P
Crop
+ FN
Crop
(5)
F1
Crop
=
2 ∗ PPV
Crop
∗ T PR
Crop
PPV
Crop
+ T PR
Crop
(6)
where T P
Crop
, FP
Crop
, FN
Crop
denotes the num-
ber of detected crops midpoints appropriately as-
signed to the type of prediction
The type of prediction (TP
Crop
, FP
Crop
or FN
Crop
)
for crop detection was determined as follows. Let
us denote as G any ground truth point and as P any
prediction point. For each such pair, let us calculate
the Euclidean distance between them d
G,P
. Next, let
us assign to each G point the nearest distance predic-
tion P with the assumption that each prediction point
can be used only once (if the same prediction is as-
signed to several Gs, the closer point G will have
priority). G points for which no P point has been
assigned (situation when there are fewer predictions
than ground truth points) are identified as FN predic-
tions. All unassigned P points are treated as FP pre-
dictions. In the situation where a point P is assigned
to G, the distance d
G,P
determines the type of predic-
tion. If d
G,P
<= d
max
then the prediction is considered
as TP. Conversely, if d
G,P
> d
max
the prediction is de-
noted as FP. The interpretation of d
max
is analogous to
Figure 4 and similarly d
max
= d
row
/4 is assumed
2.5.2 Crop Rows Detection Metrics
The evaluation for crop rows detection was performed
using a line annotations as in Figure 2. Similar to
the previous section 2.5.1, three metrics were pro-
posed, namely precision (PPV
Row
), recall (T PR
Row
)
and F1-score (F1
Row
), which were calculated based
on T P
Row
, FP
Row
, FN
Row
denoting the number of
detected crop row lines appropriately assigned to
the type of prediction.
VISAPP 2022 - 17th International Conference on Computer Vision Theory and Applications
278
The interpretation of the prediction mistakes
(T P
Row
, FP
Row
, FN
Row
) in crop row detection is anal-
ogous to the section 2.5.1 except that in this case, in-
stead of the distance between points d
G,P
, it is consid-
ered the average distance between the row line from
the ground truth l
g
and the prediction points P
i
be-
longing to the row line prediction l
p
with the formula:
d
l
g
,l
p
=
1
N
p
N
p
∑
i=1
d
P
i
,l
g
(7)
2.5.3 Segmentation Metric
The quality of segmentation was assessed using the
Intersection over Union (IoU) metric with a formula:
IoU
Seg
=
T P
seg
T P
seg
+ FP
seg
+ FN
seg
(8)
where T P
seg
, FP
seg
, FN
seg
denotes the number of
pixels appropriately assigned to the type of prediction
Evaluation for crop segmentation was performed
for marked crop and non-crop areas as in Figure 2.
3 RESULTS AND DISCUSSION
In this chapter, the following notations are adopted
for the compared approaches: (1) VegIndex for
threshold-based segmentation with ExG index
and Otsu thresholding, (2) MaskRCNN v1 for
Mask R-CNN model trained after 1st labelling stage,
(3) MaskRCNN v2 for Mask R-CNN model trained
after re-labelling in 2nd stage. A comparison of
the proposed methods is presented in Table 2.
For the Ref sample, all methods (VegIn-
dex, MaskRCNN v1, MaskRCNN v2) achieved high
scores in the crop and crop row detection tasks
(F1
Crop
> 0.99 and F1
Row
= 1) and the differences
between them were negligible. In the segmenta-
tion problem, the classical VegIndex method for Ref
achieved the highest IoU. The results for Ref show the
great usefulness of classical methods based on vegeta-
tion indices for crop segmentation in images without
disruptions in the form of weeds, overlapping.
Significant differences between the methods
MaskRCNN v1( v2) and VegIndex were observed for
images containing disruptions (Weed, Overlapping,
Weed/Overlapping, Lighting/Overlapping). Even the
first model (MaskRCNN v1) performed significantly
better than VegIndex for these test samples. For crop
detection, F1
Crop
increased from values of (0.720 -
0.774) for VegIndex to (0.914 - 0.977) for MaskR-
CNN v1. Example predictions of crop midpoints for
the considered methods are shown in Figure 5.
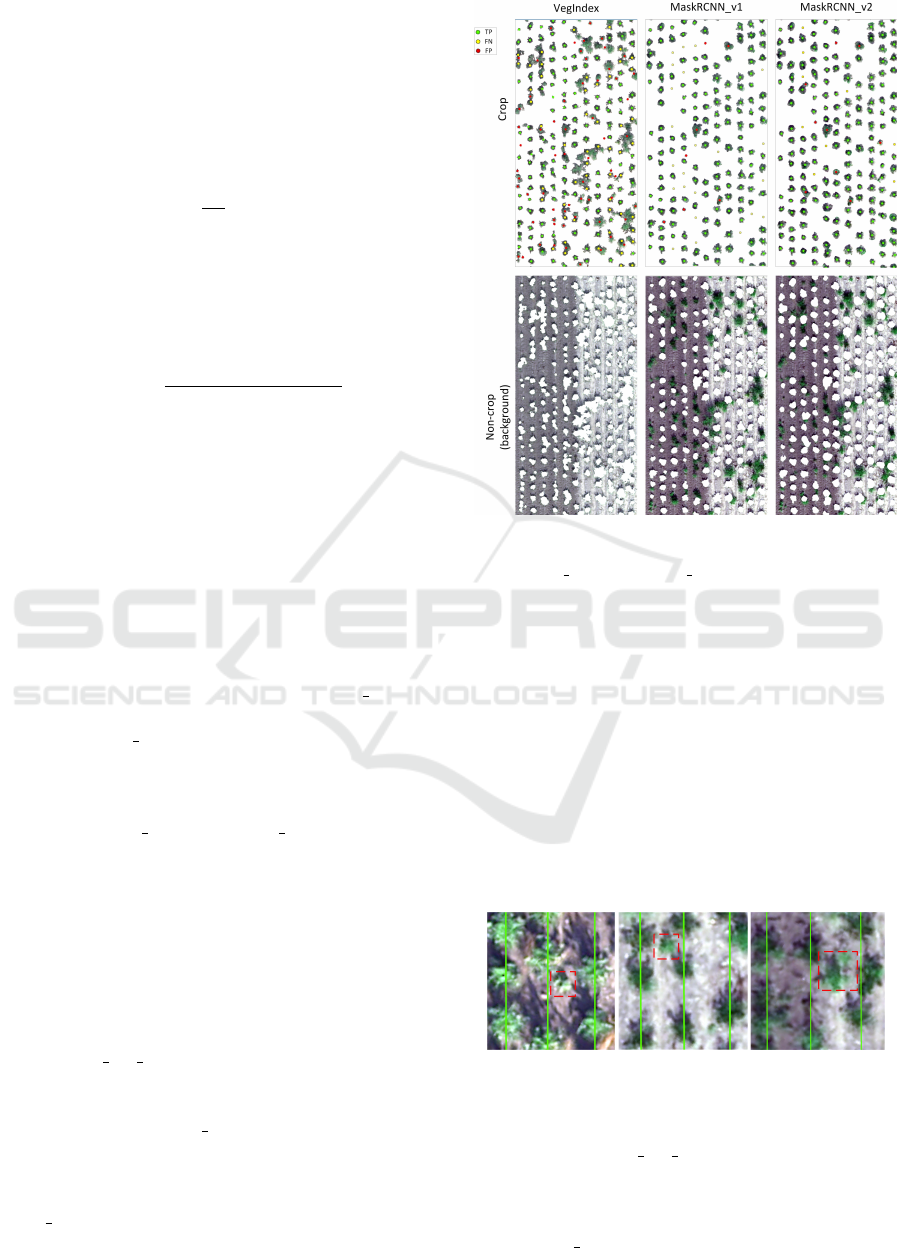
Figure 5: Crop detection and segmentation for the
Weed test sample and the analysed methods VegIndex,
MaskRCNN v1, MaskRCNN v2.
In Figure 5 we observe that the source of errors
for the VegIndex method is overlapping and weeds.
The resulting blobs after classical segmentation often
represent connected fragments of crops and weeds.
The centre of such an extracted blob is treated as FP
(red points) and the centres of the real crops contained
in this blob as FN (yellow points).
It is worth noting that in most cases (except for
Ref test sample) PPV
Crop
> T PR
Crop
for all methods.
One reason for this fact is the row-based filtering ap-
plied, which reduced the number of FP predictions.
Examples of FP crop predictions that were removed
due to row-based filtering are shown in Figure 6.
Figure 6: Examples of objects falsely classified as crop and
filtered out with row-based filtering.
For crop row detection, the predictions of the
models MaskRCNN v1( v2) made it possible to de-
tect correctly all rows in the test samples. A few er-
rors can be observed for the VegIndex method. Ex-
ample crop row predictions for the VegIndex and
MaskRCNN v2 methods are shown in Figure 7.
Hybrid Method for Rapid Development of Efficient and Robust Models for In-row Crop Segmentation
279
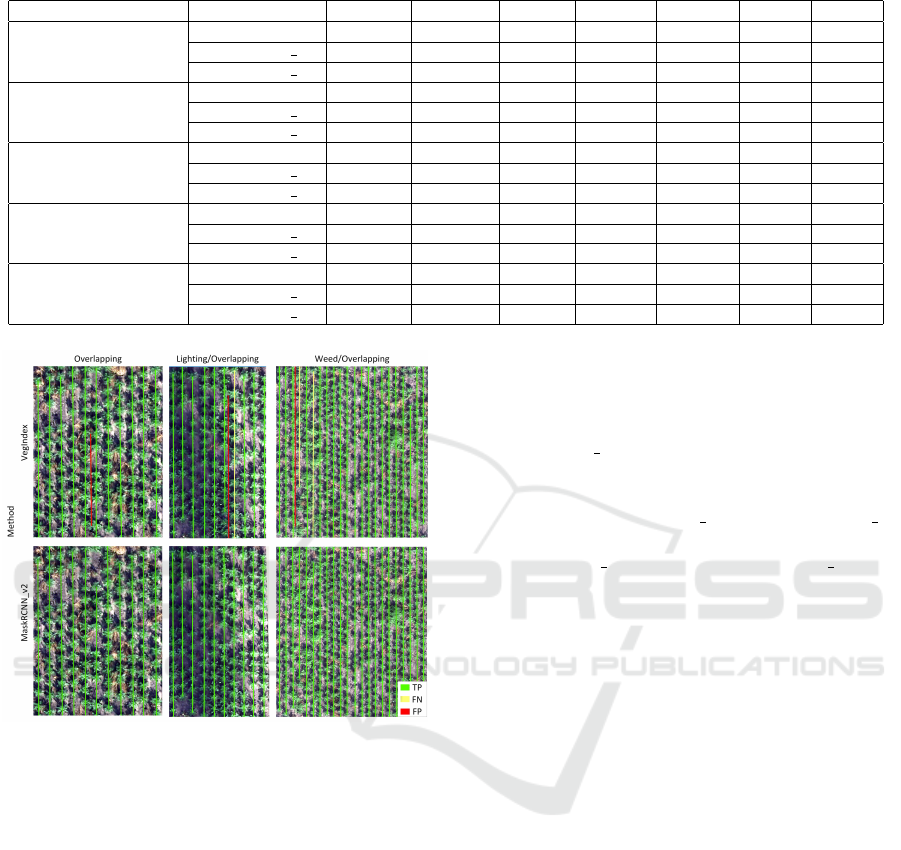
Table 2: Comparison of the proposed methods.
Dataset Method PPV
Crop
T PR
Crop
F1
Crop
PPV
Row
T PR
Row
F1
Row
IoU
Seg
Ref
VegIndex 0.985 1.000 0.992 1.000 1.000 1.000 0.780
MaskRCNN v1 0.992 0.992 0.992 1.000 1.000 1.000 0.673
MaskRCNN v2 1.000 0.992 0.996 1.000 1.000 1.000 0.686
Weed
VegIndex 0.750 0.692 0.720 1.000 1.000 1.000 0.222
MaskRCNN v1 0.960 0.872 0.914 1.000 1.000 1.000 0.630
MaskRCNN v2 0.953 0.944 0.948 1.000 1.000 1.000 0.821
Overlapping
VegIndex 0.847 0.712 0.774 0.917 1.000 0.957 0.945
MaskRCNN v1 1.000 0.955 0.977 1.000 1.000 1.000 0.825
MaskRCNN v2 1.000 0.985 0.992 1.000 1.000 1.000 0.956
Weed/Overlapping
VegIndex 0.880 0.659 0.753 0.952 0.909 0.930 0.242
MaskRCNN v1 0.972 0.912 0.941 1.000 1.000 1.000 0.849
MaskRCNN v2 0.983 0.957 0.970 1.000 1.000 1.000 0.862
Lighting/Overlapping
VegIndex 0.823 0.664 0.735 0.900 0.900 0.900 0.667
MaskRCNN v1 1.000 0.879 0.935 1.000 1.000 1.000 0.749
MaskRCNN v2 1.000 0.971 0.986 1.000 1.000 1.000 0.858
Figure 7: Line detection on Overlapping, Light-
ing/Overlapping, Weed/Overlapping test samples for
VegIndex and MaskRCNNv2 methods.
In Figure 7 two types of errors can be observed:
FP (red lines) and FN (yellow lines). Inter-row FP
lines result from the overlapping of crops from two
neighbouring rows. In such a situation the centres
of the resulting blobs after segmentation fall between
the rows and may form lines with a similar orienta-
tion as the true rows. FN lines were observed in the
Weed/Overlapping test sample. The undetected rows
in this case were characterised by high weed cover in
the row and a relatively low number of visible crops.
Despite the few errors in the prediction of the VegIn-
dex method, the proposed algorithm proved to be par-
tially robust to disruptions.
In the segmentation task, as expected, we ob-
serve low IoU values for the VegIndex method for
samples characterised by weed infestation (Weed,
Weed/Overlapping). All weed fragments are treated
as crops by the VegIndex method, which is the source
of many FP errors. Despite problems with extracting
single instances, the VegIndex method did very well
with semantic segmentation of pixels from the Over-
lapping test sample and achieved comparable results
to MaskRCNN v2 due to the lack of weeds.
From the results obtained for crop detection and
segmentation, we observe a significant improvement
comparing the MaskRCNN v1 and MaskRCNN v2
models. The average F1
Crop
increased from 0.952
for MaskRCNN v1 to 0.978 for MaskRCNN v2. Due
to the reduction of a significant number of FP er-
rors by row-based filtering, the reduction of FN errors
was mainly responsible for the improved inference of
Mask R-CNN-based models, as is shown in Figure 5
(yellow dots indicate FN) and in Table 2 by analysing
the T PR
Crop
values. This is primarily the result of
additional annotations (in the 2nd labelling step) of
crops that were not detected by the first model.
4 CONCLUSIONS
The developed hybrid method for row-based crop seg-
mentation made it possible to achieve significantly
better results than the classical segmentation method
based on vegetation indices with low user supervi-
sion. Although binary plant/background thresholding
is not able to distinguish crops from green weeds it
can be used successfully to prepare data for efficient
labelling for deep learning models, as shown in this
research. It was also demonstrated that considering
field parameters through row-based filtering reduces
mistakes made by the deep learning model.
The next steps in the development of our methods
could be the improvement of the generation of syn-
thetic samples and a method to automatically com-
plete sample collections of different classes.
VISAPP 2022 - 17th International Conference on Computer Vision Theory and Applications
280

ACKNOWLEDGEMENTS
The work was supported by National Centre for
Research and Development, Poland (NCBiR); grant
BIOSTRATEG3/343547/8/NCBR/2017.
REFERENCES
Ashapure, A., Jung, J., Chang, A., Oh, S., Maeda, M., and
Landivar, J. (2019). A comparative study of rgb and
multispectral sensor-based cotton canopy cover mod-
elling using multi-temporal uas data. Remote Sensing,
11(23):2757.
Badrinarayanan, V., Kendall, A., and Cipolla, R. (2017).
Segnet: A deep convolutional encoder-decoder ar-
chitecture for image segmentation. IEEE transac-
tions on pattern analysis and machine intelligence,
39(12):2481–2495.
Bendig, J., Yu, K., Aasen, H., Bolten, A., Bennertz, S.,
Broscheit, J., Gnyp, M. L., and Bareth, G. (2015).
Combining uav-based plant height from crop surface
models, visible, and near infrared vegetation indices
for biomass monitoring in barley. International Jour-
nal of Applied Earth Observation and Geoinforma-
tion, 39:79–87.
Bosilj, P., Aptoula, E., Duckett, T., and Cielniak, G. (2020).
Transfer learning between crop types for semantic
segmentation of crops versus weeds in precision agri-
culture. Journal of Field Robotics, 37(1):7–19.
Cardim Ferreira Lima, M., Krus, A., Valero, C., Barri-
entos, A., Del Cerro, J., and Rold
´
an-G
´
omez, J. J.
(2020). Monitoring plant status and fertilization strat-
egy through multispectral images. Sensors, 20(2):435.
Castillo-Mart
´
ınez, M.
´
A., Gallegos-Funes, F. J., Carvajal-
G
´
amez, B. E., Urriolagoitia-Sosa, G., and Rosales-
Silva, A. J. (2020). Color index based thresholding
method for background and foreground segmentation
of plant images. Computers and Electronics in Agri-
culture, 178:105783.
Chadwick, A. J., Goodbody, T. R., Coops, N. C., Hervieux,
A., Bater, C. W., Martens, L. A., White, B., and
R
¨
oeser, D. (2020). Automatic delineation and height
measurement of regenerating conifer crowns under
leaf-off conditions using uav imagery. Remote Sens-
ing, 12(24):4104.
Chen, L.-C., Papandreou, G., Schroff, F., and Adam,
H. (2017). Rethinking atrous convolution for
semantic image segmentation. arXiv preprint
arXiv:1706.05587.
Deng, J., Dong, W., Socher, R., Li, L.-J., Li, K., and Fei-
Fei, L. (2009). ImageNet: A Large-Scale Hierarchical
Image Database. In CVPR09.
G Braga, J. R., Peripato, V., Dalagnol, R., P Ferreira, M.,
Tarabalka, Y., OC Arag
˜
ao, L. E., F de Campos Velho,
H., Shiguemori, E. H., and Wagner, F. H. (2020). Tree
crown delineation algorithm based on a convolutional
neural network. Remote Sensing, 12(8).
Hamuda, E., Glavin, M., and Jones, E. (2016). A survey of
image processing techniques for plant extraction and
segmentation in the field. Computers and Electronics
in Agriculture, 125:184–199.
He, K., Gkioxari, G., Doll
´
ar, P., and Girshick, R. (2017).
Mask r-cnn. In Proceedings of the IEEE international
conference on computer vision, pages 2961–2969.
He, K., Zhang, X., Ren, S., and Sun, J. (2016). Deep resid-
ual learning for image recognition. In Proceedings of
the IEEE conference on computer vision and pattern
recognition, pages 770–778.
Kapur, J. N., Sahoo, P. K., and Wong, A. K. (1985). A new
method for gray-level picture thresholding using the
entropy of the histogram. Computer vision, graphics,
and image processing, 29(3):273–285.
Lobo Torres, D., Queiroz Feitosa, R., Nigri Happ, P., Elena
Cu
´
e La Rosa, L., Marcato Junior, J., Martins, J.,
Ol
˜
a Bressan, P., Gonc¸alves, W. N., and Liesenberg,
V. (2020). Applying fully convolutional architectures
for semantic segmentation of a single tree species in
urban environment on high resolution uav optical im-
agery. Sensors, 20(2):563.
Long, J., Shelhamer, E., and Darrell, T. (2015). Fully con-
volutional networks for semantic segmentation. In
Proceedings of the IEEE conference on computer vi-
sion and pattern recognition, pages 3431–3440.
Machefer, M., Lemarchand, F., Bonnefond, V., Hitchins,
A., and Sidiropoulos, P. (2020). Mask r-cnn refitting
strategy for plant counting and sizing in uav imagery.
Remote Sensing, 12(18):3015.
Otsu, N. (1979). A threshold selection method from gray-
level histograms. IEEE transactions on systems, man,
and cybernetics, 9(1):62–66.
Patrignani, A. and Ochsner, T. E. (2015). Canopeo: A pow-
erful new tool for measuring fractional green canopy
cover. Agronomy Journal, 107(6):2312–2320.
Qiao, L., Gao, D., Zhang, J., Li, M., Sun, H., and Ma, J.
(2020). Dynamic influence elimination and chloro-
phyll content diagnosis of maize using uav spectral
imagery. Remote Sensing, 12(16):2650.
Ren, S., He, K., Girshick, R., and Sun, J. (2015). Faster
r-cnn: Towards real-time object detection with region
proposal networks. arXiv preprint arXiv:1506.01497.
Riehle, D., Reiser, D., and Griepentrog, H. W. (2020). Ro-
bust index-based semantic plant/background segmen-
tation for rgb-images. Computers and Electronics in
Agriculture, 169:105201.
Ronneberger, O., Fischer, P., and Brox, T. (2015). U-net:
Convolutional networks for biomedical image seg-
mentation. In International Conference on Medical
image computing and computer-assisted intervention,
pages 234–241. Springer.
Rosin, P. L. (2001). Unimodal thresholding. Pattern recog-
nition, 34(11):2083–2096.
Woebbecke, D. M., Meyer, G. E., Von Bargen, K., and
Mortensen, D. A. (1995). Color indices for weed iden-
tification under various soil, residue, and lighting con-
ditions. Transactions of the ASAE, 38(1):259–269.
Hybrid Method for Rapid Development of Efficient and Robust Models for In-row Crop Segmentation
281
