
Automatic Detection of Timed-up and Go Tests with IMU Sensor Data
Franz Kroll, Sven Löffler, Ilja Becker and Petra Hofstedt
Brandenburg University of Technology, Cottbus, Germany
Keywords:
Timed-up and Go, Machine Learning, Wearable Devices, Activity Recognition, Accelerometer, Gyroscope,
Physical Activities, Assessment System, Automatic Segmentation.
Abstract:
The evaluation of the current state and examination of geriatric patients is a time consuming process for
the medical staff and the patients. The independence of the geriatric patients is further reduced through the
interruptions in their daily life caused by these examinations. One of these evaluation techniques is the so
called Timed-Up and Go test (TUG). The test uses a simple sequence of motions to assess the fall risk of a
person. Advances in the technology of wearable sensors and machine learning make it possible to automate
these evaluation methods with a compact system. This paper continues the research that was already done in
the fields of human activity recognition and automatic TUG detection and proposes a novel method for the
automatic detection of the Timed-Up and Go without interrupting the daily life of the patients.
1 INTRODUCTION
The number of geriatric patients in German hospitals
alone rose by around 80 percent from 2006 to 2015
(Augurzky et al., 2017). This number will probably
continue to rise in the future due to the aging popula-
tion in Germany. This phenomenon can also be seen
in other countries.
To make the everyday life easier for geriatric pa-
tients and the associated nursing staff, the automation
of geriatric techniques and examination procedures
should be investigated. One of these geriatric proce-
dures is the so called Timed-Up and Go test (TUG). It
was originally developed by Podsiadlo and Richard-
son in 1991 as an extension to the Get-Up and Go
test (Podsiadlo and Richardson, 1991). The person
to be examined stands up from a chair, walks 3 m,
turns around, walks back and sits down. The time
needed for this movement is measured and subse-
quently gives a rough measure for the fall risk of the
person.
In the following we will briefly examine the re-
search that has already been done in the fields of hu-
man activity recognition and automation of the TUG.
However of the in Section 2 examined papers, none
present a complete solution for the automatic detec-
tion of the TUG or they additionally use video cam-
eras. Our approach deliberately avoids the use of
cameras in favor of a less complex and more privacy
friendly system.
The rest of this paper will introduce and evalu-
ate a method for the realization of a completely au-
tomated TUG that doesn’t interrupt the daily life of
the patients. This is done with the help of sensor data
(collected with an inertial measurement unit (IMU))
and different machine learning methods. Our scenario
also represents a realistic scenario for the use of such
methods in a real life situation, because the collected
data for the training and evaluation of the classifiers
represents a quite diverse dataset from multiple, dif-
ferent sources.
Outline. The rest of this article is structured as fol-
lows: The next Section gives an overview of re-
lated work corresponding to human activity recogni-
tion and the automated detection and segmentation of
Timed-Up and Go tests. Section 3 introduces the used
hardware, software and the experimental setup. The
following Section 4 describes the developed proce-
dure in detail, while Section 5 shows the experimental
results. The last section gives a conclusion and also
presents possible future extensions and improvements
of the developed method.
2 RELATED WORK
Many papers have already dealt with the topics of hu-
man activity recognition and the automation of the
TUG. Comparatively, approaches, where video cam-
Kroll, F., Löffler, S., Becker, I. and Hofstedt, P.
Automatic Detection of Timed-up and Go Tests with IMU Sensor Data.
DOI: 10.5220/0010775300003123
In Proceedings of the 15th International Joint Conference on Biomedical Engineering Systems and Technologies (BIOSTEC 2022) - Volume 1: BIODEVICES, pages 15-24
ISBN: 978-989-758-552-4; ISSN: 2184-4305
Copyright
c
2022 by SCITEPRESS – Science and Technology Publications, Lda. All rights reserved
15

eras are used are considered as well. Although the
proposed method forgoes the use of video cameras
or other ambient sensors (see Section 3 for an ex-
planation), they are used in a lot of other similar ap-
proaches.
The following sections first describe related work
in the field of human activity recognition and sec-
ondly in the field of the automation and automatic
evaluation of the TUG.
2.1 Human Activity Recognition
A fair amount of research has been done in the field
of human activity recognition. This section presents
methods with relevancy to the human activity recog-
nition method presented in this paper.
A lot of systems use smartphones, presumably
because their ease of use. With a smartphone and
its inbuilt sensors, one can build a system with only
one hardware component. However the reliance on
a smartphone makes these systems not very fitting for
the use with elderly persons or persons with dementia.
One of these systems was developed by Kwapisz et al.
It uses a single smartphone carried in the front pants
leg pocket for data collection. Furthermore it uses
a multilayer perceptron among other algorithms and
reached an overall accuracy of 91.7% while classify-
ing different daily activities (Kwapisz et al., 2011).
The research in the works of (Attal et al., 2015),
(Liu et al., 2017) and (Paraschiakos et al., 2020) all
concentrated on developing a system for tracking the
activity of elderly people using wearable sensors. All
three systems propose a system in which two or more
wearables are attached to the body of the person. At-
tal et al. examined the use of the k-nearest neigh-
bors (k-NN), support-vector machine (SVM), Gaus-
sian mixture model (GMM), and random forest (RF)
algorithms for the evaluation of the sensor data col-
lected from healthy subjects. The system is able to
recognize twelve different activities with k-NN reach-
ing the highest accuracy and precision (99.25% and
98.85%, respectively) after a previous feature extrac-
tion step. Paraschiakos et al. proposed a similar ap-
proach focusing only on a random forest classifier.
They found that the combination of data from an ac-
celerometer mounted on the ankle and wrist showed
the best results. The system is able to detect 16 move-
ments with an accuracy of above 85% when addi-
tional physiological data is used. The accuracy is
further increased when the number of classes is re-
duced, with seven classes (lying down, sitting, stand-
ing, household, walking, cycling, jumping) providing
the best results.
Contrary to the other systems, (Liu et al., 2017)
used a rule-based algorithm. It works by first detect-
ing if the filtered data from the wearables represents a
static posture or dynamic activity. Static postures are
detected by estimating the orientation of the different
wearables. The rule-based algorithm detects activities
and activity transfers by examining the transitions be-
tween the postures. Overall they reached a detection
rate of 97.2%.
2.2 Automating the TUG
To complete the previous section, this section exam-
ines papers which already dealt with the topic of an
automatic segmentation of the different parts of the
TUG or automatic fall risk calculation for the partici-
pating persons.
(Green, 2018) developed a method, which is able
to automatically segment the data (the test was split
into seven segments: Sitting, Standing-Up, Walking-
Forward, Turning, Walking-Back, and Sitting-Down)
of a TUG. The start of the segments could be recog-
nized with an accuracy of 83.6% and their duration
with an accuracy of 83.4%. However the system re-
lied on video-based training data, which makes the
initial data collection more time consuming.
(Nguyen et al., 2015) also developed a similar sys-
tem. Two modified TUGs with an extended length of
5m and 10 m of the walking path of the TUG were
tested. The system using the longer walking path of
10m was able to detect a simplified set of activities
(standing, walking, turning, and sitting) with a sen-
sitivity and specificity of 100%. However the sys-
tem used 17 inertial motion sensors. Data from the
sensors was detrended, normalized and band pass fil-
tered. This reveals kinematic peaks, which were used
to identify the different activities by picking out the
minima or maxima next to these peaks.
A different approach was considered by (Seo
et al., 2019). Its goal was to develop a fall predic-
tion model based on the instrumented TUG (iTUG) (it
improves the limitations of the standard TUG (Weiss
et al., 2011)). 69 subjects were included in the study
and performed a yearly iTUG using an IMU sensor
system. All in all 26 people fell during the duration,
43 didn’t experience a fall. The developed logistic re-
gression model was able to distinguish between fall-
ers and non-fallers with an accuracy of 69.9% and
used five variables (duration of the total and the sit-
to-stand phase, peak velocity of trunk sagittal plane
and range of motion of trunk horizontal plane during
gait phase and peak turn velocity during the turn to sit
phase) for the classification.
As one can see, much research has been done in
the field of automatic TUG-detection. However none
BIODEVICES 2022 - 15th International Conference on Biomedical Electronics and Devices
16
of the examined systems present a fully automatic
TUG detection without any user interaction.
3 WEARABLE AND
EXPERIMENTAL SETUP
This section describes the hardware and software that
was used in more detail. The following section de-
scribes the “Movesense Active” wearable used for the
data collection in more detail. The second section de-
picts the experimental setup used for the data collec-
tion and for testing the developed method.
3.1 Movesense Wearable
The system uses a wearable from the company “Su-
unto” (Suunto, 2021). The so-called “Movesense Ac-
tive” (see Figure 1) is based on a Nordic Semicon-
ductor system on a chip and has the following main
features (Suunto, 2020b).
The main system on a chip is a nRF52832 and in-
tegrates a 32-bit ARM-Cortex-M4, 64 kB of on-chip
RAM, 512 kB of on-chip FLASH and a Bluetooth
Low Energy (BLE) Radio. Its sensors include an ac-
celerometer, gyroscope and magnetometer (as a com-
bined inertial measurement unit). Other (not used)
sensors are a temperature sensor and a heart rate sen-
sor.
Further notable features are 3 Mbit of EEPROM
logging memory and a status LED. The wearable is
powered by an exchangeable CR 2025 Lithium coin
cell battery. Its long battery runtime (up to multi-
ple months, depending on the use case) and multi-
ple sensors, combined with the ease of use make the
Movesense Active a great choice for an autonomous
movement detection system. Multiple hardware (a
belt and different attachment straps) for attaching the
wearable to the body is also included in the developer
kit.
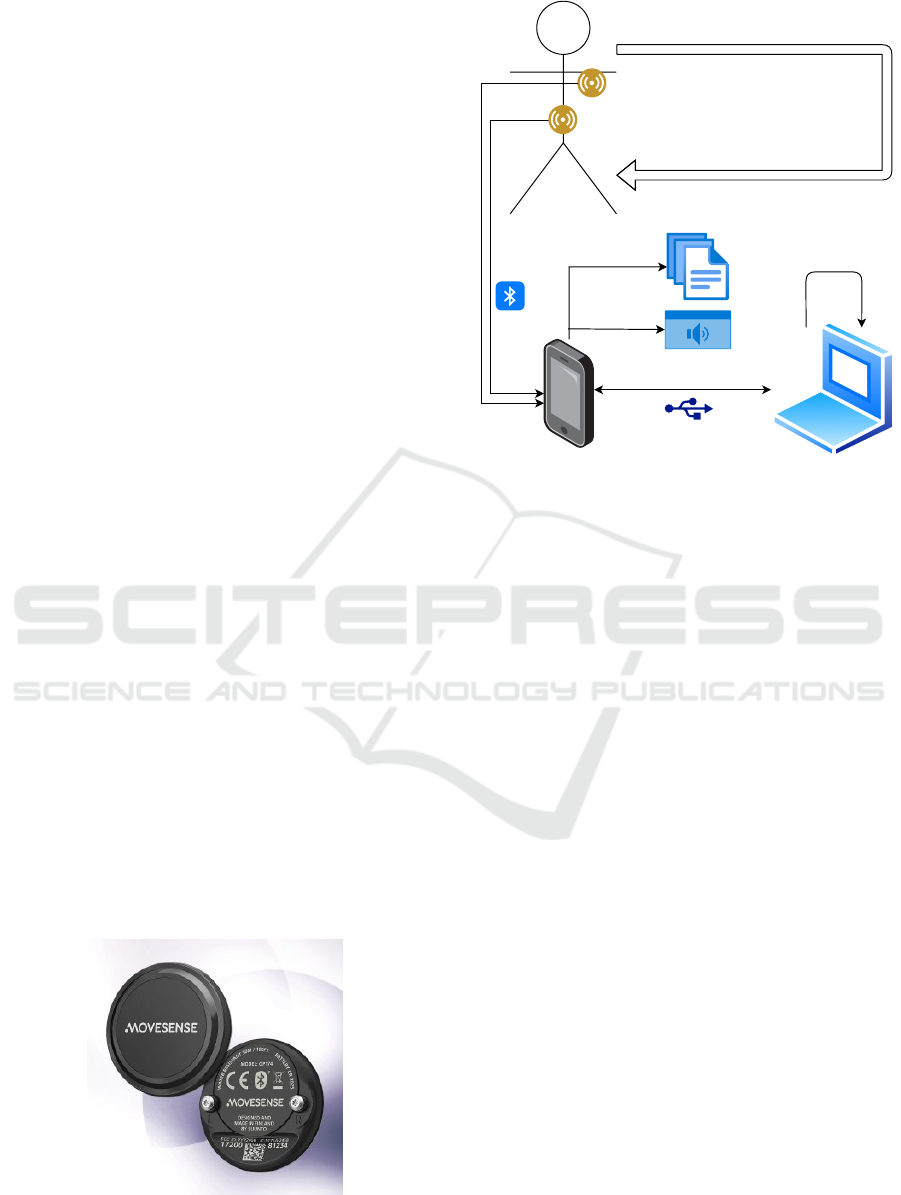
Figure 1: Movesense Active wearable (Suunto, 2021).
Smartphone
Actor
Laptop
Perform TUG or
other movements
Save collected
data
Stream IMU data
Wearable 1
Wearable 2
Develop app, create
and evaluate
models
Figure 2: Visualization of the experimental setup.
As described in Section 2, other work in this field
often uses additional video cameras or ambient sen-
sors. The proposed method forgoes this choice of
hardware on purpose for a more compact and easy to
use system. This also makes the system more compli-
ant with current rules of data protection and privacy,
as less personal data is collected.
3.2 Software and Experimental Setup
More hardware and software was used in addition to
the actual Movesense Wearables. This section shows
the complete experimental setup. Figure 2 shows a
visualization of the experimental setup which is ex-
plained in detail in the following paragraphs.
Two different smartphones (Google Pixel 3a and
Xiaomi Redmi Note 5) based on the Android oper-
ating system were used for the data collection and
recording via Bluetooth. However any modern An-
droid smartphone with a BLE version of greater than
4.2 should suffice for the data collection. An Android
application was developed in Android Studio and with
the help of the provided Movesense software develop-
ment kit (SDK) (Suunto, 2020a) to realize the data
collection in a user-friendly way. The SDK offers
multiple ways of interacting with the wearable. The
developed application communicates with the wear-
able via Bluetooth and receives data from up to two
Movesense wearables. The raw sensor data is then
formatted and saved on the device in the CSV format.
At first a Bluetooth connection is established with
Automatic Detection of Timed-up and Go Tests with IMU Sensor Data
17
up to two wearables. The wearables are worn by the
user on a belt (centered on the front pelvis) and right
upper arm (attached to the sleeve with the provided
clip and with the wearable facing outwards). After-
wards the connection status is displayed in the mobile
application and a query of the battery status is pos-
sible. The data collection can be started through a
different menu. The smartphone then receives data
from the multiple sensors (X,Y and Z axes from ac-
celerometer, gyroscope and magnetometer) continu-
ously, formats the data and saves it to a file on the
smartphone. If required, a simultaneous audio record-
ing is also possible, this function was used for eval-
uation of the TUG detection (see Section 5.2). The
audio is recorded using the microphone of the smart-
phone. The data files can be subsequently read from
the smartphone via a USB connection.
The application could also be expanded to a fully
working prototype in a further development stage. For
that, another menu could be easily integrated into the
app. This menu could start or stop the automatic de-
tection of TUGs. A second additional view could
show a simple menu with an overview of the last de-
tected TUGs and their calculated durations. In a later
stage the algorithm could also be implemented on any
device with enough computation capacity (for exam-
ple a Raspberry Pi or other small computation devices
with the required connectivity could be used as a hub
and detection unit with automatic submission of the
recorded TUG sequences to the medical staff).
4 RECOGNITION OF TUG
SEQUENCES
In this section the method developed for the human
activity recognition and automatic TUG detection is
introduced.
The next section details the data collection and the
type of data that was collected. Next the preprocess-
ing of the data is described, including data formatting
and feature extraction with the help of the Short-time
Fourier transform. Finally, the human activity classi-
fication and afterwards the TUG detection algorithm
are presented.
4.1 Data Acquisition
Data is needed for the training of the different ma-
chine learning methods and verification of the devel-
oped method. Therefore multiple datasets were col-
lected from volunteers. This section describes the dif-
ferent datasets, the amount of collected data and how
it was collected.
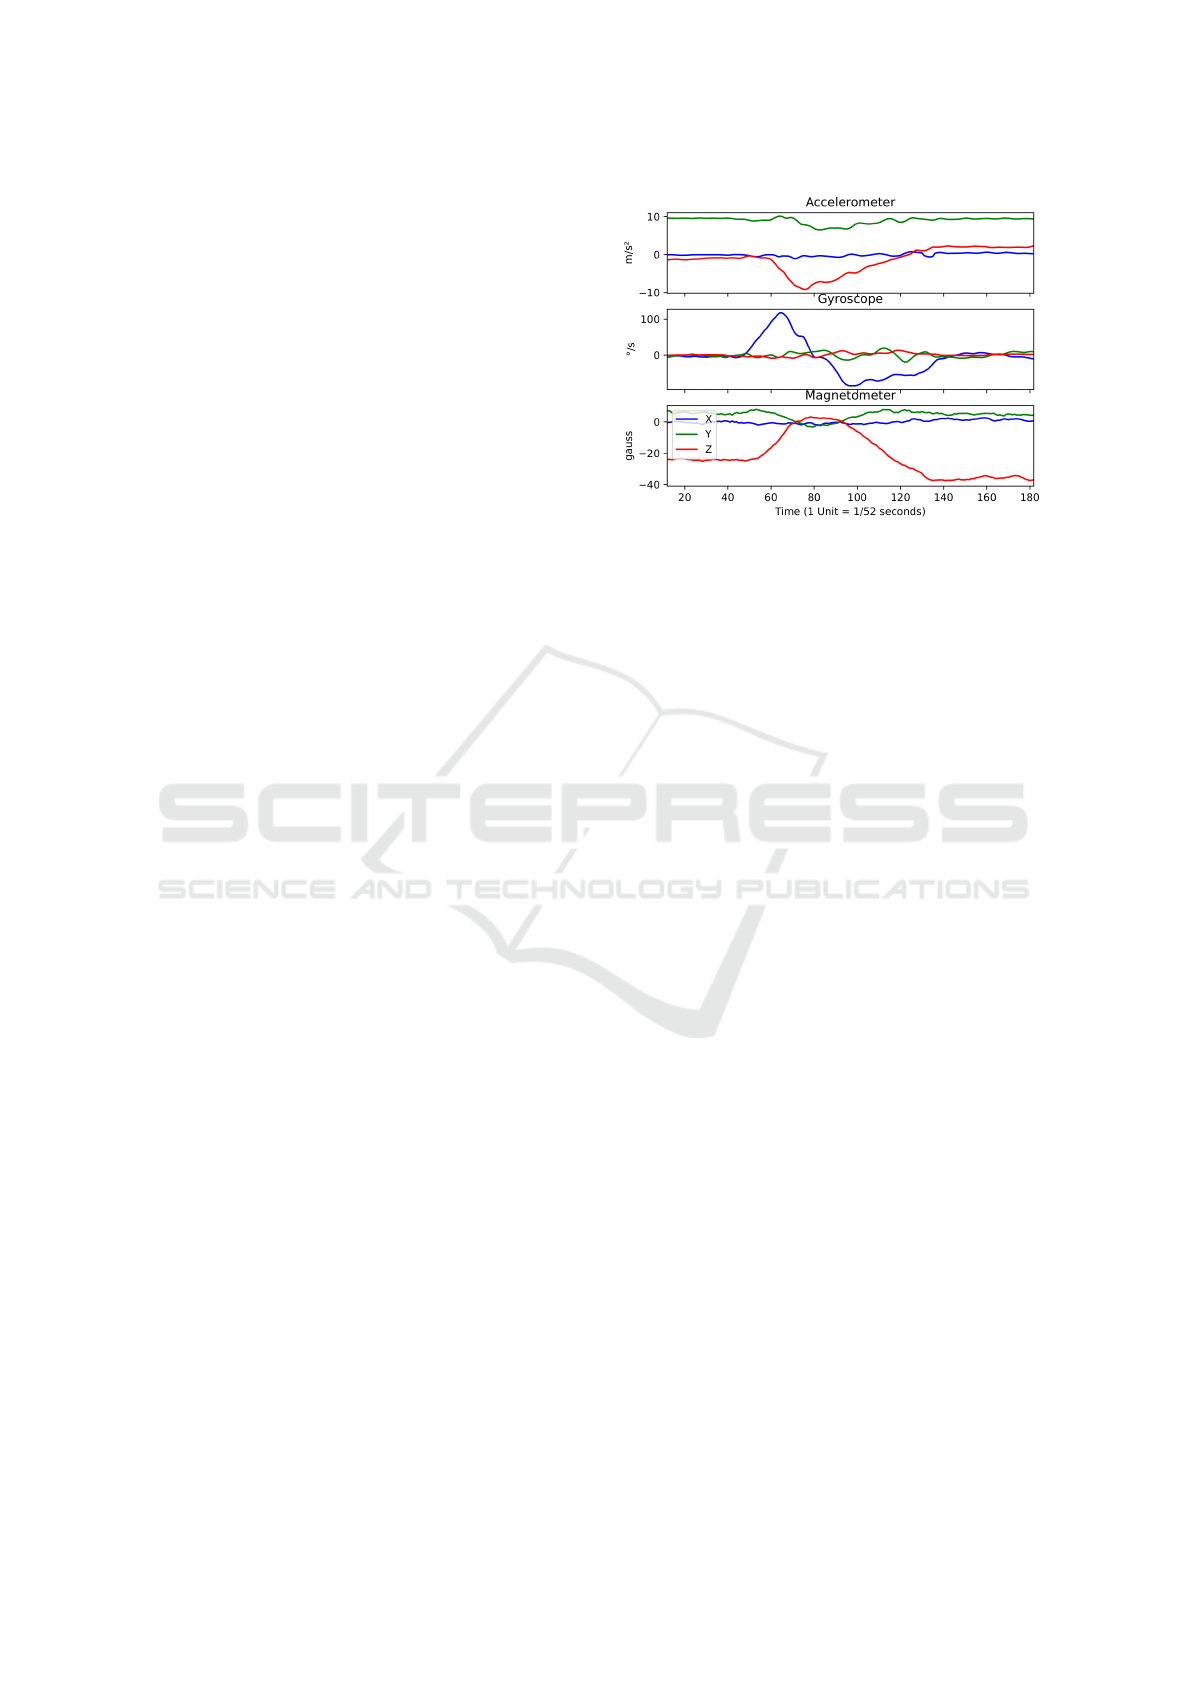
Figure 3: Accelerometer data from the movement of stand-
ing up from a chair. Recorded by a wearable worn on the
belt.
Data was collected from two different sources.
One of the collected datasets came from volunteers
from the department of “Programming Languages
and Compiler Construction” (Brandenburg University
of Technology). Multiple students and staff collected
the majority of the datasets and all of the audio data
recordings. The other source of data was the nursing
home “ASB Alten- und Pflegeheim Betriebs gGmbH
Haus Abendsonne” in Frankfurt (Oder). Several el-
derly inhabitants collected data consisting of different
movements and activities.
People were able to record different movements
on their own without supervision, which could in-
troduce possible errors in the data collection. This
was done to comply with the public health guide-
lines resulting from the COVID-19 pandemic at the
time of the experiments. The list of possible move-
ments was: walking, sitting, standing, getting up, sit-
ting down and complete TUG sequences. Sitting and
standing were later combined into “Resting Position”.
The recording of movements at the ASB in Frankfurt-
Oder was supervised by the local nursing stuff, which
received a brief introduction prior to the data collec-
tion.
In total data was recorded from 21 (of which eight
were recorded by elderly inhabitants) different per-
sons. All in all 432 different movement files (every
file contains a single movement, e.g. walking, resting
position, turning, getting up, sitting down or TUG)
could be extracted from the recorded data. Figure 3
shows an example of a filtered data recording from
all three sensors (accelerometer, gyroscope, magne-
tometer) of a user standing up from a chair (all three
sensor use the same labels for the x-axis). The dif-
ferent phases of getting up from the chair are clearly
visible in the sensor data. The wearer leans forward
BIODEVICES 2022 - 15th International Conference on Biomedical Electronics and Devices
18
after sitting still, gets up, then leans backwards and
finally stands still again.
The final developed algorithm only uses the data
from the accelerometer and gyroscope and omits the
data collected by the magnetometer. We found that
the data from the magnetometer is subject to inter-
ferences in the current environment, more specifically
from electronics and ferromagnetic materials and thus
doesn’t provide reliable enough data for training the
different machine learning algorithms.
Finally, there was another type of data collected
for the verification of the human activity recognition
which consisted of the sensor data stream combined
with an audio recording. This audio recording was
synchronized with the sensor data and contained com-
ments from the user that documented which move-
ment were executed. Both the audio and movement
files are annotated with timestamps in Universal Time
Coordinated (UTC) for synchronization. Almost ar-
bitrary movements and different TUGs were recorded
in this step to allow for a realistic evaluation.
4.2 Preprocessing of the Data
The collected sets of raw sensor data were evaluated
and the usable segments extracted. Afterwards its fea-
tures were extracted with the help of the Short-time
Fourier transform. This process is described in this
section.
Formatting of the Data. First the collected data
had to be surveyed and formatted manually. Some-
times the recorded data contained assumed measure-
ment errors (spikes or discontinuities in the data) or
human errors made while collecting the data. Data
with such errors was discarded and not used in the
training of the machine learning algorithms. Move-
ment data was extracted from the remaining datasets.
When extracting the movements, care was taken to
choose roughly the same size of excerpts whenever
possible. However the sizes of the excerpts range
from around 74 to 514 samples (≈ 1.4 s to 9.9s at
a sampling rate of 52 Hz) because of the different
lengths of the movements. Datasets containing com-
plete TUG sequences were used for the extraction of
movements as well as for the verification of the auto-
matic TUG detection.
Sliding Window Approach and Short-time Fourier
Transform. To reduce the input size for the ma-
chine learning algorithms and to extract the most im-
portant features (namely the change of the frequency
spectrum over time), the Short-time Fourier transform
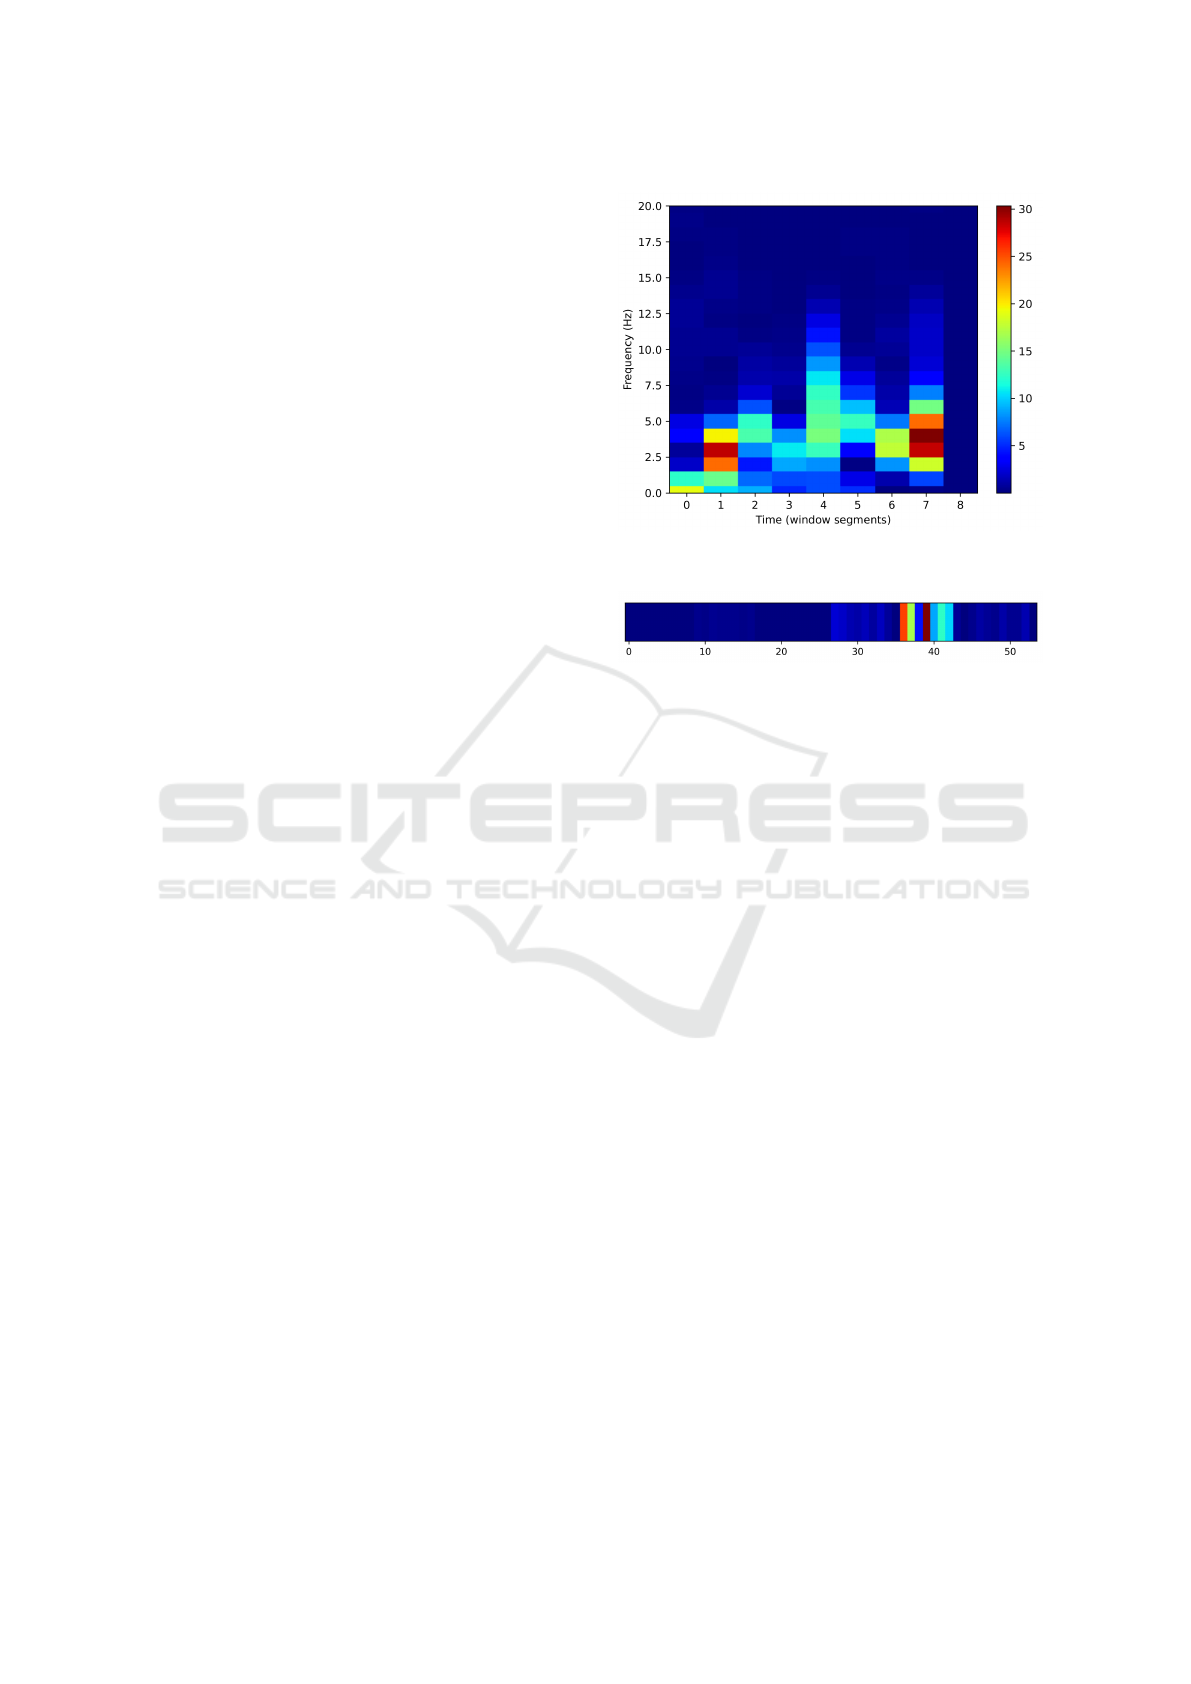
Figure 4: Visualization of a Short-time Fourier transform of
data from one gyroscope axis of a single movement.
Figure 5: Complete calculated averages of the previously
shown data in Figure 4 from a walking sequence. Averaged
data from the accelerometer (x = 0, . . . , 26) and gyroscope
(x = 27, . . . , 53) is shown.
(STFT) was used. The Python code used for the im-
plementation of the STFT was adapted from (Nelson,
2014).
First, the size of the individual STFT segments is
calculated by dividing the input size by four. This
guarantees a similar output size for movements of dif-
ferent original lengths. Every movement is then split
into multiple windows of this predetermined size. Af-
terwards we can calculate the STFT of every segment.
Figure 4 shows a visualization from an example
of the Short-time Fourier transform applied to sen-
sor data from a walking movement (specifically from
one of the axis of the accelerometer) from a healthy
test subject. The x-axis of the diagram represents the
different segments that result from the sliding win-
dow algorithm used by the STFT. The y-axis shows
the calculated intensity of the different frequency con-
tents in each step.
Data from all six axes is then averaged, meaning
that the average frequency intensity of every window
segment (x-axis of Figure 4) is calculated. The exam-
ple in Figure 4 results in nine average values. This is
then done for every axis of the accelerometer and gy-
roscope, resulting in 54 values for our example (see
Figure 5). This approach was inspired by the method
used in (Mühle, 2019) for pre-processing audio sensor
data.
All in all every movement is converted to an ar-
ray containing 48 to 54 average values. Not all ar-
Automatic Detection of Timed-up and Go Tests with IMU Sensor Data
19

rays have size 54 due to fluctuations in the size of the
different movements. In that case the last entries are
filled with high values to guarantee similar input sizes
for the next step. These pairs (each consisting of an
array and a label) can then be used for training the
different machine learning models.
4.3 Classification of Activities
Four different machine learning algorithms were eval-
uated for the classification of the sensor data. All
models were trained with the help of the Scikit-
learn library (Pedregosa et al., 2011) for Python.
More precisely, the models “RandomForestClassi-
fier”, “MLPClassifier”, “GradientBoostingClassifier”
and “KNeighborsClassifier” were used.
All models use the same training and test data
as input (see Section 4.1) and output the determined
class. All classifiers used a split of 70% for training
data and 30% for test data, resulting in 130 movement
files used for the evaluation and 302 files used for
training the classifiers. The hyperparameters of each
classifier were optimized with the help of the “Ran-
domizedSearchCV” method. It performs a cross-
validated randomized search on a specified list of pos-
sible hyperparameters. The TUG detection combines
these four classifiers with the help of the “VotingClas-
sifier”, which is also provided by the Scikit-learn li-
brary (see Section 4.4 for further explanations). All
classifiers have five possible classes as their output:
getting up, walking, sitting down, resting, position
and turning.
4.4 TUG Sequence Detection Algorithm
Finally, we reach the last step in our pipeline, the ac-
tual detection of TUG sequences. The developed al-
gorithm is represented by the flow chart in Figure 6.
The algorithm is split into four main parts: First the
stream of sensor data is split into smaller windows
with a sliding window algorithm. Then the features
of each segment are extracted with the Short-time
Fourier transform. After that the resulting data is clas-
sified with the VotingClassifier. Afterwards the se-
quence of movements is checked for a possible TUG
sequence (TUG detection). The numbers in the flow
chart correspond with the numbers in the following
headings.
Sliding Window based Data Segmentation (1).
First, we split the stream or file of input data into
smaller segments. This is done with a sliding win-
dow approach. Multiple window sizes were tested
before choosing the final window-size of 132 sam-
Sensor Data
Frame X
n
Acc. / Gyro. -
data from
Wearable
Sliding window
algorithm
Algorithm start
Feature
extraction
with STFT
TUG detection
No TUG
detected
TUG
detected
Classify data with
4 methods
Majority Voting
with
Classifier
Save TUG time
and sensor data
4
2
3
1
Preprocessing
of the
movement list
Figure 6: Flow chart of the TUG detection algorithm.
pling points (≈ 2.5s). The size of the windows was
determined empirically while giving care to choose
roughly the same size as the movements that were
used as input. The chosen window size also corre-
sponds with the average number of movements in a
standard TUG sequence. The windows are overlap-
ping by 50% to allow for the recognition of the move-
ments that would otherwise stretch across two win-
dows. In the next step the segments are further ana-
lyzed with the STFT.
Preparation for Classification (2). The next step
applies the previously mentioned STFT to the data.
The STFT is calculated of every segment as described
in Section 4.2. The data is then treated in the same
way as the training and test data before and the aver-
age of every STFT is calculated and added together.
Classification of Movements (3). In this step, the
four previously described machine learning methods
(random forests, k-nearest neighbors, multilayer per-
ceptron, gradient boosting classifier) are combined.
The VotingClassifier simply combines the four
algorithms by performing a prediction using all
four classifiers. After that the probabilities for
BIODEVICES 2022 - 15th International Conference on Biomedical Electronics and Devices
20
each class are stored and the class with the high-
est value of the sums of the stored probabilities
of the predictions is chosen (this is called “soft
voting” by Scikit-learn). For example if the four
methods produce the following summed probabili-
ties of Getting Up = 0.73, Walking = 0.9, Turning =
0.3, Sitting Down = 0.65 and Resting Position = 0.1,
then the class “Walking” is chosen because it has the
highest overall probability. The final predicted move-
ment is then stored in a list for further processing and
the actual TUG detection.
Actual TUG Detection (4). Finally, the created se-
quence of movements from the last step is checked
for a possible TUG sequence. This is relatively sim-
ple and done with the help of a list containing possible
TUG sequences.
This list was constructed empirically with possi-
ble TUG sequences. Every TUG sequence in the pre-
compiled list is then checked against the recent move-
ments from the last step. Duplicate entries are com-
bined beforehand (e.g. “getting up, walking, walk-
ing, walking, sitting down” → “getting up, walking,
sitting down”). A TUG is found if one of the pos-
sible TUG sequences is contained in the recent list
of movements. Afterwards the time the original se-
quence of movements took is calculated with the help
of timestamps in the sensor data. (These timestamps
are sent with every data packet of the sensor as UTC
in milliseconds.)
5 EXPERIMENTAL RESULTS
The developed method was evaluated in two differ-
ent ways. First the human activity recognition itself is
assessed. In a second step the complete TUG detec-
tion algorithm is evaluated with the help of additional
sensor and audio data.
5.1 Human Activity Recognition
The human activity recognition was evaluated sepa-
rately from the complete TUG detection algorithm.
All of the four machine learning algorithms were
evaluated separately from each other as well as the
combined classifier (the way they are used in the TUG
detection algorithm). First we compare the overall re-
sults with the help of the precision, recall and F-score
measures (see equations 1 to 3). An explanation of
these measures can be found in (Sokolova and La-
palme, 2009). Afterwards the confusion matrices of
the random forest, gradient boosting classifier and the
combined VotingClassifier are examined in detail.
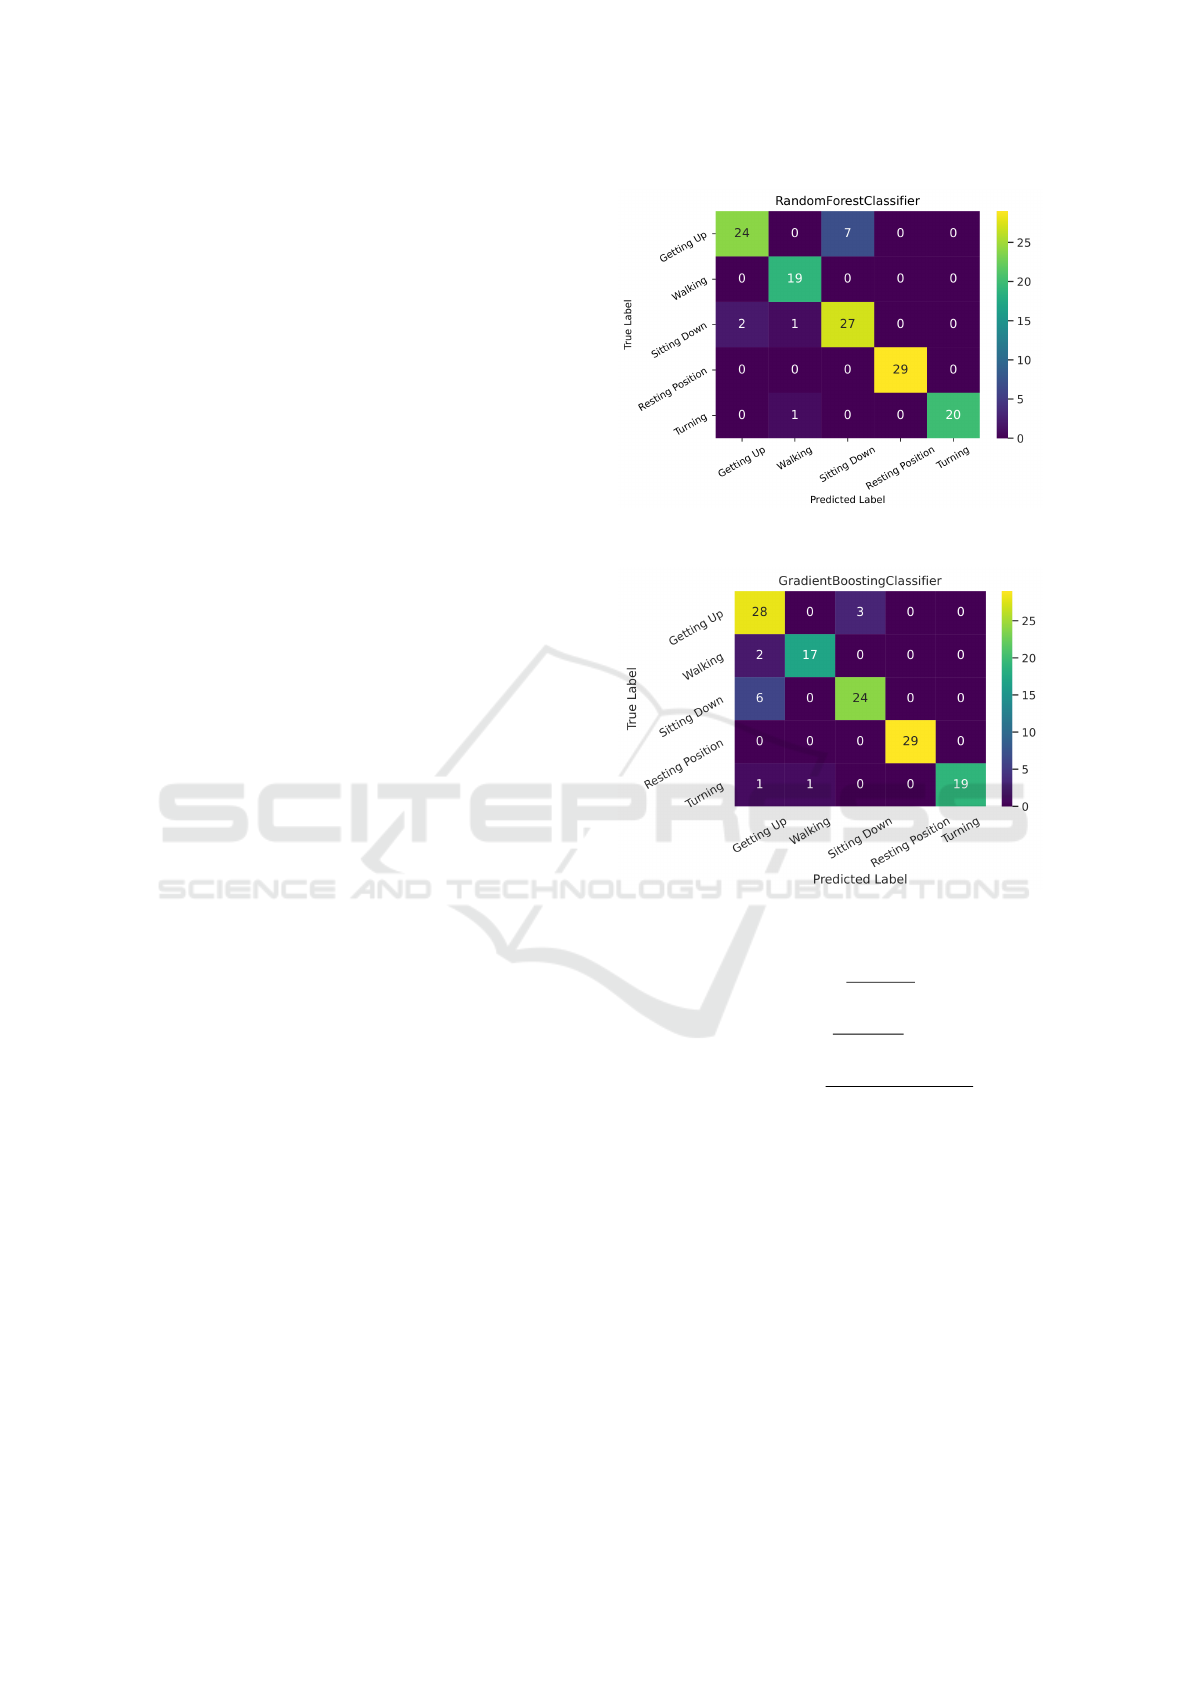
Figure 7: Confusion matrix of the human activity recogni-
tion (random forest classifier).
Figure 8: Confusion matrix of the human activity recogni-
tion (gradient boosting classifier).
Precision =
TP
TP + FP
(1)
Recall =
TP
TP + FN
(2)
F-measure = 2 ∗
Precision ∗ Recall
Precision + Recall
(3)
where:
TP = True positive
FP = False positive
FN = False negative
All of the four classifiers were evaluated in the
same way. Table 1 shows the precision, recall and F-
score of all the tested machine learning methods. The
scores were calculated with the help of the “preci-
sion_recall_fscore_support” method provided by the
scikit-learn library. One can see that the random for-
est algorithm gives the best results overall (regarding
precision, recall and F-score), followed by the gradi-
ent boosting algorithm. Nevertheless the k-NN and
multilayer perceptron produce respectable results as
Automatic Detection of Timed-up and Go Tests with IMU Sensor Data
21
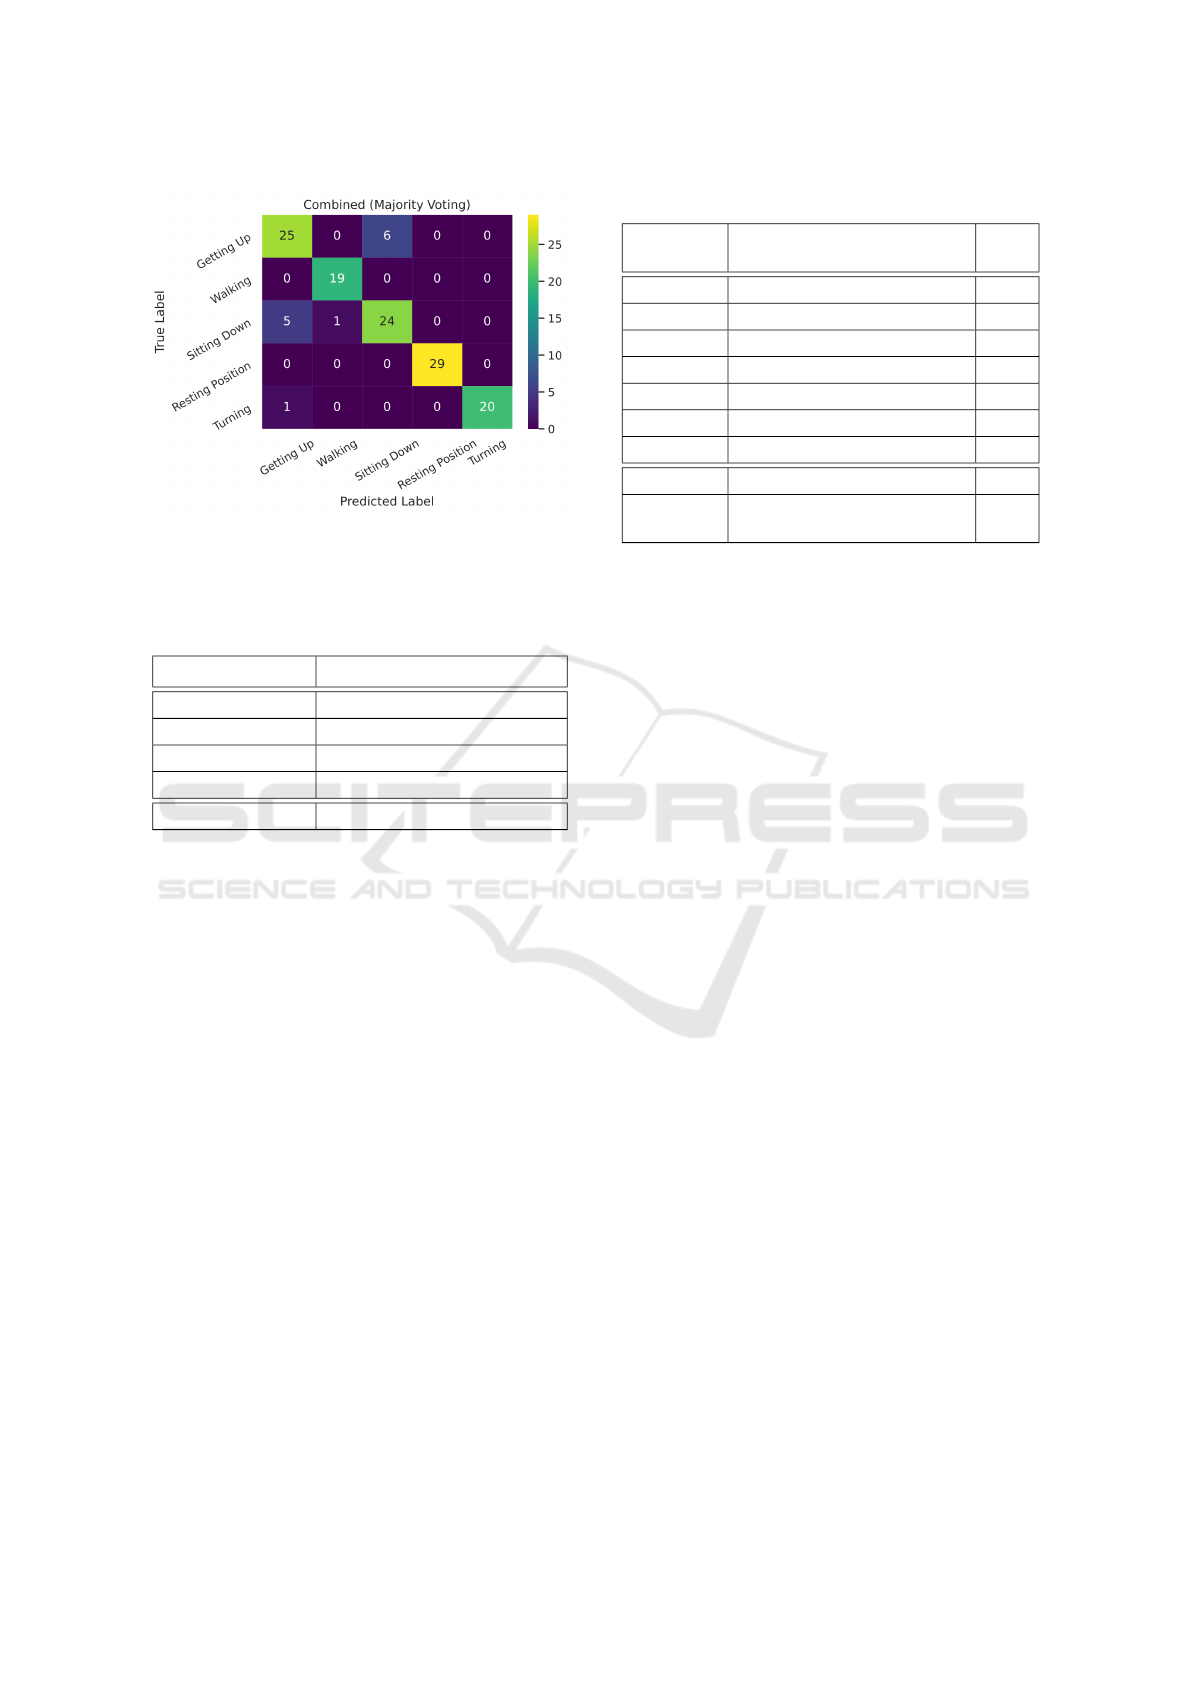
Figure 9: Confusion matrix of the human activity recogni-
tion (combined VotingClassifier).
Table 1: Precision, recall and F-score of all evaluated ma-
chine learning methods. See equations 1 to 3 for the used
measures.
Precision Recall F-score
Random Forest 92.44% 92.53% 92.23%
k-NN 87.44% 87.62% 87.41%
Gradient Boosting 91.8% 90.05% 90.7%
MLP 87.28% 86.9% 86.87%
Combined 89.69% 89.54% 89.44%
well. Despite the slightly better results of some classi-
fiers, all results are approximately located in the same
range. Interestingly some of the simpler methods, like
k-NN and random forest outperform the multilayer
perceptron despite its much higher computational ex-
pense and bigger model size.
Figure 7 (random forest classifier) and 8 (gradi-
ent boosting classifier) show the confusion matrices
of the two best performing methods. The first thing
that stands out regarding the confusion matrices is that
almost all errors made by the classifiers concern the
confusion of getting up and sitting down, most likely
due to the similarity of the sensor data of these two
movements, which is amplified in the feature extrac-
tion step. However the classifiers make almost no er-
rors regarding the other movements.
Figure 9 shows the combined results of all four
classifiers (using the VotingClassifier provided by
scikit-learn). Unfortunately the previously men-
tioned confusion of getting up and sitting down re-
mains. However this combined classifier combines
the strengths of all classifiers and is able to im-
prove the results of the classification slightly. This
is not necessarily reflected in the traditional evalua-
tion methods, but proven true in the TUG detection
results.
Table 2: Results of the TUG detection evaluation.
Total Time Lab.
TUGs
Det.
TUGs
Other
TUGs
Person 1 21 min 34 s 14 9 5
Person 2 4 min 36 s 4 0 2
Person 3 10 min 38 s 7 5 0
Person 4 11 min 1 s 6 4 0
Person 5 5 min 30 s 4 1 0
Person 7 29 min 57 s 13 6 3
∑
1h 23 min 16 s 48 25 10
Person 6 16 min 33 s 14 1 0
∑
(with
person 6)
1h 39 min 49 s 62 26 10
It has to be mentioned that the results of the hu-
man activity recognition are highly dependent on the
chosen window size (see Section 4.4). This means
that probably a different size has to be chosen when
using different training data or data from different age
groups.
5.2 TUG Detection
The TUG recognition accuracy was evaluated with
specially collected sensor data. We collected sen-
sor data which was annotated by the user collecting
the data (see Section 4.1). In doing so 22 datasets
(with the individual lengths ranging from 1min 55 s
to 11 min 11 s) were gathered. All in all data was
recorded by seven persons, every person recorded two
or more datasets. These audio recordings were then
parsed manually to a text file containing the move-
ment events and their corresponding timestamps and
contained multiple, random TUG sequences. These
files were then compared with the results from the
TUG detection algorithm. The algorithm was previ-
ously modified to be able to load a file of sensor data
and check this file for possible TUG sequences.
Table 2 shows the results from the TUG detec-
tion evaluation with the help of real world data. The
summed lengths of all data recordings of each person
are given in the second column of the table. The third
column (“Lab. TUGs”) shows the number of TUGs
labeled by the user. Column four (“Det. TUGs”)
shows the number of TUGs that were labeled by
the user and recognized by the algorithm, while col-
umn five (“Other TUGs”) shows TUGs which weren’t
labeled by the user but consist of TUG-like move-
ments which were additionally recognized by the al-
gorithm. Overall this shows promising results in de-
tecting TUG sequences in the daily life of people.
The algorithm misses some of the executed TUG se-
quences and produces a detection rate of the labeled
BIODEVICES 2022 - 15th International Conference on Biomedical Electronics and Devices
22

TUGs of 52.08% (without person 6, see last para-
graph for an explanation). This is however a good
result, as the main goal of the algorithm is to rec-
ognize some of the TUG-like sequences and not ev-
ery single sequence executed by the person wearing
the wearables. The results of the TUG recognition
also seems to vary from person to person, indicating
further needed research in the determination of con-
stants like the window size. The quality of the results
differs a lot from the results of the previously evalu-
ated movement detection. This could be explained by
the different data structure, movements have to be de-
tected in a continuous data stream containing move-
ments, whereas the movements used for training the
machine learning algorithms were manually selected
and trimmed.
Some movement sequences contained in the eval-
uation data are very similar to the movements found in
a typical TUG sequence, but weren’t specifically la-
beled as a TUG sequence by the person recording the
data. When taking these additional recognized TUGs
into account the algorithm is able to collect more data
about possible TUGs, as shown in the last column of
Table 2 (labeled as “Other TUGs”). This also yields
a detection of a TUG in almost every data recording,
further proving the feasibility of the algorithm. Over-
all the algorithm shows a good detection rate when
keeping the relatively short length of the test data in
mind. The algorithm should more than fulfill its goal
to detect TUGs when running for at least a few hours
in a real life scenario.
It has to be mentioned here that TUG sequences
which are normally too long (this means sequences
where the walking path is longer than 3 m) get rec-
ognized as well. This can however be easily miti-
gated by taking the walking speed of the person into
account. One possible solution for that is explained
in more detail in Section 6.1. Testing data was also
only collected from healthy individuals. Further test-
ing should also include data from older and geriatric
people.
Special attention must also be given to the results
of person 6. At first none of the labeled TUGs could
be detected in the data. After evaluating the data fur-
ther, it is suspected that the orientation of the wear-
ables was possibly swapped when collecting the data.
However, after swapping the axis of the sensor data to
the suspected correct orientation of the sensors, the re-
sults didn’t improve much. Due to the stark difference
in result quality, we consider this an outlier. For that
reason Table 2 includes a second summary without
the results of person 6. While we suspect a technical
or human error due to the unsupervised experimen-
tal setup, further research with more participants and
a supervised experiment should bring confirmation to
our suspicion.
6 CONCLUSION AND FUTURE
WORK
In this paper we presented a method for an automatic
TUG detection that works without interrupting the
daily life of the patients. This section first presents
a summary of the findings and results. The last sec-
tion shows some ways in which the developed method
could be improved.
The evaluation of the human activity recognition
showed very promising results with the performance
metrics of precision and recall exceeding values of
90%. The only notable errors are made concerning
the two movements of getting up and sitting down.
The human activity recognition can not only be used
for the developed TUG detection, but could also be
used for a standalone activity recognition of elderly or
geriatric persons. The actual TUG detection delivers
good results as well. More than half of the performed
and labeled TUG sequences are recognized. Move-
ment sequences with high similarity to the TUG (but
which weren’t labeled by the testers) are recognized
as possible TUG sequences as well.
The only downside being that the method also rec-
ognizes sequences which contain walking movements
longer than 3 m. A possible solution for this prob-
lem is briefly described in Section 6.1. All in all it
is definitely possible to detect and evaluate TUG-like
sequences without disrupting the daily life of the pa-
tients or additional user inputs. Nevertheless some
improvements are required for a fully autonomous
system. Some of these possible improvements are
shown in the next section.
6.1 Future Work
All in all the developed method represents a good way
for the automatic detection of the TUG. Nonetheless,
there is room for improvement and extension of the
presented method. This section describes how the
method could be further improved.
At first, the developed method should be ported to
and tested on a standalone hub (for example a Rasp-
berry Pi, see Section 3.2). This would remove the
need for a smartphone and make the system more au-
tonomous. It also increases the usability for different
age groups and for people with dementia.
The developed method has the disadvantage that it
detects TUG sequences that are longer than 3 m (see
Automatic Detection of Timed-up and Go Tests with IMU Sensor Data
23

Section 5.2). This could be mitigated by also calcu-
lating the walking speed of the wearer of the wearable
from the collected IMU data. This could be done with
the help of the accelerometer data (for example by de-
tecting the frequency of peaks in the accelerometer
data of the walking sequences). One can then cal-
culate the walking distance when the walking speed
and the length of the walking sequence is known. Af-
terwards the algorithm could discard detected TUG
sequences containing walking lengths which deviate
too much from the standard walking length of 3m.
Libraries like GaitPy (Czech and Patel, 2019) for
Python also provide methods for the extraction of gait
characteristics from accelerometer data.
Our developed method is also limited to the detec-
tion of the individual phases of the TUG and the time
the user took to complete the test. A future expansion
of the algorithm could also calculate and evaluate fur-
ther fall risk indicators. For example the movement or
turn speed in every phase of the detected TUG could
be calculated. Every phase can then be further eval-
uated with the help of a machine learning algorithm
and expert knowledge from medical staff with experi-
ence in the field of fall risk assessment. For this more
test data from geriatric persons would be needed. In
combination with this the TUG sequence could also
be displayed visually for a more intuitive interpreta-
tion. Approaches, for example from (Seo et al., 2019)
already tried to use an extended TUG to discern peo-
ple with higher fall risk from those with a lower fall
risk. The system measures multiple variables in each
of the single phases of the TUG. These in turn are
analyzed with regression to determine the fall risk.
ACKNOWLEDGEMENTS
Research reported in this publication was partially
supported by the Central Innovation Programme for
small and medium-sized enterprises (SMEs) of the
German Federal Ministry for Economic Affairs and
Energy under grant number 16KN075223 (MoDiSeM
- Spur).
REFERENCES
Attal, F., Mohammed, S., Dedabrishvili, M., Chamroukhi,
F., Oukhellou, L., and Amirat, Y. (2015). Physical hu-
man activity recognition using wearable sensors. Sen-
sors, 15(12):31314–31338.
Augurzky, B., Hentschker, C., Pilny, A., and Wübker, A.
(2017). Krankenhausreport. Barmer, Berlin.
Czech, M. and Patel, S. (2019). Gaitpy: An open-source
python package for gait analysis using an accelerom-
eter on the lower back. Journal of Open Source Soft-
ware, 4:1778.
Green, A. M. (2018). Automatic “Timed-Up and Go”
(TUG) Test Segmentation. Master’s thesis, Mas-
sachusetts Institute of Technology.
Kwapisz, J. R., Weiss, G. M., and Moore, S. A. (2011).
Activity recognition using cell phone accelerometers.
SIGKDD Explor. Newsl., 12(2):74–82.
Liu, J., Sohn, J., and Kim, S. (2017). Classification of daily
activities for the elderly using wearable sensors. Jour-
nal of Healthcare Engineering, 2017:1–7.
Mühle, M. (2019). Entwicklung eines Lernverfahrens zur
Beurteilung von Kompressoren anhand akustischer
Signale. Master’s thesis, BTU Cottbus-Senftenberg.
Nelson, K. (2014). Short time fourier transform using
python and numpy. https://kevinsprojects.wordpress.
com/2014/12/13/short-time-fourier-transform-using-
python-and-numpy/. Accessed: 02.09.2021.
Nguyen, H., Ayachi, F., Rahimi, F., Boissy, P., Jog, M.,
Blamoutier, M., and Duval, C. (2015). Auto detec-
tion and segmentation of physical activities during a
timed-up-and-go (tug) task in healthy older adults us-
ing multiple inertial sensors. Journal of NeuroEngi-
neering and Rehabilitation.
Paraschiakos, S., Cachucho, R., Moed, M., van Heemst, D.,
Mooijaart, S., Slagboom, E., Knobbe, A., and Beek-
man, M. (2020). Activity recognition using wearable
sensors for tracking the elderly. User Modeling and
User-Adapted Interaction.
Pedregosa, F., Varoquaux, G., Gramfort, A., Michel, V.,
Thirion, B., Grisel, O., Blondel, M., Prettenhofer,
P., Weiss, R., Dubourg, V., Vanderplas, J., Passos,
A., Cournapeau, D., Brucher, M., Perrot, M., and
Duchesnay, E. (2011). Scikit-learn: Machine learning
in Python. Journal of Machine Learning Research,
12:2825–2830.
Podsiadlo, D. and Richardson, S. (1991). The timed up and
go: a test of basic functional mobility for frail elderly
persons. Journal of the American Geriatrics Society,
39(2):142—148.
Seo, J., Kim, T., Lee, J., Kim, J., and Tack, G. (2019).
Fall prediction of the elderly with a logistic regression
model based on instrumented timed up & go. Journal
of Mechanical Science and Technology, 33.
Sokolova, M. and Lapalme, G. (2009). A systematic analy-
sis of performance measures for classification tasks.
Information Processing & Management, 45(4):427–
437.
Suunto (2020a). Movesense-device-lib. https://bitbucket.
org/suunto/movesense-device-lib/src/master/. Ac-
cessed: 15.07.2021.
Suunto (2020b). Movesense Sensor. Suunto, Vantaa, Fin-
land. v2.0.
Suunto (2021). Movesense - Open Wearable Tech Platform.
https://www.movesense.com/. Accessed: 15.07.2021.
Weiss, A., Herman, T., Plotnik, M., Brozgol, M., Giladi,
N., and Hausdorff, J. (2011). An instrumented timed
up and go: The added value of an accelerometer for
identifying fall risk in idiopathic fallers. Physiological
measurement, 32:2003–18.
BIODEVICES 2022 - 15th International Conference on Biomedical Electronics and Devices
24
