
Opportunities with Slippy Maps for Terrain Visualization in Virtual and
Augmented Reality
Shaun Bangay
1
, Adam P. A. Cardilini
2
, Nyree L. Raabe
3
, Kelly K. Miller
2 a
, Jordan Vincent
4
,
Greg Bowtell
1
, Daniel Ierodiaconou
5
and Tanya King
3
1
School of Information Technology, Deakin University, Geelong, Victoria, Australia
2
School of Life and Environmental Sciences, Deakin University, Burwood, Victoria, Australia
3
School of Humanities and Social Sciences, Deakin University, Waurn Ponds, Victoria, Australia
4
Deakin Research Innovations, Deakin University, Geelong, Victoria, Australia
5
School of Life and Environmental Sciences, Deakin University, Warrnambool, Victoria, Australia
Keywords:
Slippy Maps, Virtual Reality, Terrain Modelling, Level-of-Detail, Geospatial Data Visualization.
Abstract:
Map tile servers using the slippy map conventions provide interactive map visualizations for web applications.
This investigation describes and evaluates a viewpoint sensitive level-of-detail algorithm that mixes slippy
map tiles across zoom levels to generate landscape visualizations for table top VR/AR presentation. Elevation
tiles across multiple zoom levels are combined to provide a continuous terrain mesh overlaid with image data
sourced from additional tiles. The resulting application robustly deals with delays in loading high resolution
tiles, and integrates unobtrusively with the game loop of a VR platform. Analysis of the process questions the
assumptions behind slippy map conventions and recommends refinements that are both backward compatible
and would further advance use of these map tiles for VR experiences. These refinements include: introducing
tiles addressed by resolution, ensuring consistency between tiles at adjacent zoom levels, utilizing zoom values
between the current integer levels and extending tile representations beyond the current raster and vector
formats.
1 INTRODUCTION
Slippy maps
2
are an established mechanism for inter-
active map browsing in online applications (Farkas,
2017). Map data is provided in the form of square
tiles that allow the visible window to pan over this
underlying grid of tiles. Tiles are available at dif-
ferent levels of magnification so that the view can
be zoomed by displaying tiles from a different level.
Map tiles depict traditional map representations (e.g.
satellite imagery, road layouts) but can also encode
other data sets. Tiles containing elevation data en-
able procedural generation of 3D terrain representa-
tions suitable for virtual or augmented reality appli-
cations (VR/AR) as illustrated in Figure 1. Our focus
is an interactive table top VR/AR landscape visualiza-
tion for collaborative seabed analysis (Campos et al.,
2020) which particularly requires change of magnifi-
cation and multiple levels-of-detail. This differs from
a
https://orcid.org/0000-0003-4360-6232
2
https://wiki.openstreetmap.org/wiki/Slippy_Map
VR applications where terrain is at a fixed scale rela-
tive to the user.
This paper adapts and evaluates the use of slippy
map technologies applied to generating landscape
representations for VR applications. The significant
contributions of this work are:
1. Combining tiles of different magnification to pro-
vide a viewpoint dependent level-of-detail repre-
sentation to adapt geometry complexity and data
access restrictions to accommodate VR/AR. The
process developed ensures that terrain presenta-
tion within a VR/AR experience cooperates with
other system operations and shares essential re-
sources. Low resolution content and incremental
refinement are used to compensate for delays in
tile loading.
2. Identifying opportunities for further refinement of
the slippy map concept, including: challenging
assumptions about tile structures and accepted pa-
rameter values (e.g. tile resolution) which define
the shape of the slippy map tile pyramid, develop-
Bangay, S., Cardilini, A., Raabe, N., Miller, K., Vincent, J., Bowtell, G., Ierodiaconou, D. and King, T.
Opportunities with Slippy Maps for Terrain Visualization in Virtual and Augmented Reality.
DOI: 10.5220/0010774700003124
In Proceedings of the 17th International Joint Conference on Computer Vision, Imaging and Computer Graphics Theory and Applications (VISIGRAPP 2022) - Volume 1: GRAPP, pages
139-146
ISBN: 978-989-758-555-5; ISSN: 2184-4321
Copyright
c
2022 by SCITEPRESS – Science and Technology Publications, Lda. All rights reserved
139

(a) (b) (c)
Figure 1: a) Land- and sea-scape visualized on a table top in VR as seen through an Oculus Quest head set (water surface
removed for clarity) b) Section of high-resolution seascape showing a shipwreck c) Combining tiles across multiple levels of
detail (the high resolution tile data is marked with a grid-like pattern). Two texture layers are present (blue representing the
underwater regions, and red indicating key ridge/valley structures).
ing algorithms to blend tiles across zoom levels,
integrating additional sources of tile content be-
yond raster data that would be relevant to VR/AR
contexts, and extending the 2D slippy map con-
cept to 3D. The latter includes integrating 3D con-
tent with the map surface, and using tiles to cap-
ture the volumetric region above and below this
surface.
The context for this investigation is a cross-
disciplinary project using VR/AR to explore a ma-
rine park environment including: the landscape be-
low the ocean surface, how life shapes and is shaped
by the environment, and the geological and external
influences on the region. A significant challenge in-
volves using VR/AR to visualize and explore a high-
resolution data set scan of the sea floor generated
during this project. The seafloor scan is too large
to be stored, selectively accessed, or displayed in
its entirety, particularly on the self-contained mobile
VR/AR devices being used.
The remainder of this paper reviews key concepts
and related work in section 2, presents the algorithms
used in section 3 and evaluates the outcomes in sec-
tion 4. Insights derived from this investigation are dis-
cussed in section 5.
2 RELATED WORK
2.1 An Overview of Slippy Maps
Slippy maps refer to an implementation of a map tile
service (Open Source Geospatial Foundation, 2012;
Masó, 2019), and use a coordinate system based on
the Web Mercator projection (Larrick et al., 2020).
Maps are assembled from square image tiles contain-
ing colour data (such as satellite images), or eleva-
tion samples. Individual tiles typically have an image
resolution of 256 × 256, although this is not a fixed
requirement. This study uses 64 × 64 elevation tiles.
Tiles are indexed by three coordinates. The zoom
level which determines the scale of the map, or mag-
nification level for each tile, ranges from 0 in integer
steps to a limit determined by the resolution of the
data. Each zoom level contains 2
zoom
× 2
zoom
tiles.
The single tile at zoom level 0 covers the entire planet.
The remaining coordinates: x and y index the tile ar-
ray, with the origin in the top-left corner (correspond-
ing to the north pole, and 180
◦
W ).
Tiles are prepared and accessed from a networked
server. Clients access only the tiles required at any
instant, at the zoom level required. This achieves in-
teractive landscape visualizations even on low perfor-
mance devices or mobile platforms used for VR/AR
(Richardson et al., 2018; Jurado et al., 2018). The
process of generating and serving tiles is also an in-
teresting challenge but outside the scope of this paper.
2.2 Procedural Terrain Presentation
Control over terrain detail is achieved by filtering
large data sets to show only selected regions or
overviews of large regions (Kumar et al., 2018). A
typical terrain covers a vast area and so level-of-detail
algorithms are used to produce mesh representations
whose complexity is proportional to the area occupied
on the screen (Duchaineau et al., 1997).
Quad-trees (Kalem and Kourgli, 2015; Kang et al.,
2018; Lee and Shin, 2019) and bintrees (Duchaineau
et al., 1997; Cao et al., 2019) support viewpoint de-
pendent level-of-detail. Converting quad-tree tiles
into geometric meshes introduces cracks in the mesh
between tiles of different resolutions. These are
addressed variously through interpolation across the
seams (Kang et al., 2018), forcing an equal number of
GRAPP 2022 - 17th International Conference on Computer Graphics Theory and Applications
140

vertices in neighbouring tile edges (Cao et al., 2019;
Lee and Shin, 2019), creating overlapping polygons
or skirts (Campos et al., 2020) or, as is used here, pro-
viding a custom triangulation along tile edges. His-
torically terrain meshes re-triangulate meshes directly
by merging or subdividing polygons according to pro-
jected polygon area and measures of accuracy of the
terrain reconstruction (Duchaineau et al., 1997; Ai
et al., 2019; Lee and Shin, 2019; Li et al., 2021).
Mapzen tiles (Larrick et al., 2020) encode eleva-
tion in the colour channels of the image. Neighbour-
ing vertices in each tile’s mesh are connected to re-
move seams between tile regions. In contrast, ge-
ometry clipmaps (Li et al., 2021) provide a power-
of-two multi-resolution pyramid of the terrain data,
centered around the current viewpoint. The level-of-
detail terrain mesh structure (Krämer et al., 2020) also
uses an image pyramid (in the form of the Cesium
quantized mesh format) for view dependent tile selec-
tion. However, this approach uses a computationally
expensive process of re-triangulation to pre-generate
mesh geometry in tiles, as compared to the approach
presented here which dynamically generates the mesh
from existing raster elevation data. A pyramid of ge-
ometry tiles constructs surfaces rapidly but introduces
the challenge of ensuring surface continuity between
tiles (Campos et al., 2020). Procedural mesh genera-
tion converts raster and vector tile formats into land-
scape geometry that can be presented in VR/AR, such
as rivers and lakes (Menegais et al., 2021).
2.3 Terrain Representations
Geographical information can be represented in many
forms, such as point cloud data (Richardson et al.,
2018; Easson et al., 2019) acquired using LiDAR
or photogrammetry (Jurado et al., 2018), as digital
elevation maps (DEMs) (Easson et al., 2019; Lee
and Shin, 2019), or in vector formats (Jurado et al.,
2018). VR systems usually convert these to a poly-
gon mesh to simplify rendering. Mesh vertices can
be spaced in a regular horizontal grid matching the
DEM structure, or use triangulated irregular networks
(TINs) to adapt polygon density to roughness of the
terrain (Easson et al., 2019; Kumar et al., 2018; Ai
et al., 2019). Meshes may be pre-generated (Richard-
son et al., 2018), or be created on demand at run-time
as described in this paper. Geographic information
is not limited to terrain shape, but also includes lay-
ers such as buildings, water bodies, roads and plant
cover (Kumar et al., 2018). Procedural generation of
terrain trades off storage requirements by synthesiz-
ing some terrain elements during the rendering of the
terrain (Galin et al., 2019; Kang et al., 2018)
3 SLIPPY MAPS FOR VR/AR
LANDSCAPES
Slippy map tiles are used to provide level-of-detail for
landscape representation. In the VR/AR environment
the landscape is either projected onto a physical table
surface, is visible through a camera/screen of a hand-
held device, or is fully presented within VR. Level-
of-detail applies to the individual view point of each
of the participants.
The landscape generation algorithm takes as in-
put: 1) the position and size of the table top surface
2) the camera view frustum so that the geometry can
be optimized for that view, and 3) the region of the
map being presented. The map region is defined us-
ing three coordinates of latitude, longitude and scale.
Scale is a continuous variable representing the ratio
of physical distance to distance on the table top map.
This abstraction removes an explicit dependency on
slippy map tile coordinates inherent in many other ap-
plications.
Landscape generation uses the pipeline shown in
Figure 2. These separable components are presented
in the following sections.
3.1 Generate the Level-of-Detail Tree
While many web mapping applications show a single
zoom level at any instant, this process mixes zoom
levels using a quad-tree to provide detail in areas that
are close to the viewer.
Each tree node represents a slippy map tile, with
children being tiles that occupy part of the same re-
gion but at the next zoom level. Tree generation (see
Algorithm 1) starts conceptually with a tile that cov-
ers the table top region. Longitude, latitude and scale
coordinates identify tile coordinates: x, y and zoom
for a tile, T , whose extent is comparable to the table
surface area. Since tile boundaries may cut across the
table a table-spanning quad-tree is created by adding
two extra parent levels (see Figure 3). At level 2, this
tree contains the 3 × 3 set of tiles consisting of T and
its immediate neighbours. Level 1 merges clusters of
4 tiles. Level 0 is a single fictitious tile which may not
align with an actual tile but that is a quad-tree root for
the tiles at level 1. Only the tiles from level 1 down
are ever utilized for terrain generation.
The tree is then selectively subdivided based on
camera distance and direction to meet the allowed
vertex budget for the terrain mesh and to manage the
performance of the VR/AR application. Slippy maps
are well suited to reducing detail by reverting to a
lower zoom level tile. Subdivided tiles must be visible
on the table, and occupy the greatest visible screen
Opportunities with Slippy Maps for Terrain Visualization in Virtual and Augmented Reality
141
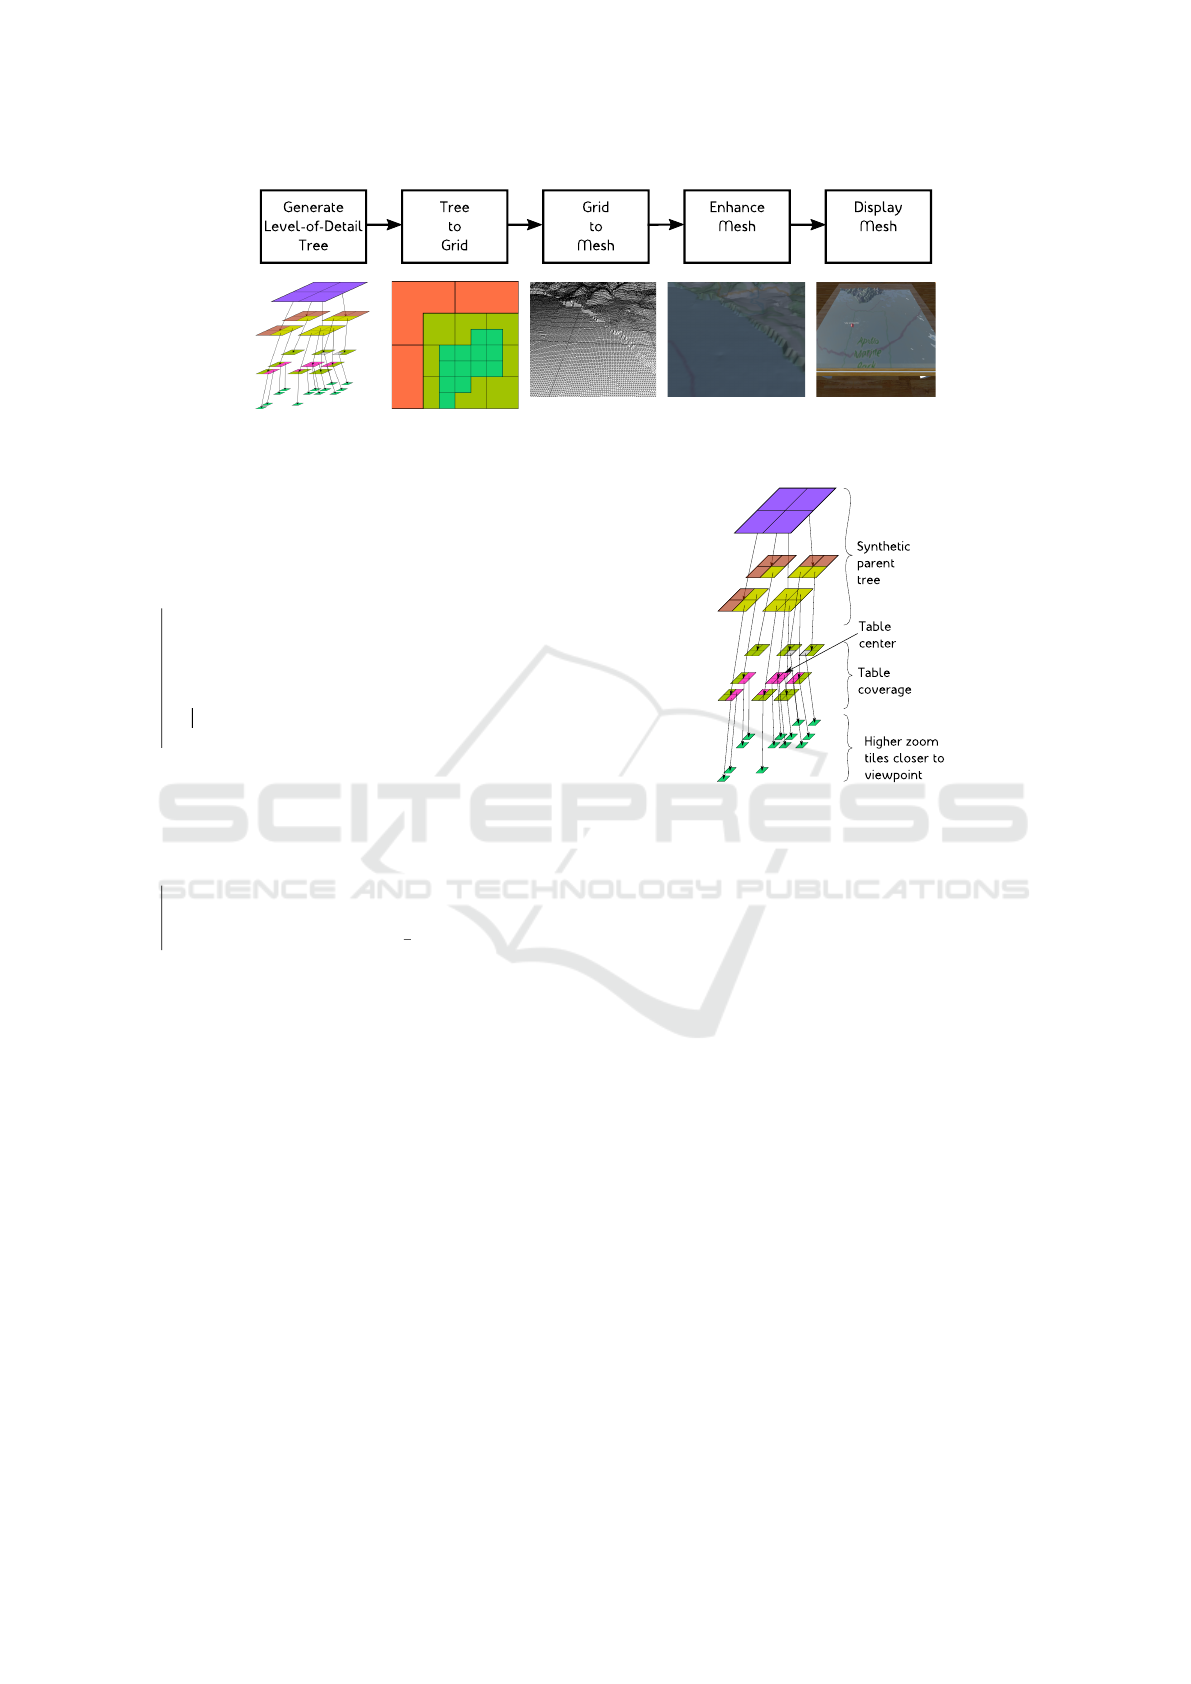
Figure 2: Landscape generation uses a quad-tree to identify tiles appropriate to the required level-of-detail. Subsequent stages
render low zoom tiles first to ensure complete coverage even if higher resolution tiles are not available.
input : latitude, longitude, scale, viewFrustum, table
output: Root node of quad-tree
zoom ← log
2
(tileSize
zoom=0
/(table.size ·scale));
// Identify tiles covering the table
n ←
{
−1,0,1
}
;
repeat
x,y ← LatLongToTileXY (latitude, longitude, zoom);
tableCenter ← GetTile(x,y,zoom);
tableCoverage ←
{
GetTile(x + n, y + n,zoom)
}
;
valid ← tilesExist (tableCoverage);
if not valid then
zoom ← zoom- 1 ;
end
until zoom = 0 or valid;
// Build 2-level parent tree
a ← parentAlignmentFactor (tableCoverage);
root ← merge4(merge4(tableCoverage[n +a]));
// Subdivide for level-of-detail
while ver texCount < vertexBudget do
tile ← biggestVisibleTile (root, viewFrustum);
root.addToTree (largestRemainingChild (tile));
vertexCount ← vertexCount +
3
4
× verticesPerTile;
end
return root;
Algorithm 1: Quad-tree generation starts by identify-
ing a tile overlapping the table top. A synthetic parent
is then created to completely cover the table. Child
tiles are selected based on the screen area they oc-
cupy.
area when viewed through the camera. The visible
area is approximated by projecting corners, assuming
negligible height, into screen coordinates and calcu-
lating the area of this 2D shape. Comparable heuris-
tics use estimates based on relationships between the
screen-space length of a tile edge and the tile resolu-
tion (Kang et al., 2018), or use of summed-area tables
to efficiently accumulate and compare error estimates
for each level of refinement (Li et al., 2021).
Tiles are retrieved asynchronously from remote
servers, and cached locally. Terrain generation pro-
cesses are designed to fall back to lower resolution
tiles in the case of delays or failures.
Figure 3: Quad-tree structure showing the additional two
parent layers.
3.2 Tree to Grid
Quad-tree nodes may contain less than 4 children, in
which case that region needs to be created using por-
tions of the parent node combined with portions from
child nodes as well as their descendants. Polygon
mesh generation needs to blend across tile and par-
tial tile boundaries. While the quad tree is able to
resolve neighbour queries, in the worst case this re-
quires a tree traversal to the root and back. Efficiency
is improved by collapsing the tree (of depth d) into
a square grid of size 2
d
× 2
d
that supports constant
time neighbour queries. Each node in the quad tree
resolves to one or more grid entries. Each grid entry
refers to the slippy map tile and the offset within the
tile that the grid entry represents. The grid creation
process ensures that when individual tiles are missing
their grid entries contain details of parent tiles allow-
ing a complete landscape model to be created even if
portions are at a lower resolution.
3.3 Grid to Mesh
The landscape is represented geometrically using a
polygon mesh boundary representation using the pro-
GRAPP 2022 - 17th International Conference on Computer Graphics Theory and Applications
142

input : 2D array, grid, indicating tile portions used
output: Single polygon mesh
mesh ← ε;
foreach gridCell in grid do
(start, end, tileData)← gridCell;
region [gridCell] ← generateVertices (tileData,
start, end);
end
foreach gridCell in grid do
mesh.append (generatePolygons (region [gridCell
]));
seamRight ← generateSeam (region [gridCell ],
region [gridCell.right]);
mesh.append (seamRight);
seamBottom ← generateSeam (region [gridCell ],
region [gridCell.bottom]);
mesh.append (seamBottom);
end
return mesh;
Algorithm 2: Mesh generation starts by creating a set
of vertices derived from the grid cell’s offset, and el-
evation values from data sampled from the portion
of tile overlapping each grid element. Neighbouring
vertices are connected into polygonal faces. Neigh-
bouring tiles that are at different vertex densities are
connected by polygon seams.
cess described in Algorithm 2.
The regular array of values in an altitude tile are
used to generate a polygonal mesh as a series of
quadrilateral faces (or pairs of triangles) for each grid
element. Meshes for each grid element are seamlessly
connected by bridging boundaries with a single strip
of polygons using a triangle fan topology to provide
the one-to-many relationship between corresponding
vertices in the two neighbouring meshes.
3.4 Enhance Mesh
Further data sets are presented as a texture image
overlaid onto the terrain mesh. These textures are also
provided as slippy map tiles. Tile textures from the
open street map project
3
that provide location names,
roads and region markers. Custom tile textures cre-
ated to identify ridge and valley structures are used to
identify likely travel routes for parts of the landscape
that were recently submerged. Overlapping textures
are blended and applied to the mesh surface.
Texture tiles are applied using a process equivalent
to that used for grid generation (section 3.3). Individ-
ual tile textures are all rendered to a single texture
image, T
tex
, with a limited number (currently 1) tiles
written per frame. The quad-tree is traversed breadth-
first since the intermediate steps show as incremental
3
https://www.openstreetmap.org/
refinement. Textures from each node are only writ-
ten to their corresponding region of T
tex
. If process is
interrupted by a later terrain update T
tex
will always
contain a usable texture image. In practice polygon
generation, replacement and seam removal can occur
concurrently with the VR/AR experience while tex-
ture generation is performed in a shader on the GPU
and must be synchronized with the VR/AR render cy-
cle to avoid disrupting the immersive experience.
Texture rendering produces some artefacts, such
as seams between images from different zoom lev-
els. Coloured regions marking different vegetation
patterns blend together reasonably well but the text la-
bels used for place names do not as their size and po-
sitioning vary with map resolution. Potential lines of
investigation (Dumont et al., 2020) include separating
such meta-data to a separate class of slippy map tile,
aligning labels so that they are amenable to a form
of alpha blending, or modifying tiles to have more
intermediate levels (i.e. a spatial tree structure that
divides spatial dimensions by a factor f < 2). Tile
pre-processing allows level-of-detail decisions to be
made early and seam removal hints can be embedded
in tiles.
3.5 Display Mesh
The resulting enhanced mesh is depicted on a table
making use of either AR or VR technology. The land-
scape mesh is larger than the table surface, and is
clipped to the bounds of the table by a pixel shader.
Since clipping is performed for each frame, there is
no additional performance overhead involved in trans-
lating and scaling the model and seeing different por-
tions appear. Zoom and pan operations are achieved
through initially translating and scaling the current
model for instant response in the VR/AR experience.
A new version of the terrain is concurrently generated
at the designated position and scale and which takes
into account the user’s viewpoint to provide appropri-
ate level of detail. A continuous flyover of the terrain
can also be achieved by animating latitude, longitude
and scale values between two key frames.
4 PERFORMANCE EVALUATION
This section evaluates the performance of the land-
scape visualization process to quantitatively assess
the impact of applying the slippy map concept to con-
trol level-of-detail. A secondary goal is to identify
opportunities for further refinement and investigation.
Opportunities with Slippy Maps for Terrain Visualization in Virtual and Augmented Reality
143
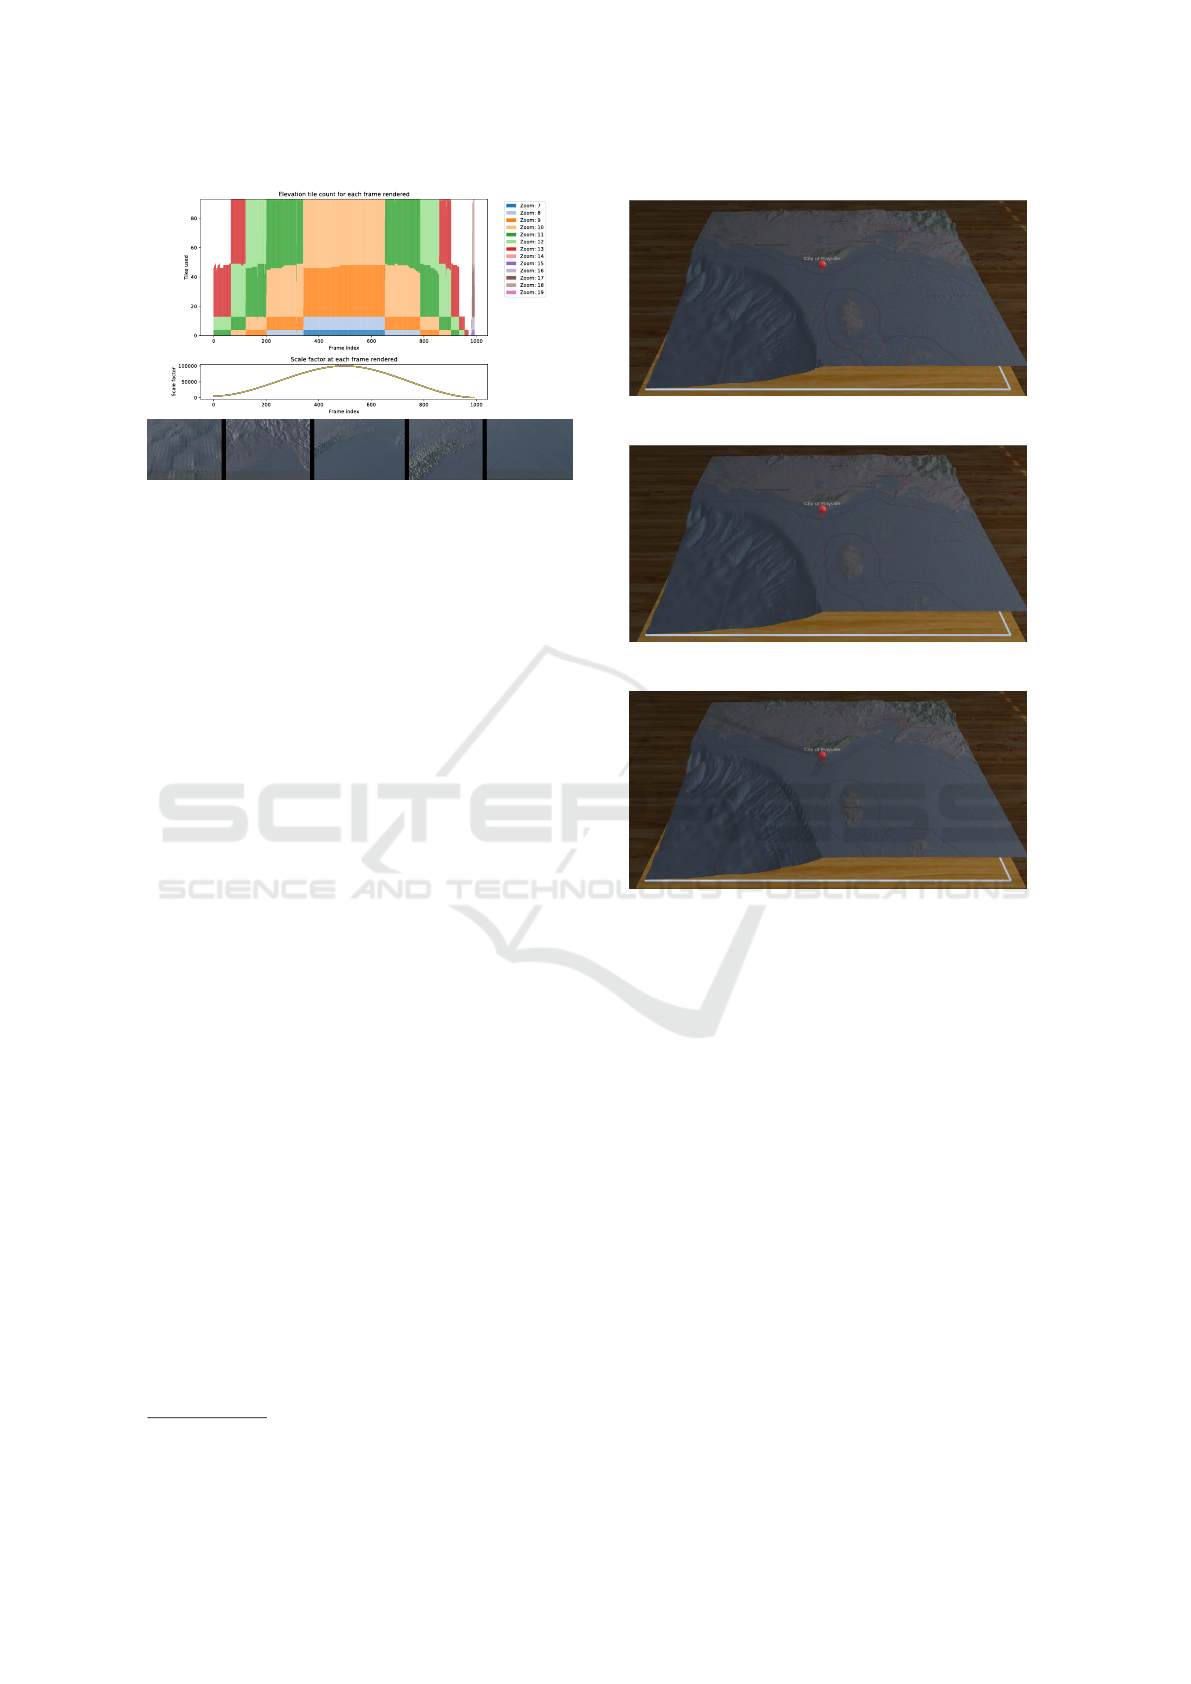
Figure 4: Tile usage patterns over 1000 frames during
which the view point moves from a close up view on land, to
an overview of the region and then to a high resolution sea
floor area. The images at the bottom show representative
samples of the terrain at key frames.
The algorithm is implemented using Unity3D
4
2019.4.28f1 with time-dependent performance mea-
surements taken while running completely on an Ocu-
lus Quest (v1) headset. The user pans and zooms us-
ing gestures made with the controllers. Map layers
consist of elevation tiles, including the high resolution
tiles (up to zoom level 19) for the marine park and up
to zoom level 13 for the surrounding area. Two lay-
ers of texture tile are applied to the surface, generated
from the open street map data set and an experimen-
tal layer marking ridge and valley features. A water
plane is displayed at sea level, but has been disabled
in some screenshots to show the sea floor.
The results of a test run forcing use of tiles across
different scales are shown in Figure 4. The number of
tiles required is constant since the camera was fixed
during this test. Gaps in the first 50 and last 100
frames are expected failed attempts to access some
tiles due to gaps in the data sets available. Missing
tiles only limited the resolution of the resulting land-
scape mesh and in all cases a lower magnification tile
is automatically substituted by the algorithm to ensure
continuity and consistency of the landscape.
The client exploits spatial coherence and only ever
accesses a small portion of the data on the server at
any time. As an illustration, the client used for all the
testing described in this paper has only ever accessed
(and cached) 200 MB of unique tile data from the 23
GB currently available on the server.
The landscape quality is visually assessed using
Figure 5. Different levels of detail are achieved by
specifying the target vertex budget. The visible por-
tion of the terrain represents approximately 1/9th of
the mesh created as the table-center tile matches the
table size, and the 3 × 3 table-coverage tile group is
4
https://unity.com/
(a) Vertex target: 10,000
(b) Vertex target: 100,000
(c) Vertex target: 1,000,000
Figure 5: Views of the landscape visualizations created
with different vertex targets. The actual vertex counts are:
a) 176218 (target 10,000) b) 262144 (target 100,000) c)
1159168 (target 1,000,000) although only a portion are vis-
ible within the region above the table. Changes to the text
labels are visible in the most detailed image.
used to ensure the table top is completely covered.
Panning in any direction of half the table top dimen-
sions is possible before the edge of terrain is visible.
Interactive level-of-detail refinement takes place
continuously during the VR experience. Figure 1c
shows the region closest to the viewer (bottom of the
image) accessing tiles at a higher zoom level than the
region of the terrain further from the viewer (at the top
of the image). The high zoom tiles have a grid-like
sampling artefact embedded in the tiles. The land-
scape mesh is regenerated automatically based on the
current position and direction of the viewer. On an
Oculus Quest headset it takes 0.25 s to recreate a ter-
rain with a vertex target of 1,000,000 (the resulting
mesh actually contains 1.15 × 10
6
vertices). This en-
sures that any region that the viewer pauses to look
at is then rendered with higher detail. Rendering of
GRAPP 2022 - 17th International Conference on Computer Graphics Theory and Applications
144

the mesh does not significantly impact the responsive-
ness of the VR application as mesh generation is per-
formed asynchronously.
5 DISCUSSION AND
OPPORTUNITIES
Slippy maps enable standardization of coordinate sys-
tems, multiple sources of quality tile sets that provide
vegetation coverage, roads and buildings, and altitude
data, as well as a range of online services provid-
ing access to these tiles. A slippy map philosophy
assumes unlimited server tile storage traded against
client performance and spatial locality. The second
focus of this investigation is to identify opportunities
to adapt and extend the slippy map concepts through
consideration of the VR/AR mapping context.
The quad-tree structure and slippy map tile pyra-
mid provide control of level-of-detail. Dynamic con-
trol of tile resolution would provide finer grained
control over vertex budgets, using extra tiles pre-
generated on the server and accessed using an addi-
tional tile coordinate. The quad-tree is always con-
structed to fully cover the table top region to en-
sure that change of viewpoint, common is VR, never
shows a partial landscape while the terrain mesh is re-
generated. The quad-tree is adaptively refined based
on the view frustum so extra detail is still provided
based on the camera proximity and direction. The
raster rendering approach used in the algorithms pre-
sented in section 3, that collapse the tile tree to a grid
and render of texture tiles to a single texture image,
ensures that low zoom tiles are automatically used to
replace any missing tiles at a higher zoom level. This
also enables the VR experience to be relevant and re-
sponsive even while additional tiles are being trans-
ferred from the server.
Altitude tiles encourage the use of boundary rep-
resentation terrain models. In this context, the under-
water environment contains a usable volume between
sea floor and water surface that is actively inhabited
and utilized and could, for example, make use of a
voxel based tile (Galin et al., 2019) to extend up and
down (Jurado et al., 2018) and include data from other
fields and disciplines (Christophe, 2020). Slippy tile
coordinates could be made continuous in ways that
support blending of tile textures across different zoom
levels, or to reducing seams. Slippy map tiles tend to
focus on bitmaps. Other tile formats are already being
explored that allow representation of overhangs (Ku-
mar et al., 2018), and produce progressive TINs suited
to slippy map tile structures (Ai et al., 2019; Campos
et al., 2020).
Many of these ideas could be introduced while
remaining backward compatible with existing slippy
tile clients while providing opportunities to enhance
VR/AR terrain presentation.
6 CONCLUSION
This paper presents the viewpoint sensitive level-of-
detail algorithm that mixes slippy map tiles across
zoom levels to generate landscape visualizations for
table top VR/AR presentation. The process benefits
from slippy map characteristics: the ability to use low
zoom tiles to unobtrusively provide a rapid early ap-
proximation even while loading higher resolution tiles
and responsiveness through caching tiles for the lo-
cal view area. Further opportunities that are identified
and exploited include instant localized pan and zoom
by invisibly managing a mesh larger than the table,
and ways to integrate the process into the game loop
pattern employed in VR/AR applications on mobile
platforms.
This research is a stage in an ongoing process of
applied cross-disciplinary research. The immediate
outcome: a responsive landscape for VR/AR provides
an artefact that is immediately usable by collabora-
tors from other disciplines. Opportunities are identi-
fied for further enhancing the process and augmenting
slippy map concepts by varying properties currently
kept constant, adapting the shape of the tile pyramid,
extending the type of information stored in a tile and
what it represents, and constraining the relationships
between tiles at adjacent zoom levels. These opportu-
nities are achieved through the systematic derivation
of the algorithm presented which would be lost when
using third party implementations and focusing only
on the evaluation of the system.
It is rewarding that even with a well-established
problem of providing adaptive level-of-detail in land-
scape visualization, and while using the established
technology of slippy maps, that opportunities can still
be identified to investigate new directions and to fur-
ther refine these industry standards.
REFERENCES
Ai, Wang, Yang, Bu, Lin, and Lv (2019). Continuous-
scale 3d terrain visualization based on a detail-
increment model. ISPRS International Journal of
Geo-Information, 8(10):465.
Campos, R., Quintana, J., Garcia, R., Schmitt, T., Spoel-
stra, G., and Schaap, D. M. A. (2020). 3d simplifi-
Opportunities with Slippy Maps for Terrain Visualization in Virtual and Augmented Reality
145

cation methods and large scale terrain tiling. Remote
Sensing, 12(3):437.
Cao, W., Huang, L., Hu, Y., Xu, D., Ren, H., and Yang,
J. (2019). An improved algorithm for terrain render-
ing. In IGARSS 2019 - 2019 IEEE International Geo-
science and Remote Sensing Symposium. IEEE.
Christophe, S. (2020). Geovisualization: Multidimensional
exploration of the territory. In Proceedings of the 15th
International Joint Conference on Computer Vision,
Imaging and Computer Graphics Theory and Applica-
tions. SCITEPRESS - Science and Technology Publi-
cations.
Duchaineau, M., Wolinsky, M., Sigeti, D. E., Miller,
M. C., Aldrich, C., and Mineev-Weinstein, M. B.
(1997). Roaming terrain: Real-time optimally adapt-
ing meshes. In Proceedings of Visualization 97, pages
81–88.
Dumont, M., Touya, G., and Duchêne, C. (2020). De-
signing multi-scale maps: lessons learned from exist-
ing practices. International Journal of Cartography,
6(1):121–151.
Easson, L., Tavakkoli, A., and Greenberg, J. (2019). An
automatic digital terrain generation technique for ter-
restrial sensing and virtual reality applications. In Ad-
vances in Visual Computing, pages 619–630. Springer
International Publishing.
Farkas, G. (2017). Applicability of open-source web map-
ping libraries for building massive web GIS clients.
Journal of Geographical Systems, 19(3):273–295.
Galin, E., Guérin, E., Peytavie, A., Cordonnier, G., Cani,
M.-P., Benes, B., and Gain, J. (2019). A review of
digital terrain modeling. Computer Graphics Forum,
38(2):553–577.
Jurado, J. M., Alvarado, L. O., and Feito, F. R. (2018). 3d
underground reconstruction for real-time and collab-
orative virtual reality environment. In WSCG 2018 -
Short papers proceedings.
Kalem, S. and Kourgli, A. (2015). Large-scale terrain
level of detail estimation based on wavelet trans-
form. In Proceedings of the 10th International Con-
ference on Computer Graphics Theory and Applica-
tions. SCITEPRESS - Science and and Technology
Publications.
Kang, H., Sim, Y., and Han, J. (2018). Terrain rendering
with unlimited detail and resolution. Graphical Mod-
els, 97:64–79.
Krämer, M., Gutbell, R., Würz, H. M., and Weil, J. (2020).
Scalable processing of massive geodata in the cloud:
generating a level-of-detail structure optimized for
web visualization. AGILE: GIScience Series, 1:1–20.
Kumar, K., Ledoux, H., and Stoter, J. (2018). Com-
pactly representing massive terrain models as TINs in
CityGML. Transactions in GIS, 22(5):1152–1178.
Larrick, G., Tian, Y., Rogers, U., Acosta, H., and Shen,
F. (2020). Interactive visualization of 3D terrain data
stored in the cloud. In 2020 11th IEEE Annual Ubiq-
uitous Computing, Electronics & Mobile Communica-
tion Conference (UEMCON). IEEE.
Lee, E.-S. and Shin, B.-S. (2019). Hardware-based adaptive
terrain mesh using temporal coherence for real-time
landscape visualization. Sustainability, 11(7):2137.
Li, S., Zheng, C., Wang, R., Huo, Y., Zheng, W., Lin, H.,
and Bao, H. (2021). Multi-resolution terrain rendering
using summed-area tables. Computers & Graphics,
95:130–140.
Masó, J. (2019). OGC two dimensional tile matrix set.
techreport 17-083r2, Open Geospatial Consortium.
Menegais, R., Franzin, F., Kaufmann, L., and Pozzer, C.
(2021). A raster-based approach for waterbodies
mesh generation. In Proceedings of the 16th Inter-
national Joint Conference on Computer Vision, Imag-
ing and Computer Graphics Theory and Applications.
SCITEPRESS - Science and Technology Publications.
Open Source Geospatial Foundation (2012). Tile map ser-
vice specification. https://wiki.osgeo.org/wiki/Tile_
Map_Service_Specification. Accessed: 11/09/2021.
Richardson, M., Jacoby, D., and Coady, Y. (2018).
Retrofitting realities: Affordances and limitations in
porting an interactive geospatial visualization from
augmented to virtual reality. In 2018 IEEE 9th An-
nual Information Technology, Electronics and Mobile
Communication Conference (IEMCON). IEEE.
GRAPP 2022 - 17th International Conference on Computer Graphics Theory and Applications
146
